
Navigating the intricate maze of software development can feel daunting. Every twist and turn due to external entities brings new challenges, complexities, and nuances. Enter context diagrams.
These diagrams offer clarity amidst chaos, laying out the bigger picture and the finer details of each external entity. And with ClickUp’s impeccable context diagram templates, you’re not just charting a path—you’re setting the gold standard for organization and clarity.
10 Context Diagram Templates for Software Development in 2024
- What is a Context Diagram Template?
- What Makes a Good Context Diagram Template?
- 10 Context Diagram Templates to Use in 2024
- 1. ClickUp Context Diagram Template
- 2. ClickUp Data Flow Diagram Template
- 3. ClickUp Block Diagram Template
- 4. ClickUp UML Class Diagram Template
- 5. ClickUp Process Flow Chart Template
- 6. ClickUp Pert Chart Template
- 7. ClickUp T Chart Template
- 8. ClickUp Swimlane Flowchart
- 9. ClickUp Software Development Template
- 10. ClickUp Data Analysis Report Template
What is a Context Diagram Template?
A Context diagram template is like a simple map for software projects. It shows how the main software (or system) connects and interacts with external entities.
A system context diagram gives a clear view of the main connections and the external factors. Think of a context diagram like looking at an airport map: You can easily see where the terminals and main gates are without seeing every single shop inside.
A context diagram tool is essential for software developers to understand how their software interacts with other parts.
What Makes a Good Context Diagram Template?
A good context diagram template captures the high-level view of a system’s interactions without overwhelming it with too much detail. Whether you’re designing for a mobile app or an enterprise system, the template should be customizable to fit your unique project needs.
You might want to consider creating various versions of the template for different system types (e.g., mobile apps, web applications, enterprise systems) and then tailoring them further for specific projects within those categories.
10 Context Diagram Templates to Use
Below are our favorite context diagram templates on the market in 2024.
1. ClickUp Context Diagram Template
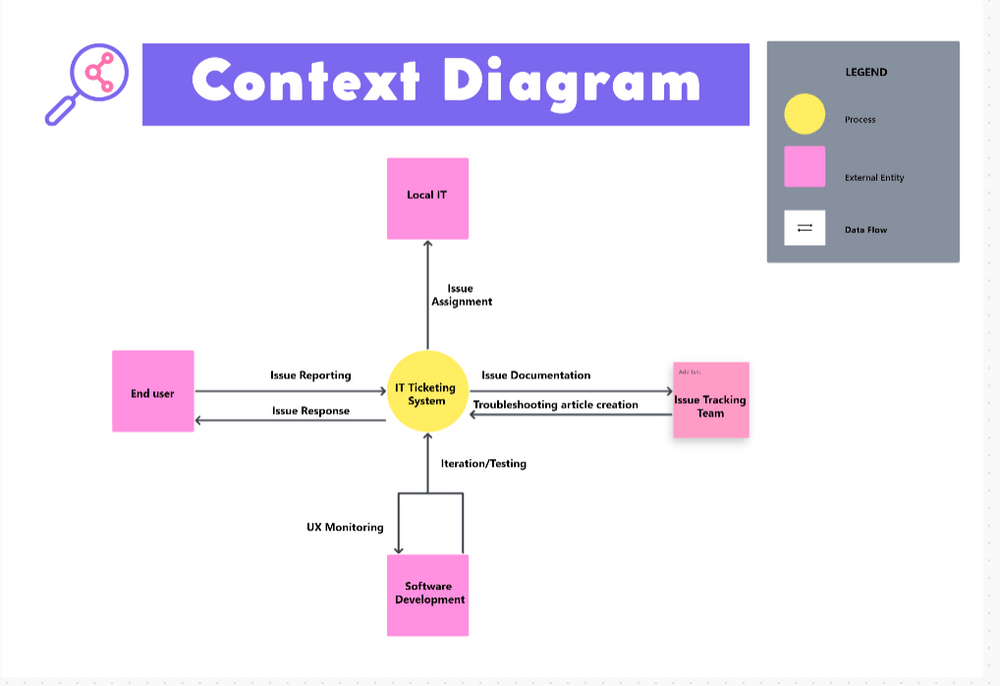
Navigate your software development with clarity using the ClickUp Context Diagram Template. This context diagram template provides a big picture of the entire software system process without bogging you down in detail. Essentially, a context diagram sets your entire system in its environment or context so you can get a feel for how your system interacts with external entities.
From software developers and project managers at startups to business analysts and system architects at tech giants, this context diagram template ensures your team never loses sight of the bigger picture.
This context diagram template serves as the starting point for more detailed diagrams like the Data Flow Diagram Template we cover below.
2. ClickUp Data Flow Diagram Template

Illustrate how information moves through your system with the ClickUp Data Flow Diagram Template. From data origins to its eventual destination, this template helps you detail information sources, understand where that data is stored, and the paths it takes along the way.
A data flow diagram is a great communication tool for cross-functional teams, so roles with technical knowledge can explain information processes to non-technical stakeholders. By mapping out the entire data flow, it’s easier for everybody to pinpoint inefficiencies, redundancies, and potential areas for error within the system.
Dive deep into workflow automation and refine your data flow process with this essential template.
3. ClickUp Block Diagram Template
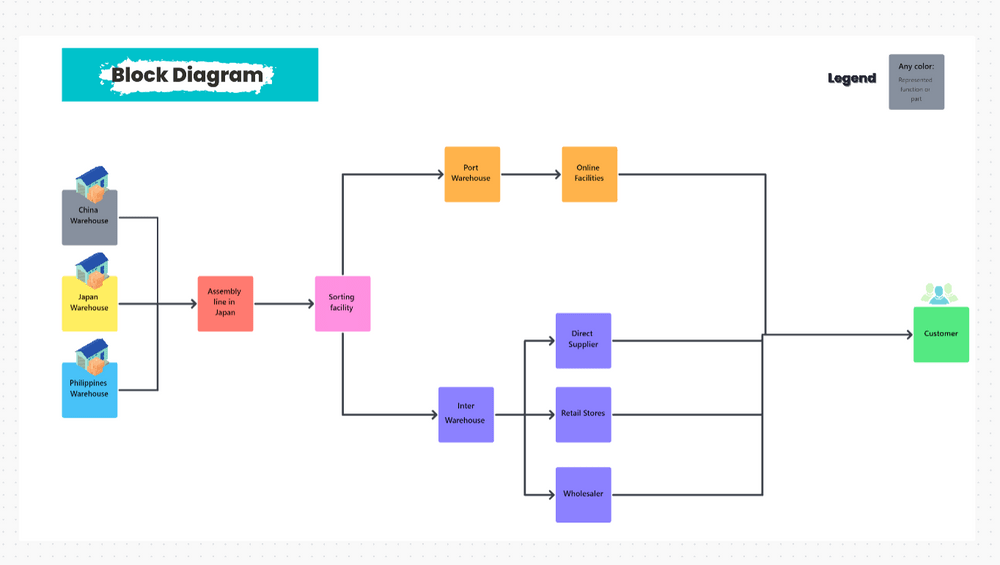
Visualize the main components of your system using the ClickUp Block Diagram Template. This template uses blocks to depict your system’s main components or functions. Then, you can draw lines between the blocks to show the different relationships and interactions in a single process.
The block diagram template is a great way for engineers and systems designers to break down and simplify complex systems so they can get a high-level overview of how different parts connect and flow together.
Just about anybody who needs to describe a process visually can enhance their project execution with this straightforward guide.
4. ClickUp UML Class Diagram Template
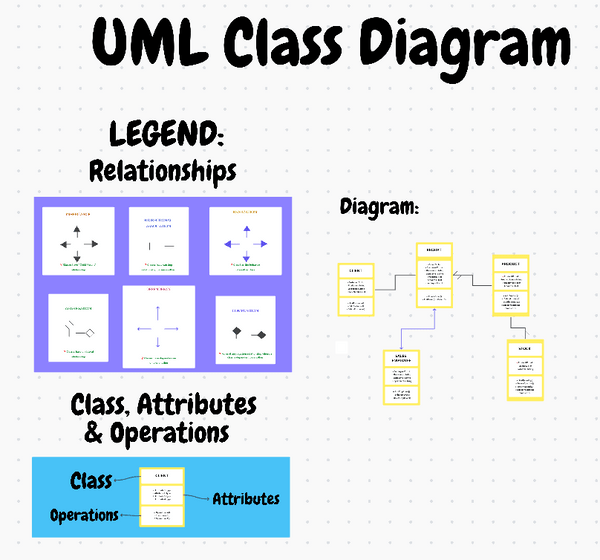
A UML Class Diagram (short for Unified Modeling Language) represents the structure of a system by illustrating the system’s classes, defining their attributes, describing their operations, and depicting the relationships between each class or object.
In other words, the ClickUp UML Class Diagram Template acts like a blueprint of your system, showing you what interacts with what so you can better understand and modify the system.
5. ClickUp Process Flow Chart Template
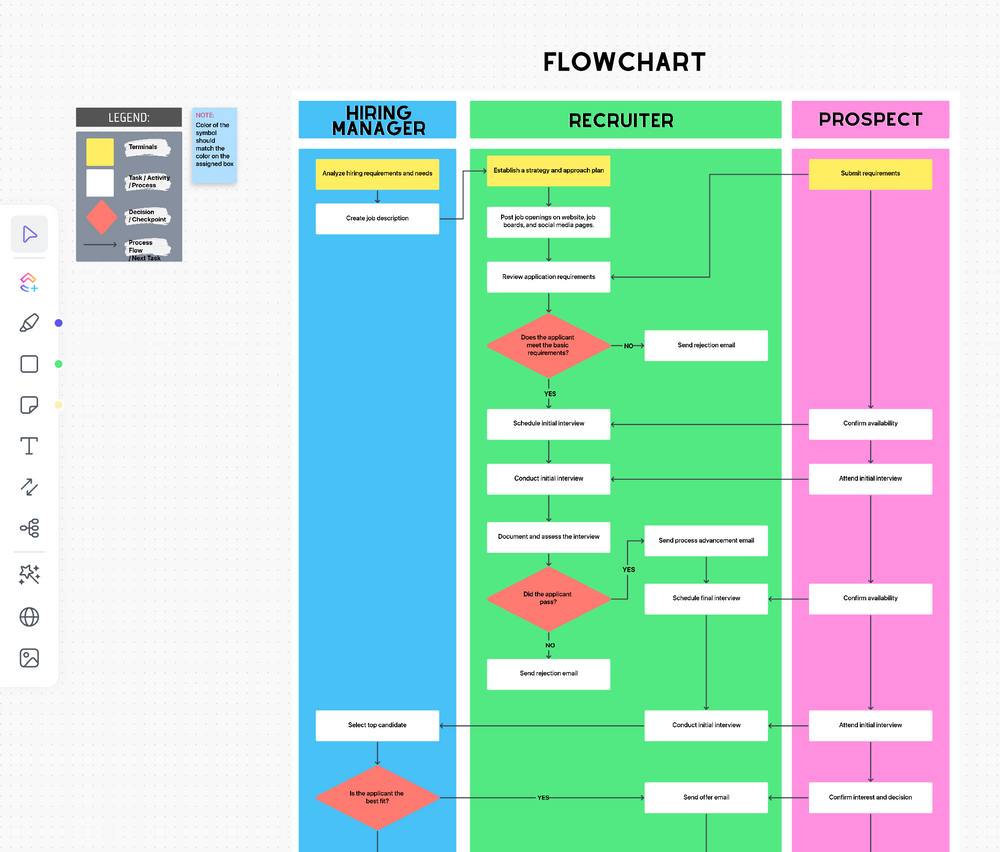
Graphically represent every step of your process from start to finish with the ClickUp Process Flow Chart Template. This is a simple way to get your feet wet with process mapping tools. Whether you’re an HR manager mapping out a new employee onboarding process, a quality assurance team member looking for potential areas of improvement in the product development process, or a project manager trying to identify bottlenecks, this template is your best ally.
It’s easier to follow even complex processes with this visual guide.
6. ClickUp Pert Chart Template
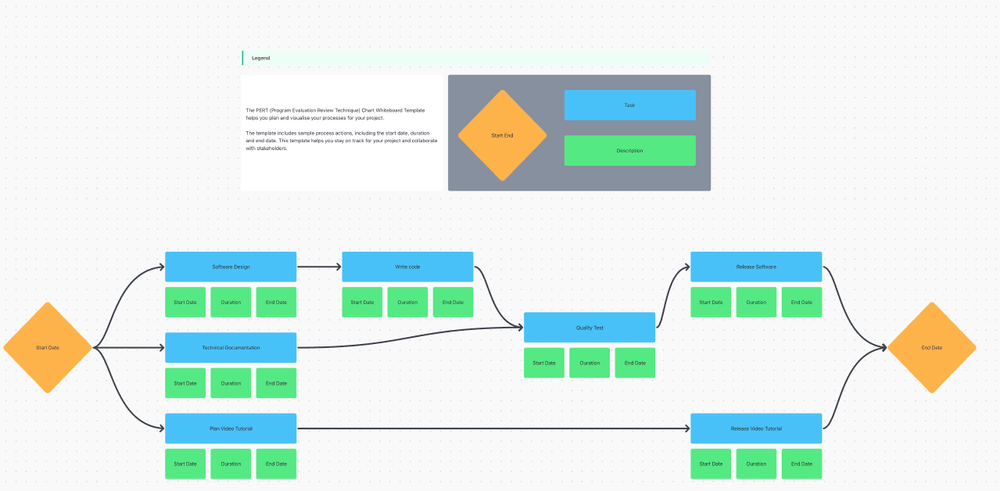
A PERT (or Program Evaluation Review Technique) Chart is a visual representation used in projects to analyze, organize, and schedule tasks within a project.
Try the ClickUp PERT Chart Template to make projects easy. This chart helps you determine the sequence of tasks, the dependencies needed to get those tasks done, and how long a project should take to get done.
Project managers love this template because it helps them schedule, coordinate, and monitor specific tasks within a project. It makes it easy for team members to understand their roles and the sequence of events from start to finish.
Meanwhile, risk management teams can use our PERT Chart Template to identify potential bottlenecks and delays in the project.
7. ClickUp T Chart Template
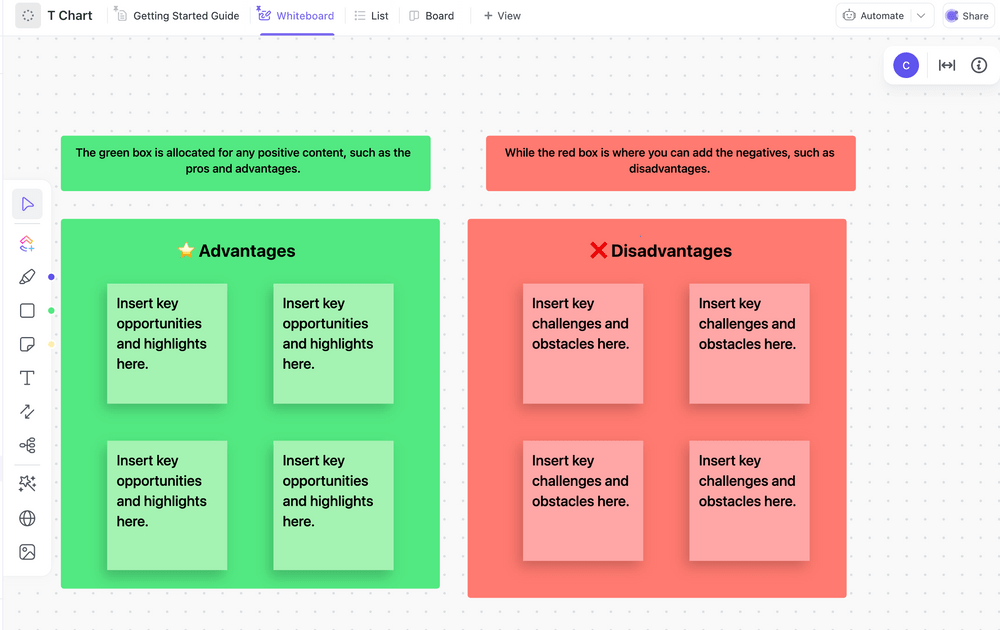
Weigh pros and cons seamlessly with the ClickUp T Chart Template.
This T Chart Template lets decision makers visually organize information. The topic or criterion under analysis is at the top of the “T.” Two columns are beneath. This is where you can compare and contrast two different ideas or concepts.
It’s a great tool for analysts, product managers, and anyone who needs to make an informed decision. Users love this template for its simplicity and versatility.
8. ClickUp Swimlane Flowchart
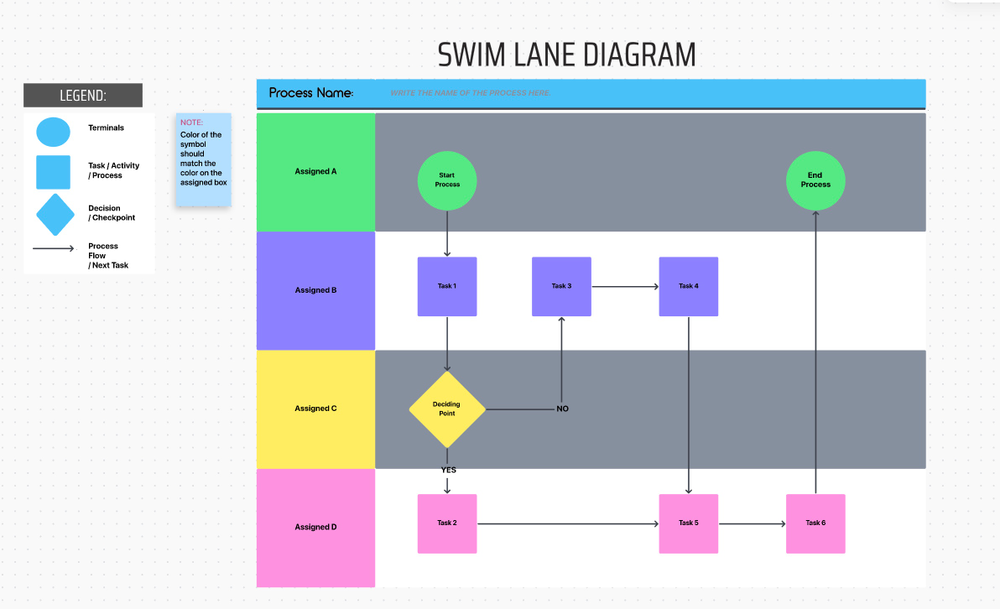
Organize tasks by team or department using the ClickUp Swimlane Flowchart Template.
Our Swimlane Flowchart Template contains visual “lanes” that can represent departments, functions, project stakeholders, or external stakeholders like an online community.
This layout makes it evident who is responsible for each step in a process, streamlining projects and reducing potential confusion.
The template can be easily adapted to fit different industry needs. And, if you want more swimlane options, we’ve got 10 more great swimlane templates for you!
9. ClickUp Software Development Template
Software teams require structure and collaboration for success. ClickUp’s Software Team Template addresses this by streamlining tasks across departments.
Tailored for software teams, this software development plan template enables quick project organization, visual dashboards for inter-departmental visibility, and precise task and performance tracking. This template works seamlessly with our other project status report templates, so you always know exactly where things stand with your project. Need more productivity hacks? Check out our favorite Google Chrome extensions for software developers.
Whether managing a small team or a large, multifaceted project, this tool bolsters efficiency and collaboration.
10. ClickUp Data Analysis Report Template
Data analysis is paramount for businesses, guiding decisions and preventing costly errors. ClickUp’s Data Analysis Report Template offers a solution for quick, precise data interpretation.
It enables rapid and accurate data insight extraction, cohesive sharing of findings, and decision-making based on fresh, reliable data.
Whether it’s decision analytics or sales forecasting, this template ensures accuracy and speed. Utilizing a data report template facilitates the following:
You can set report goals and project management KPIs, collect and analyze data, and then compile and share your reports, all straight from this template.
Optimize Your Workflows with Context Diagram Templates
Instead of juggling multiple tools, ClickUp provides an all-in-one context diagram solution. You can map out your processes and data flows, analyze bottlenecks, and envision optimizations—all within a singular platform.
Real-time updates, in-app communication, and shared views mean everyone stays in the loop, reducing miscommunication and enhancing productivity. As your projects grow and evolve, your management tool remains consistently effective!
ClickUp’s seamless interface and customizable dashboards translate complex data flow into digestible, actionable insights. Context diagrams are vital for anyone keen on understanding systems at a glance. ClickUp offers templates that simplify the creation of these diagrams, ensuring that teams can instantly grasp system boundaries and interactions.


Everything you need to stay organized and get work done.

Recent Articles
Free Career Path Templates in Excel to Plan Professional Growth 
Free Career Path Templates in Excel to Plan Professional Growth
10 Free OKR Templates in Excel, Google Sheets, and ClickUp
10 Free OKR Templates in Excel, Google Sheets, and ClickUp
10 Free Skills Matrix Templates in Excel, Sheets & ClickUp
10 Free Skills Matrix Templates in Excel, Sheets & ClickUp
