
The concept of entity relationship diagrams (ERD or ER diagrams) can be traced back to the late 1970s—when disco reigned supreme and personal computers were still in their infancy. Fast forward to today, and ER diagrams have evolved into indispensable tools for programmers and data engineers! 🕺
Entity relationship modeling is a database design technique to visualize how data should be stored within a system. It’s an intense graphical process that requires handling large datasets to draw connections and extract insights.
Creating and tailoring a new entity relationship model from the ground up can be a formidable undertaking. This is where professionally crafted ERD templates come in, serving as practical launchpads for database designers.
In this article, we’ll present the 10 best templates for ERD modeling and help you find the right pick!
10 ERD Templates to Build Stronger Database Blueprints (PowerPoint & ClickUp)
- What is an ERD Template?
- 10 Adaptable ClickUp and PowerPoint ERD Templates
- 1. ClickUp Entity Relationship Diagram Template
- 2. ClickUp Process Flow Chart Template
- 3. ClickUp Block Diagram Template
- 4. ClickUp Context Diagram Template
- 5. ClickUp Data Flow Diagram Template
- 6. ClickUp UML Class Diagram Template
- 7. ClickUp Project Network Diagram Template
- 8. PowerPoint ERD Template by SlideEgg
- 9. PowerPoint ER Model Template by SketchBubble
- 10. PowerPoint ERD Template by SlideTeam
What is an ERD Template?
An entity relationship diagram or ERD template is a pre-designed visual tool that helps you create clear and structured representations of data models. It’s equipped with standard placeholders used in database design and management to illustrate the relationships between various data components, connection points, and users within a system.
Most ERD templates come with customizable shapes, symbols, and connectors to represent entities, attributes, and associations. The visual framework makes it easy for the data modeler to ideate, plan, communicate, and implement complex data systems.
You can typically apply an ERD template to any data model—conceptual, logical, or physical. Common use cases include:
- Building business data frameworks
- Investigating an existing information base
- Redesigning business measures with new datasets
- Simplifying databases for non-tech users
An ERD template can be a key collaborative tool as it helps incorporate multiple perspectives into your database design, ensuring the process is well-documented, and the final output is free from errors and flaws.
What makes a good ERD template?
When choosing ERD templates, consider the following factors in addition to your specific requirements:
- Clear design: The template should offer intuitive visualization alongside transparent identifiers for primary and foreign keys, making it easy to understand complex one-to-many or many-to-many relationships between entities
- ERD symbols: Users should be able to access and customize entity shapes, connector styles, and notations to suit their specific needs and preferences
- Ease of use: It should have a user-friendly, preferably drag-and-drop interface that simplifies the process of adding, modifying, or deleting entities and relationships
- Proofing and documentation: The template should support annotations or descriptions, enabling users to add explanatory notes or exchange feedback
- Compatibility: It should be compatible with popular diagramming software or database tools to facilitate sharing and centralizing work
- Scalability: The template should accommodate simple to complex data models, preferably on infinite digital whiteboards
- Collaboration: Real-time editing and commenting options allow multiple team members to work on the same diagram simultaneously
10 Adaptable ClickUp and PowerPoint ERD Templates
The perfect template can significantly cut down the time and effort you spend on defining entity attributes and grouping data components. To save you the hassle, we’ve curated a selection of 10 well-designed ERD templates by ClickUp and PowerPoint to help illustrate your data diagrams. 🌟
1. ClickUp Entity Relationship Diagram Template
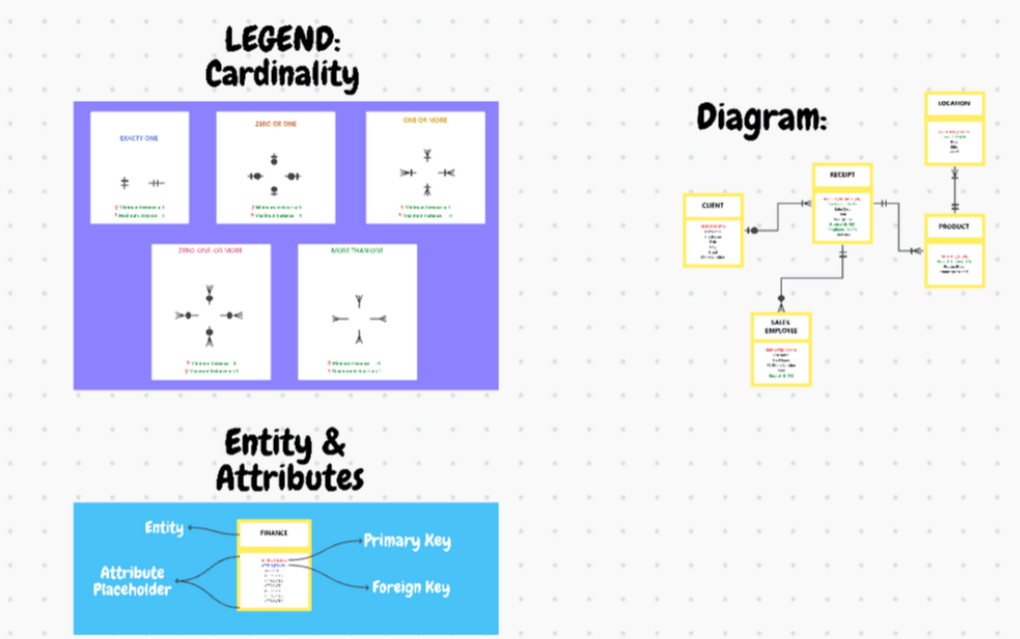
The ClickUp Entity Relationship Diagram Template provides versatile tools and design elements to build data structures for any industry or niche. This template is based on ClickUp’s infinite Whiteboards, which ensures your ER models are scalable for any size and complexity level.
By default, this ERD template is divided into three sections:
- Entity & Attributes: For outlining the participating entities and their attributes
- Cardinality: For mapping out relationship types within entities. For example, one-to-many or many-to-many
- Diagram: Presenting a live visual of your database flows
Use the template’s Custom Fields to effortlessly designate primary and foreign keys for identifying different entities. This will help you build clear relationships within your dataset.
Within the Whiteboard view, you’ll find an editing toolbar and an extensive ERD shape library. Drag and drop shapes, connectors, and other elements to customize your diagram for any data system. For example, if you are creating an online store, you can use the template to show how customers, products, and orders connect in the workflows. 🖇️
Leverage ClickUp’s powerful Automations to handle tedious aspects of ER modeling and save time. For example, you can use automation to apply primary or foreign key constraint rules to your database schema, ensuring your diagram is free from mistakes or inconsistencies.
Need to centralize your ERD documentation? Use ClickUp Docs to document and store valuable insights, notes, and explanations about your data model. They serve as comprehensive records of your design process and help brainstorm future updates.
2. ClickUp Process Flow Chart Template
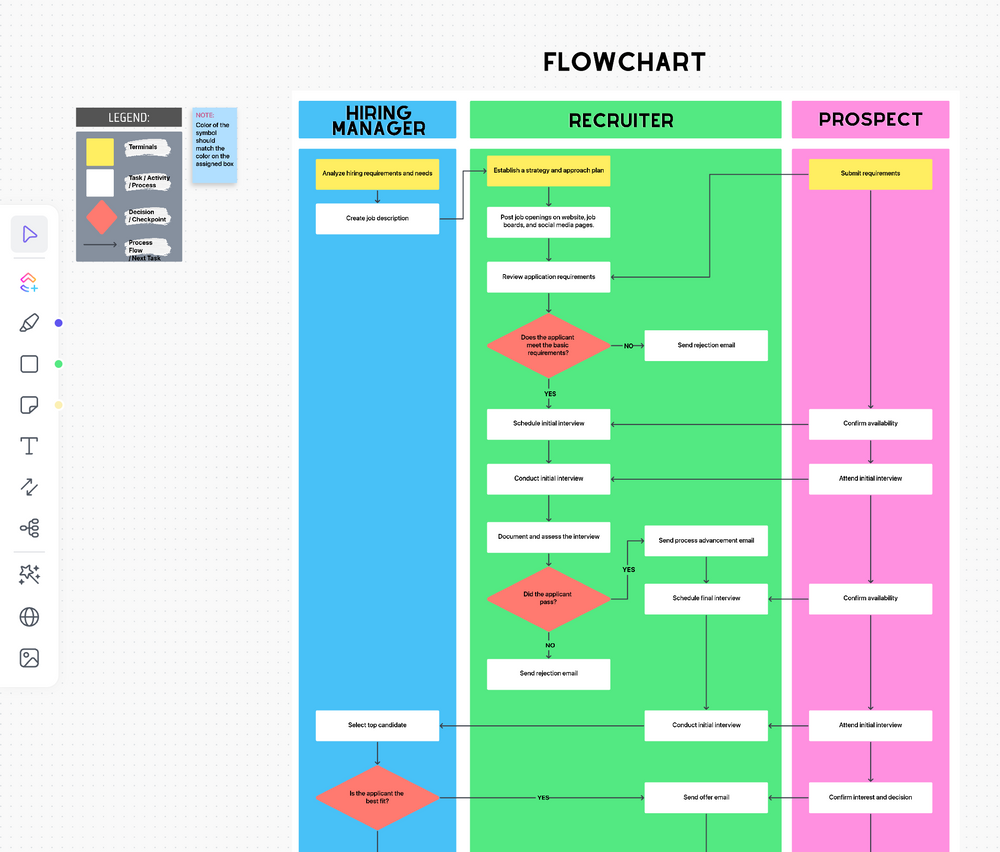
The ClickUp Process Flow Chart Template is a digital whiteboard that makes it easy to visualize and troubleshoot complex data flows throughout your organization. You’re creating a map of core data points and showing how they interact with your daily processes.
This beginner-level ERD template simplifies the creation of entity relationship diagrams by letting you construct step-by-step task flows between information centers in the right order. Just update the preset entities and attributes on the template to match your needs, and use the available connectors to start drawing out relationships. 🖍️
Sketch rough diagrams and instantly share them with team members for valuable input, enhancing collaboration and ensuring everyone is aligned with the data structure. However, for highly intricate workflows, we recommend using Gantt Charts within ClickUp to map out the order of tasks cohesively and get a big picture of your processes.
Whether tackling production planning or distribution logistics, you can easily tailor the structure to fit any type of ER diagram. For instance, if you’re a tired, gasping-for-breath hiring manager, the template’s Hiring Flowchart view can save your day. It helps you craft a flowchart that outlines the responsibilities for each stage of recruitment, such as posting job openings, conducting interviews, and making job offers.
3. ClickUp Block Diagram Template
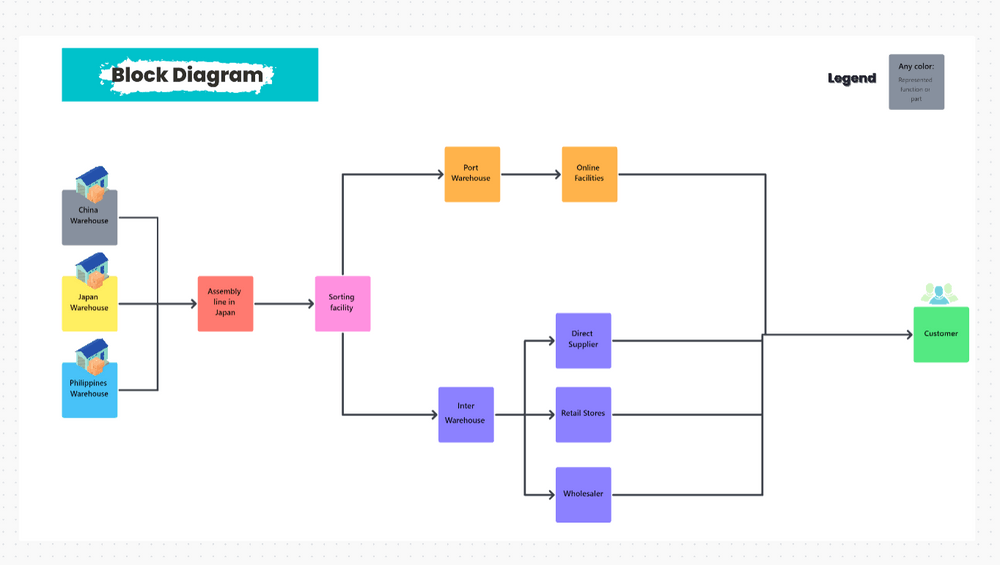
The ClickUp Block Diagram Template is a one-stop ER diagram tool for all your block diagramming needs, including crafting no-fuss ER models. For the uninitiated, a block diagram refers to an intricate flowchart that uses block symbols and lines to visualize the components of a multi-level system or process. In fact, an ERD is a type of block diagram.
This template allows you to depict relationships and flows between entities seamlessly. It comes with customizable color-coded blocks to represent unique elements of your dataset, which would vary depending on your project or industry.
Let’s say you’re an electronics manufacturer—rather than drowning in system intricacies, use this template to envision a simplified path from factory to customer for your product. You may want to define key entities like local and international warehouses, suppliers, and retail stores, representing the main blocks. Now, with just a few strokes, you connect these blocks with lines to depict the journey of raw materials, parts, or finished products, unraveling an easy-to-follow view of the distribution web.
Sharing your diagram with other departments or team leaders? With ClickUp’s Zoom integration, you can effortlessly set up video conferences to discuss database design matters with stakeholders in real time.
4. ClickUp Context Diagram Template
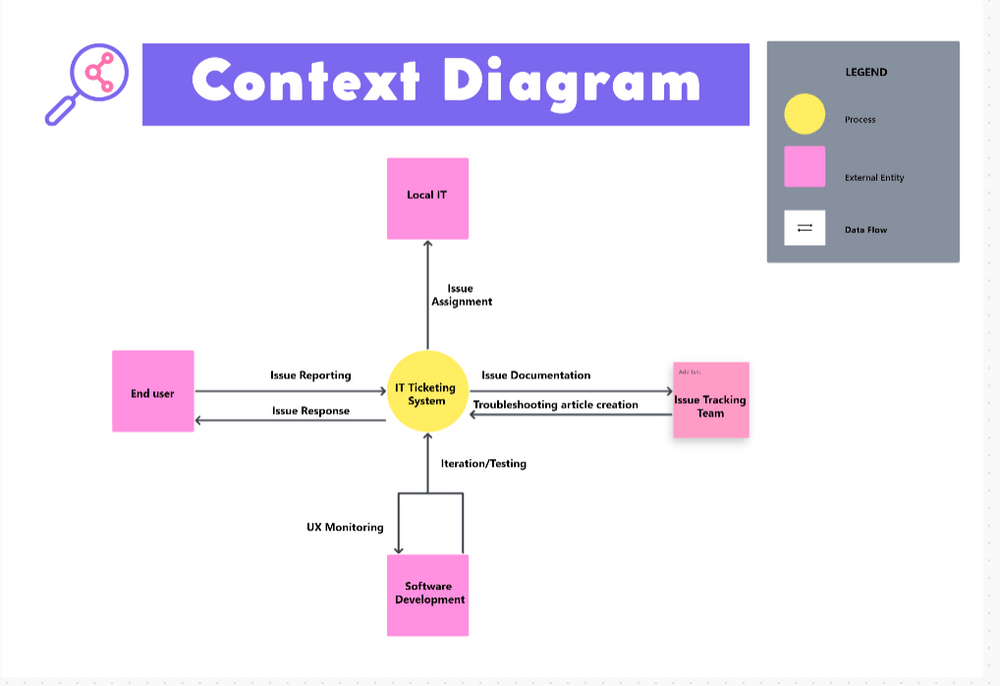
The ClickUp Context Diagram Template orchestrates an intricate symphony of inputs, outputs, and processes, painting a comprehensive portrait of your system. Sounds fancy? Let’s break it down for you!
Many database designers would compare a context diagram to the conductor’s baton, ensuring all elements within a system harmonize to reach a common goal. Think of this template as a map that positions your database within its environment, allowing you to understand how it interacts with internal and external entities without drowning in boring details.
The template offers flowcharting through three standard components:
- Yellow circles for the primary process 🟡
- Pink squares for external or internal entities 🟪
- No-frills connector lines to display data flows ↔️
Picture this: You’re managing an IT ticketing system. To ensure smooth customer support, you must juggle user requests, ticket assignments, resolution options, and more. The template becomes your trusted aide, allowing you to note the data flow meticulously with its professionally designed layout and toolbox.
You can begin brainstorming ideas in the template’s Whiteboard view, visualize relationships between entities (like customers, support staff, and engineers), and map out the journey of a customer request from submission to resolution as you sketch out the context diagram.
5. ClickUp Data Flow Diagram Template
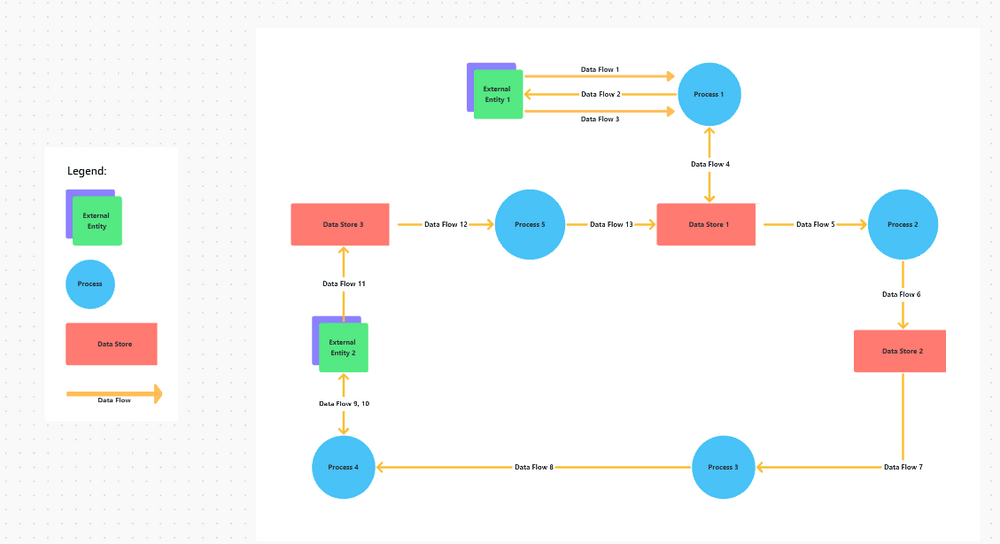
The ClickUp Data Flow Diagram Template is a powerful framework offering an intuitive, drag-and-drop interface with adjustable shapes that help visualize and build ER diagrams efficiently. It’s ideal for optimizing standard data flow diagrams for all types of systems, decision points, and communication channels. This enables admins to predict delivery bottlenecks or productivity problems within existing processes.
This Whiteboard template might as well be a recipe card for data within a computer system. Instead of ingredients and cooking steps, it illustrates how data moves from one point to another using these four symbols:
- Green squares to denote external entities
- Blue circles for processes
- Red rectangles show data stores
- Orange arrows represent data flows
To illustrate the use case of this template, let’s consider the journey of a package in a postal system. You start at the point where the package enters the postal network. You can denote the origin facility, transportation hubs, and destination facility as entities or data stores. Actions like stamping and sorting would constitute processes. Then, you need to trace the package’s path as it moves through various city locations to reach the final destination. 📦
6. ClickUp UML Class Diagram Template
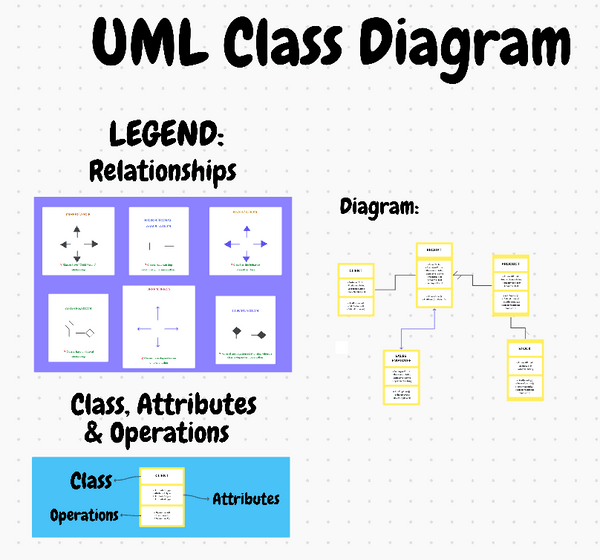
The ClickUp UML Class Diagram Template is designed to help software teams create, share, and track class diagrams—no surprise here! Its main goal is to promote understanding of data systems across different versions, facilitating efficient coding.
Picture this template as a toolbox for representing a static view of an application, helping you leverage UML (Unified Modeling Language) diagrams to represent three components:
| Class Name or Classifier | Denotes objects that share similar relationships or semantics |
| Attributes | Represents the information or properties of the classifier |
| Operations | Showcases how a class interacts with data |
With this UML diagram template, you can effortlessly organize classes into logical groupings, all within the Whiteboard view. Identify relationships between classes and customize the template to align with any data-centric project, whether carving out an abstract factory design or shaping a domain model for an e-commerce website.
If collaborating with a team, use the Board view in ClickUp to set up To Do tasks within your UML class diagram. Update the statuses to In Progress or Done as you go so that your stakeholders are always in the loop.
7. ClickUp Project Network Diagram Template
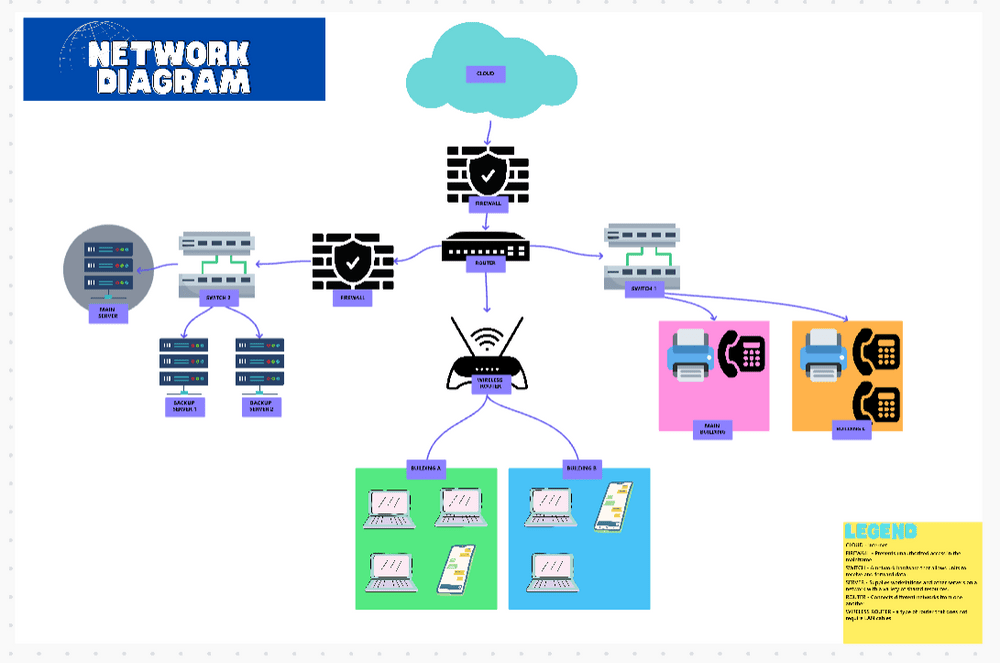
When your project starts resembling a chaotic pile of disconnected pieces, the ClickUp Project Network Diagram Template can be your lifeline! It acts as a customizable blueprint for mapping out the sequence of activities and tasks essential for project execution. 🧩
While this template is primarily designed for representing project management tasks and their dependencies, it can be tweaked to create a basic ERD for any database. Its digital Whiteboard visualizes project components as nodes and their interconnected elements as links. For complex networks, arrows play a pivotal role in depicting the chronological order in which tasks must be accomplished to achieve project success.
The template supports all types of network diagrams, whether a case diagram, a business plan, or a marketing strategy. You can use it to:
- Visualize task interconnections
- Create sequence diagrams for interdependent activities
- Identify resource requirements at each data point
- Anticipate potential delays
- Gain clarity on globally dispersed task relationships
Use the template’s Custom Fields to record start and finish dates and task durations to foresee potential completion risks. The final diagram can illuminate the critical path in your project, helping you identify and prioritize the pivotal tasks that keep your project moving smoothly.
8. PowerPoint ERD Template by SlideEgg
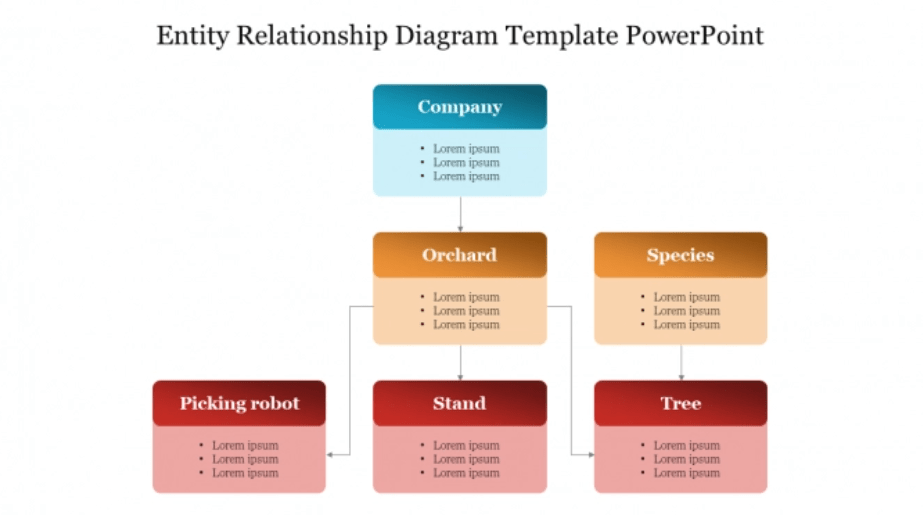
The PowerPoint ERD Template by SlideEgg is a trusted companion for software developers, database administrators, and anyone dealing with complex data structures. It’s compatible with Google Slides and makes creating, understanding, and presenting intricate database structures a breeze.
The ERD chart featured in this template is a powerful visual tool that allows you to illustrate how different entities in a database relate to one another. This is invaluable for planning and designing databases, as it helps you identify potential issues early on, saving time and money in the long run. 💰
You can fully customize your presentations with different slide designs, each in 16:9 and 4:3 aspect ratio formats. Tailor the color scheme and nodes to match your branding.
9. PowerPoint ER Model Template by SketchBubble
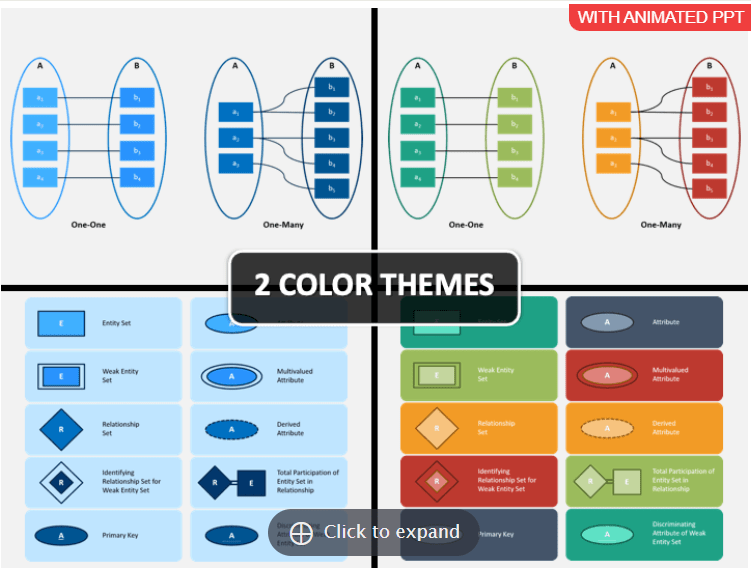
The PowerPoint ER Model Template by SketchBubble is the perfect solution for creating ER models for presentations and delivery programs. Its 12 slides help define data elements and relationships for any system, making it easy to produce and understand schemas.
The template comes with abundant visual assets for mapping out entity relationship models. It offers primary relationship designs, from one-to-one to many-to-many models, ensuring solid conceptual presentations. You can also use professional charts and graphics to engage your audience, create a polished look, and tailor these slides to your requirements. 📊
It has two stunning color theme options and can work with PowerPoint, Keynote, and Google Slides. The template’s HD vector format media items ensure even non-tech users can create attractive data models!
10. PowerPoint ERD Template by SlideTeam
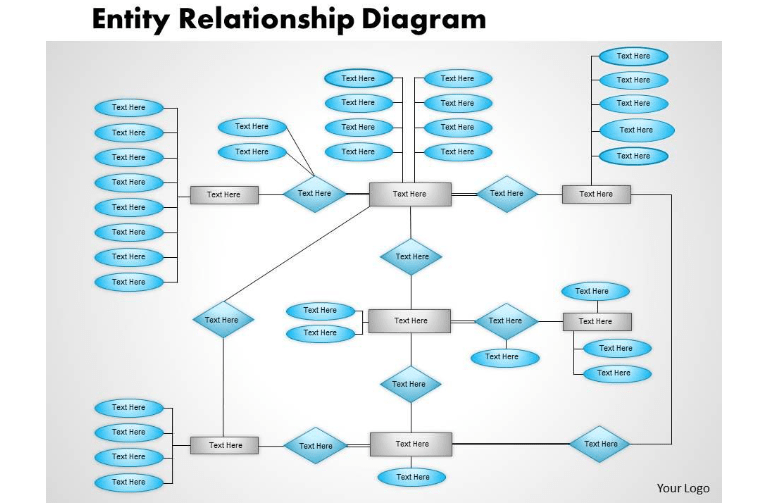
The PowerPoint ERD Template by SlideTeam is a minimalistic yet handy tool for visualizing tangled data structures within information systems.
The template offers a user-friendly solution for creating ER diagrams in PowerPoint presentations. It helps you effortlessly construct graphical representations of entities and relationships through five slides. 🔀
You have complete control over editing and tailoring your diagrams to meet your specific needs. Easily delete or modify text, change shape colors or use gradients, ungroup objects, and even swap out images. These options allow you to create visually appealing and informative ERDs that align perfectly with your presentation content!
Fast-Track Data Modeling with ERD Templates in ClickUp
The templates we presented score in terms of design and usefulness, but if you’re looking for collaborative functionalities and greater control over your design process, go for one of ClickUp’s free ERD templates.
Besides boosting teamwork through Whiteboards, ClickUp offers a Mind Map feature to create insightful flowcharts, enhancing your data modeling experience.
Explore ClickUp’s Template Library to find other suitable options to support your design and software teams!


Everything you need to stay organized and get work done.

Recent Articles
Free Career Path Templates in Excel to Plan Professional Growth 
Free Career Path Templates in Excel to Plan Professional Growth
10 Free OKR Templates in Excel, Google Sheets, and ClickUp
10 Free OKR Templates in Excel, Google Sheets, and ClickUp
10 Free Skills Matrix Templates in Excel, Sheets & ClickUp
10 Free Skills Matrix Templates in Excel, Sheets & ClickUp
