


Still downloading templates?
There’s an easier way. Try a free AI Agent in ClickUp that actually does the work for you—set up in minutes, save hours every week.
Sorry, there were no results found for “”
Sorry, there were no results found for “”
Sorry, there were no results found for “”
Have you considered why a user signed up for your product but left during that crucial onboarding stage? Did you ask for too much information in one step? Was there a lack of clarity? Did you incentivize and reward the user? Did they experience and understand product value?
Well, the answer could be any of those.
Today, customers now have more choices than ever for every product or service, and truthfully, with one tiny hiccup in the onboarding process, users won’t think twice before jumping ship.
So, what can your business do to improve the customer onboarding process and reduce drop-off rates?
The answer lies in monitoring user onboarding metrics. These metrics act as your guide, helping you spot areas to keep, tweak, or improve in your user onboarding process.
In this blog, we will explore how to improve your customer journey, focusing on the onboarding flow.
When you love a picture on Instagram, you share it on your story. When you enjoy a hotel stay, you shower it with a glowing 5-star review on Google.
Validation, right? Businesses thrive on it.
However, there is seldom an instant gratification button or “rate my onboarding experience” pop-up for onboarding users. So, how do you know if your onboarding process works?
That’s where customer onboarding metrics step in as your silent evaluators. These customer onboarding analytics and KPIs help you determine what’s clicking with your users, and what’s quietly driving them away. They uncover the gaps in your onboarding flow and show you exactly where to focus your onboarding efforts.
We’re talking about tracking metrics and KPIs, such as your step completion rate, the percentage of users who stick around after a trial period, and even analyzing customer feedback for insights you need to fine-tune your onboarding strategy.
Don’t want your customers to drop off mid-way while signing up for your product just because they didn’t have clarity on the process?
Here are the important customer onboarding metrics that will help you unlock high activation rates, and potential paying customers.
Time to Value (TTV) is the time it takes for users to experience the moment when they say, “Aha, this is exactly what I was looking for!”
🔍 What It Indicates: Short TTV means users get to their aha moment quickly, reducing the chance of abandoning the product. Long TTV? That’s a red flag—users might not find value fast enough.
🔮 Formula: Measure the time between user signup and the moment they experience the core value of your product. The quicker they get there, the better.
📈 How To Improve It:
📌 Example: A graphic design platform like Canva tracks TTV by measuring how quickly users create their first design using a template, helping them realize the tool’s value in just a few clicks.
The retention rate is like your product’s “stickiness” factor. It shows how well your onboarding keeps users coming back, and renewing their subscriptions.
🔍 What It Indicates: A high retention rate means your onboarding is doing its job—users feel the value and stick around.
🔮 Formula: Retention Rate = (Users Remaining / Initial Users) × 100
For example, if you started with 100 users and 80 still use the product a month later, your first-month retention rate is 80%. The opposite of retention is customer churn, so your churn rate is 20%.
📌 Example: Think about Spotify: their onboarding process is designed to hook users by getting them to build a playlist quickly. If they don’t return after the first session, the chances of retaining them decrease significantly. A high retention rate indicates they enjoy the music, stick with their playlists, and actively use the app.
📈 How To Improve It:
Also Read: How to Optimize Customer Success for SaaS
The activation rate measures how many users hit critical milestones in their first few days of using the product.
🔍 What It Indicates: If users hit their activation points, it shows that your onboarding process is effective and helps users engage with key features. If they don’t? It’s time to revisit the flow.
🔮 Formula: Activation Rate = (Users Who Reached Activation Point / Total Users) × 100
For example, if 60 out of 100 users set up their first campaign on a marketing automation tool within 7 days, that’s an activation rate of 60%.
📌 Example: For an email marketing tool like Mailchimp, reaching the activation point might be creating and sending the first campaign. If new users can easily reach this milestone during the onboarding process, it suggests the tool is intuitive, and users are getting value quickly.
📈 How To Improve It:
The completion rate calculates the total number of users who finish your onboarding process. A low rate means users are getting lost along the way or feeling overwhelmed—both bad signs.
🔍 What It Indicates: A high completion rate indicates your users understand the value of your product and feel comfortable continuing their journey.
🔮 Formula: Completion Rate = (Users Who Finished Onboarding / Total Users) × 100
For example, if 70 out of 100 users finish the full onboarding process, your completion rate is 70%.
📌 Example: A fitness app tracks completion rates by observing how many users complete the initial setup process, such as entering their fitness goals, syncing their wearable devices, and starting their first workout. A high rate shows users are engaged and ready to commit to their fitness journey.
📈 How To Improve It:
Feature adoption rate measures how many users engage with your product’s key features.
🔍 What It Indicates: High feature adoption suggests your users are finding the tools they need and using them to their full potential. Low adoption may indicate confusion or a mismatch between your product’s features and users’ needs.
🔮 Formula: Feature Adoption Rate = (Users Using Feature / Total Users) × 100
For example, if 40 out of 100 users regularly use a new feature (like an automation tool) in your SaaS, your feature adoption rate is 40%.
📌 Example: Let’s say a user on a project management tool like Asana hasn’t used the “timeline view” feature during onboarding. If Asana tracks this and notices low adoption, they can create specific tutorials or prompts to encourage usage.
📈 How To Improve It:
How much effort does it take for users to navigate your product? The Customer Effort Score (CES) is a metric that tracks how easy or hard users think it is to engage with your product.
🔍 What It Indicates: A low CES means your onboarding is smooth, and users can easily find value.
🔮 Formula: Typically measured by asking users, “How easy was it to complete [specific action]?” on a scale from 1 to 7. A lower score indicates less effort.
📌 Example: Think of an online learning platform like Udemy. If users feel like they’re constantly searching for the right course or struggling to use features, their CES will be high. If the platform provides simple filters and easy navigation, users will rate the experience as effortless.
📈 How To Improve It:
When users face challenges during onboarding, they often turn to support. Monitoring the number of support tickets can tell you much about how users interact with your onboarding process.
🔍 What It Indicates: A high number of support tickets means there’s a friction point in your onboarding process that users can’t figure out on their own. It might also indicate poor user experience or confusion about how to use certain features.
🔮 How to measure it: Track the number of support tickets submitted in relation to the number of active users. An increase during the onboarding stages is a red flag.
📈 How To Improve It:
The first rule of tracking onboarding success is picking a few key metrics and measuring them consistently. Remember: Consistency is key here.
Here are a couple of strategies to get you going.
To track essential metrics such as onboarding completion rate and time to value, you need a solid analytics setup.
Because, let’s face it, you can’t improve what you can’t measure, right? Your SaaS business might already rely on tools like Google Analytics or Mixpanel to monitor user interactions.
However, if you prioritize a 360-degree view of your onboarding progress paired with real-time collaboration, ClickUp is the perfect choice.
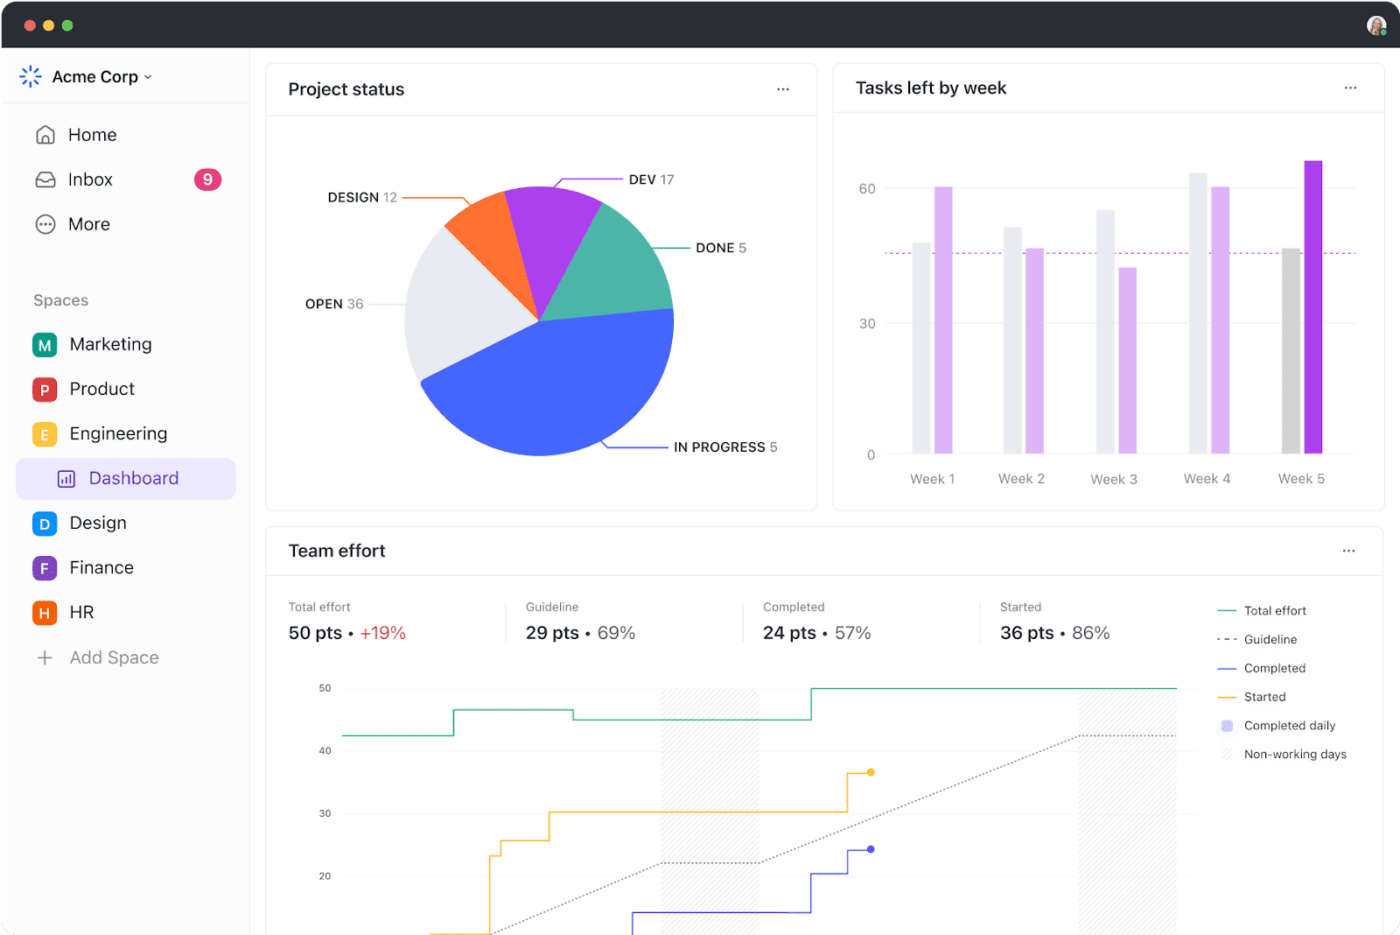
Specifically, ClickUp Dashboards.

Here’s why: these aren’t just your regular data trackers. The real game-changer is their customization, allowing you to handpick the metrics you want to monitor and turn raw data into clear, actionable visuals.
Your welcome screen isn’t just a friendly “hello”; it’s your first shot at gathering critical data. Use this opportunity to ask about user goals, company size, or the jobs they need to do.
Why? This segmentation allows you to personalize the onboarding experience to their specific needs.
You can even create checklists that guide users toward activation. This can be done in minutes using ClickUp’s Form View, which lets you turn survey responses into actionable tasks or gather vital information through client questionnaires.
📌 Example of questions to include:
💡Pro Tip: Use a centralized tool like ClickUp to automate cross-channel campaigns. From email and SMS to social media and push notifications, automation ensures seamless customer interactions and a consistent experience across every touchpoint.
A good onboarding process hinges on data collection since 63% of consumers appreciate personalized messages.
You must explore different data collection strategies to make your customers feel valued. For instance:
📌 Example of questions to include:
Think of A/B testing as an experiment for your onboarding strategy. You can determine which approach resonates best with users by creating two onboarding versions (A and B).
Steps to get started:
Randomly assign users to each version and track key metrics
Metrics to monitor:
Also Read: How to Measure Customer Effort Score (CES)
ClickUp’s KPI Template gives you and your team a crystal-clear view of progress toward your OKRs by letting you track success metrics.
The best part? This template helps maintain alignment with team objectives, monitors performance over time with easy-to-read visuals, and simplifies decision-making through its comprehensive report design.
Oh, and it’s also a pro at helping you measure customer engagement and touchpoints—talk about an all-in-one solution!
Meet Leah, a project manager who has one too many tasks on her plate. Hence, her biggest challenge—staying organized, personalizing user journeys, and reducing the manual effort involved in identifying and solving issues.
However, she has found ClickUp. Let’s see how it helps her along the way.
Objective: Manage user segmentation and deliver personalized onboarding experiences.
Leah finds herself navigating through a lot of customer data, including feedback scores, product preferences, and purchase histories. Personalization is the key to managing all this data.
✅ Secret weapon: ClickUp’s Custom Fields
Set up ClickUp Custom Fields to capture customer data points like goals, company size, or purchase behavior.

For instance, Leah can create a custom field for feedback scores and use this data to send personalized recommendations. These fields ensure that each user’s onboarding journey feels personalized, not generic.
Objective: Decode engagement patterns and marketing metrics to optimize strategies.
To advance, Leah must crack the code on key metrics like engagement rates, ROI, and traffic trends.
✅ Secret Weapon: ClickUp Brain

Also Read: How ClickUp Customer Support Uses ClickUp
Objective: Visualize and share key data insights with clarity.
Leah uses ClickUp Dashboards, where raw data transforms into actionable visuals, and wins over stakeholders.
✅ Secret Weapon: Customizable Dashboards
Objective: Eliminate repetitive tasks and focus on strategy.
The automation arena tests Leah’s ability to handle inactive users, overdue tasks, and endless reminders.
✅ Secret Weapon: ClickUp Automations

Objective: Centralize data and ease processes by connecting multiple tools.
Leah’s final challenge is managing fragmented data spread across platforms. To succeed, she needs to unify her tools in one seamless system.
✅ Secret Weapon: ClickUp Integrations
Mastering user onboarding metrics means stepping into your customers’ shoes.
You need to craft an experience that resonates with your users. Let’s dive into the best practices to help you optimize onboarding and keep those metrics on the rise:
Why do your users need your product? This simple question can be the key to unlocking an exceptional onboarding experience.
How to start:
Once you deeply understand user goals, preferences, and pain points, designing an effective onboarding process becomes much easier.
Not all users are alike—some want to dive in, while others need handholding. What to do:
📌 Example: A beginner might need step-by-step guidance, while a pro user will appreciate the option to skip directly to advanced features. Customizing the experience makes onboarding more engaging and effective.
Think of an onboarding checklist as your users’ trusty GPS. It provides a structured roadmap, ensuring they know what to do and what’s next.
For example, a checklist might guide users through tasks like setting up a profile, exploring a feature, or completing their first project. These “mini milestones” boost user confidence and motivation.
Onboarding can be like leveling up in a video game, so don’t forget to add some fun to the experience!
Here are some gamification ideas:
💡 Pro Tip: A productivity app could reward users with badges for completing setup tasks or hitting specific usage goals, making the process engaging and enjoyable.
Sometimes, users prefer solving their own problems instead of reaching out for support.
Self-service options include:
📌 Example: A help center accessible via the product’s UI ensures users can find answers quickly without interrupting their workflow. Bonus: This reduces the load on your support team.
Over 90% of customers feel that the companies they buy from ‘could do better’ when it comes to onboarding new users/customers.
That’s right, your onboarding game can be a make-or-break moment for customer acquisition.
So, if you want your onboarding to be smooth and engaging and leave users with zero unanswered questions, you need to use a solution that can do everything alongside you.
ClickUp makes this effortless by offering tools like Custom Fields for personalization, Dashboards for real-time tracking, and Automations to handle repetitive tasks. This ultimately gives you a data-driven onboarding process that works like a charm.
Ready to transform your onboarding process into a retention machine? Sign up on ClickUp today and watch your business soar!

© 2026 ClickUp

There’s an easier way. Try a free AI Agent in ClickUp that actually does the work for you—set up in minutes, save hours every week.