


Still downloading templates?
There’s an easier way. Try a free AI Agent in ClickUp that actually does the work for you—set up in minutes, save hours every week.
Sorry, there were no results found for “”
Sorry, there were no results found for “”
Sorry, there were no results found for “”
You and your team are working steadily on an important deliverable. You’re completely immersed in the details only to be suddenly reminded that you must provide a progress report to your stakeholders. Instead of smoothly transitioning from work to reporting, you scramble through spreadsheets, emails, and tools to create an acceptable progress report.
Sounds stressful?
it shouldn’t be. Though we’ve all experienced the stress of preparing progress reports, we know they’re essential for tracking activities, accomplishments, challenges, and potential delays. And with the right project management tool in place, creating an updated progress report becomes a breeze.
In this guide, we’ll cover everything you need to know about writing progress reports, including their key components and the best practices.
A progress report is a comprehensive document providing a snapshot of a project’s current status at a specific time. It typically covers project milestones, accomplishments, challenges encountered, and plans.
This report keeps stakeholders aligned on project progress, facilitating necessary changes and strategic decisions to stay on track.
Progress reports are important as they keep everyone updated and accountable. They keep stakeholders informed about what’s happening in the project and what may get delayed. This reduces the chances of miscommunication or last-minute hiccups in project completion.
But what makes progress reports important are the more profound questions they answer, such as:
Four common types of progress reports can exist depending on the frequency of the project progress reports, the requirements, complexity, and stakeholder needs.
These are daily progress reports that capture daily actions like tasks completed, planned tasks for the next day, urgent items, or any roadblocks or delays you may have encountered.
The daily progress report is ideal for a daily standup meeting with your team members or for scrum project progress, which requires day-to-day insights to help plan dependent tasks and overall project progress.
A weekly progress report is one of the most common reporting types, where each team member or project owner provides weekly insights into:
A monthly progress report provides a broader perspective on a project’s progress, particularly about the long-term horizon of the project. This can include:
A monthly report is crucial for senior management and external stakeholders, who need a high-level overview of the project timelines and want these updates to stay informed and make strategic decisions wherever necessary.
Quarterly status reports capture the progress of a project over three months. This is ideal for high-level decision-making and is often required by stakeholders and leadership teams to understand the project progress within the context of the entire project lifecycle for future planning. This report typically includes insightful information like:
💡 Pro Tip: Keep your audience in mind
Tailor your report to the audience. Senior management may want a high-level overview, while team members might need more detailed task-level information. Always consider who will be reading the report and adjust the content accordingly.
While progress reports and status reports are often used interchangeably, there are some key differences:
Depending on the scope and frequency of your project, there are several insights that you need to include as part of the project status report. In general, creating progress reports is about capturing all the crucial information, such as:
At the beginning of any progress report, you must briefly overview the overall project details. This section typically includes:
Next, provide the project’s important metrics and quantifiable details. These include completed tasks, hours logged, budget status, or milestones reached, giving stakeholders a clear picture of the project’s current status.
🎯 Example: When discussing progress, include specific numbers: ‘This week, the team completed 80% of the tasks scheduled for Sprint 3, leaving only two minor features remaining.’ This gives a clear snapshot of progress.
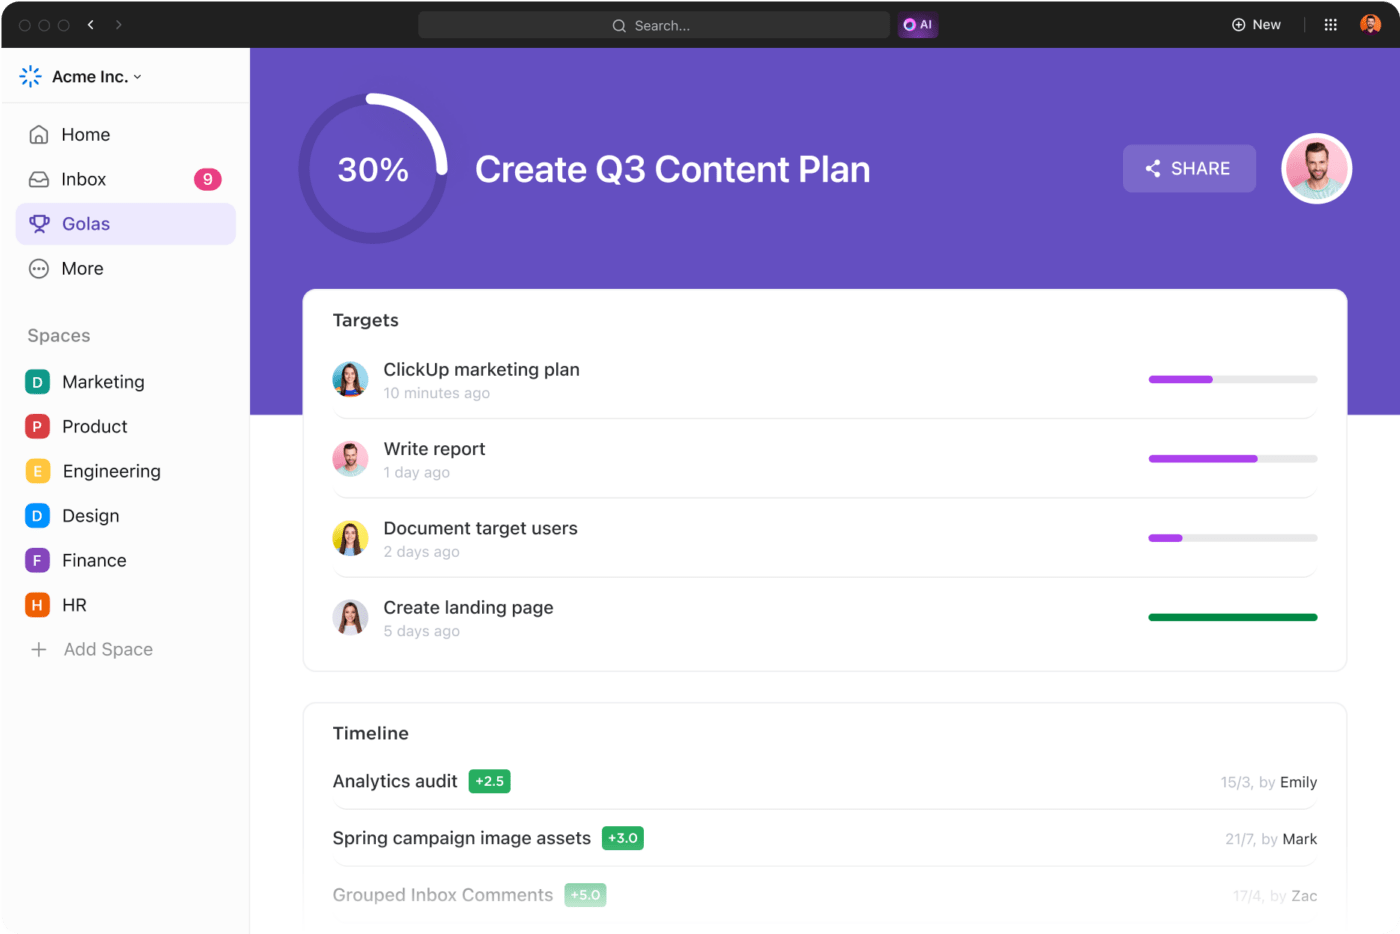
If you have trouble keeping track of your tasks and activities, use a project management tool like ClickUp. The tool allows you to visualize data about your project’s overall progress, tasks and deadlines, and team members involved.
With ClickUp Dashboards, you can customize the data you want to report and get a clear glimpse of all your KPIs and important actions. This allows you to streamline the reporting process and ensure that the updates in your progress report are accurate and up-to-date.
While milestones and activities completed are essential, most executives and stakeholders are interested in the challenges and roadblocks encountered. A good progress report highlights these delays or roadblocks, including information about the following:
🎯 Example: If there’s a delay due to a supplier issue, outline the challenge and describe the steps taken to resolve it, such as ‘Switching to a backup supplier to avoid further delays in production.’ This reassures stakeholders that problems are being managed.
The goal here is transparency—sharing roadblocks helps stakeholders understand what might be slowing down progress and allows them to provide support or suggestions to resolve these issues. They can even help you with project focus areas so you can manage your resources and focus on completing these critical activities for a higher chance of project success.
Along with challenges, it’s equally important to highlight wins, which usually involve:
🎯 Example: If a team reduced development time by 15% by adopting new processes, include this win in your report: ‘Implementing agile sprint planning helped us cut 15% off the original development timeline for feature XYZ.’
To gather this data, you can use ClickUp Milestones, a smart feature that allows you to understand your progress quickly in a given period. With a Gantt view, Board view, or a number of other visualizations, you can summarize your project milestones and provide a realistic report that captures your project’s success stories.
Lastly, it’s always helpful to gather feedback from your teams and capture suggestions to be shared with the stakeholders and leadership. These recommendations can include:
🎯 Example: For a product launch, the next steps could be:
This roadmap outlines tasks, deadlines, and team responsibilities, ensuring clarity and keeping the project on track.
To create the final report, collate all your project data and format it according to the stakeholders’ requirements. Here is the exact process for crafting a detailed and concise progress report.
Before writing a progress report, establish clear goals for what you aim to track and how frequently you’ll report. Defining these upfront ensures that your reports stay focused and relevant. Consider the following when setting goals:
You can use agile estimation techniques to create draft timelines for your project and use input from your teams and previous projects to determine whether these timelines are realistic.
Once the goals are set, you can input them into ClickUp Goals, allowing you to track progress toward specific objectives. This tool lets you break down big goals into smaller, actionable targets, helping you stay on top of what needs to be included in your progress reports.
A well-rounded progress report includes input from your team members. They may have keen insights on challenges and roadblocks that you could have overlooked and can suggest improvements or solutions.
Involving team members from diverse roles ensures that you consider multiple perspectives and create a more complete picture of the project’s status. For example, developers can spot technical hurdles that marketing might miss while customer-facing teams provide insights into client feedback that affects future strategies.
This cross-functional input not only helps identify issues but also uncovers opportunities for innovation. Plus, when team members see their contributions in the report, it boosts morale and fosters engagement, making them feel valued and invested in the project’s success.
With this process, you can provide a well-rounded report that reflects the project’s reality, helping stakeholders gain in-depth insights.
🎯 Example: Each team member can provide valuable insights for your progress report:
By gathering these unique contributions, your report captures a comprehensive view of the project, helping stakeholders understand achievements and challenges.
To create an effective progress report, gather all relevant data, including analytics, performance metrics, and feedback. This step involves tracking progress toward goals, reviewing task completion, and identifying any deviations from the plan.
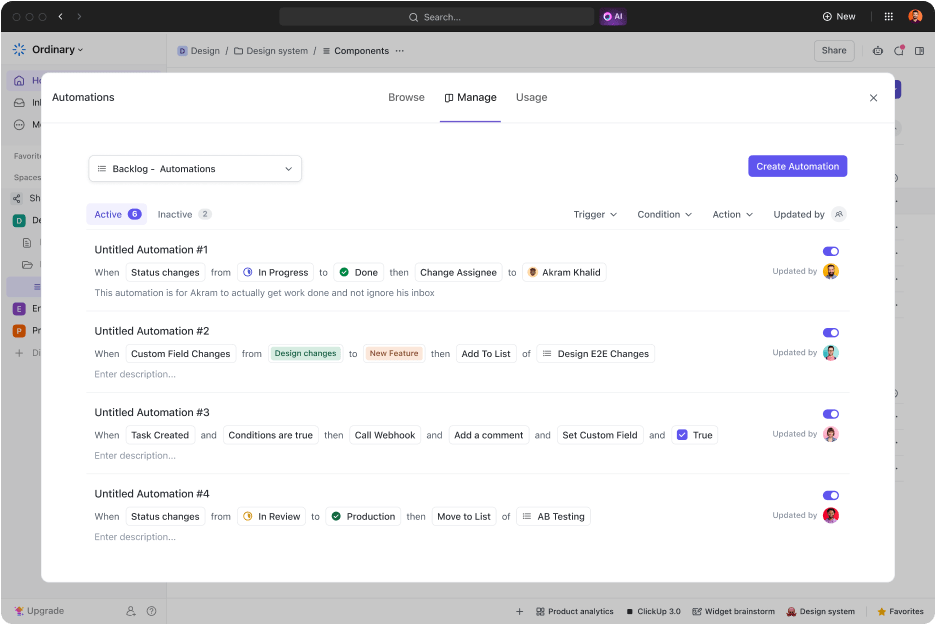
If you spend a lot of time gathering this data from multiple tools and teams, you can set trigger-led automation or automate routine workflows using ClickUp Automation. This lets you automatically pick data from various tasks, reports, and project pipelines and present it in the expected format.
Once you’ve gathered all the necessary data, write the report. The progress report should include critical information such as:

The ClickUp Docs feature is perfect for drafting reports. It lets you structure your content efficiently and collaborate with your team in real time.
Using this tool, you can create beautiful documents, wikis, and more, including details like graphs, visualizations, tables, and links to obtain additional information on a particular activity.
💡 Pro Tip: Add a “lessons learned” section to your progress report for continuous improvement. This helps teams avoid repeating mistakes and fosters a culture of growth and continuous improvement within the project.
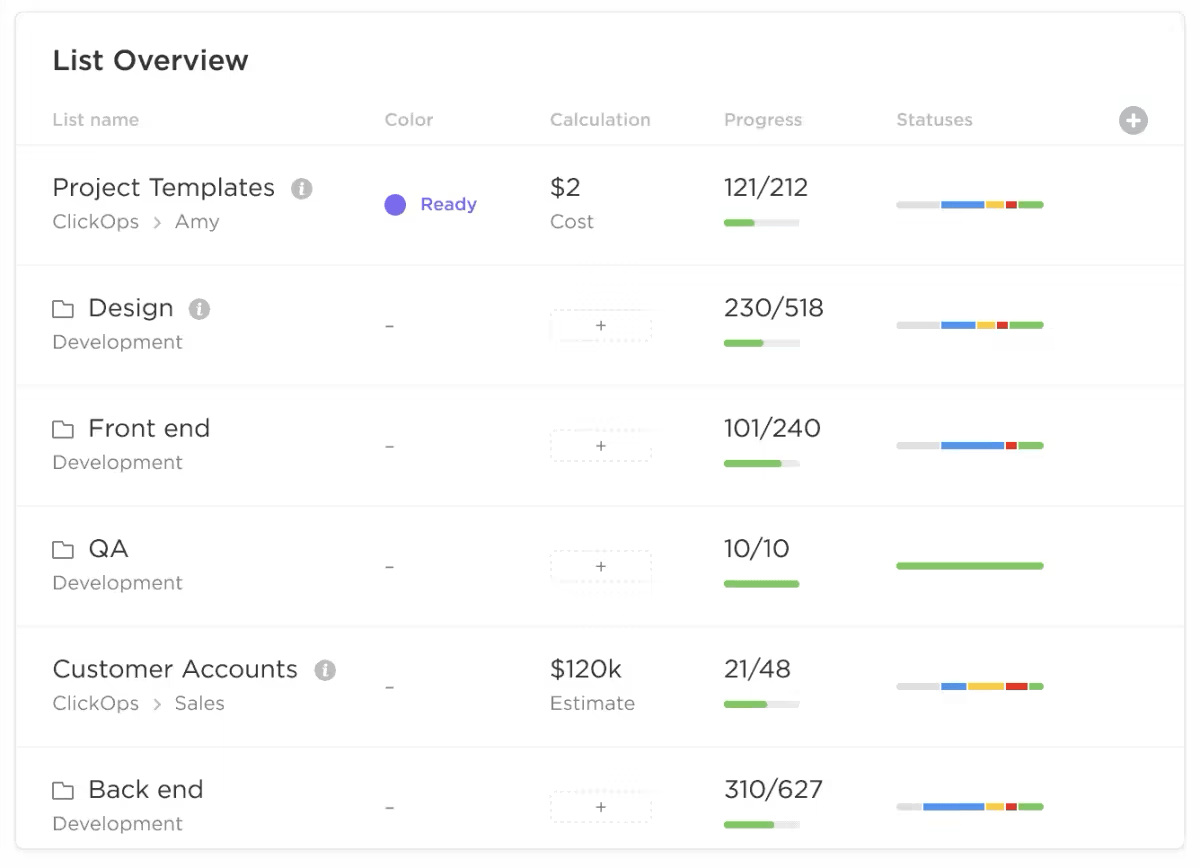
Let’s be honest—nobody enjoys reading walls of text or endless columns of numbers in a progress report. That’s where dashboards come in. They turn data into easy-to-digest, visually appealing reports that instantly show where your project stands.
Using tools like ClickUp Dashboards, you can create visual snapshots of:
Dashboards aren’t a game-changer. They give stakeholders an instant, high-level overview without sifting through paragraphs of updates. Plus, they make your reports more engaging and easy to absorb and interpret at a glance.
🎯 Example: Instead of listing budget figures, present a bar chart showing the initial budget versus actual spending. This provides a quick visual cue for financial health, helping stakeholders absorb information faster.
Once your progress report is ready, it is time to share it with the right stakeholders. Whether it’s internal team members, clients, or executives, sharing progress reports helps keep everyone informed and engaged with the project.

With ClickUp Project Management, you can speed up your report creation and sharing process using the all-in-one knowledge management and job-tracking software, resulting in faster, smarter reporting.
Because reports in ClickUp are built using up-to-date information from your project management tool, you can rest assured that they’re accurate. Reports generated from ClickUp provide real-time visibility into the project challenges, including the risks, resource challenges, or other roadblocks. This allows you to document all your project details without requiring you to spend too much time collecting this data from multiple sources.
💡 Pro Tip: Use the “3-sentence rule” for key updates. For each major update, summarize the key in three sentences: What happened, why it matters, and what’s next. This keeps the report concise and easy to skim while delivering essential information.
The power of ClickUp lies in its ease of use and ability to provide all the crucial metrics and visualizations you need for your progress reporting process. It also has several ready-to-use customizable progress report templates to help standardize your reporting process and boost efficiency.
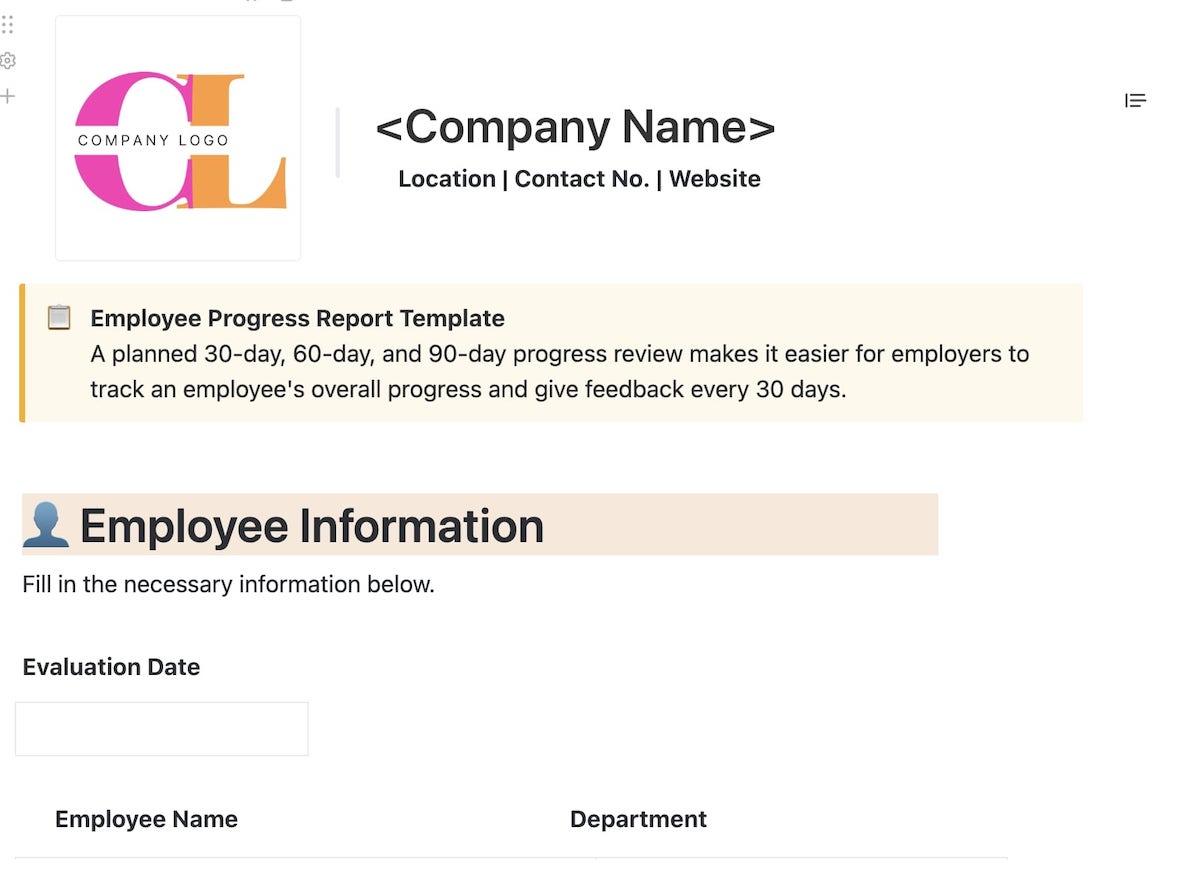
For a detailed progress report on your entire project or deliverable with insights like resources used, upcoming deadlines, and other key metrics, you can use the ClickUp Progress Report Template. This template will help you get a structured framework to write progress reports, including information like:
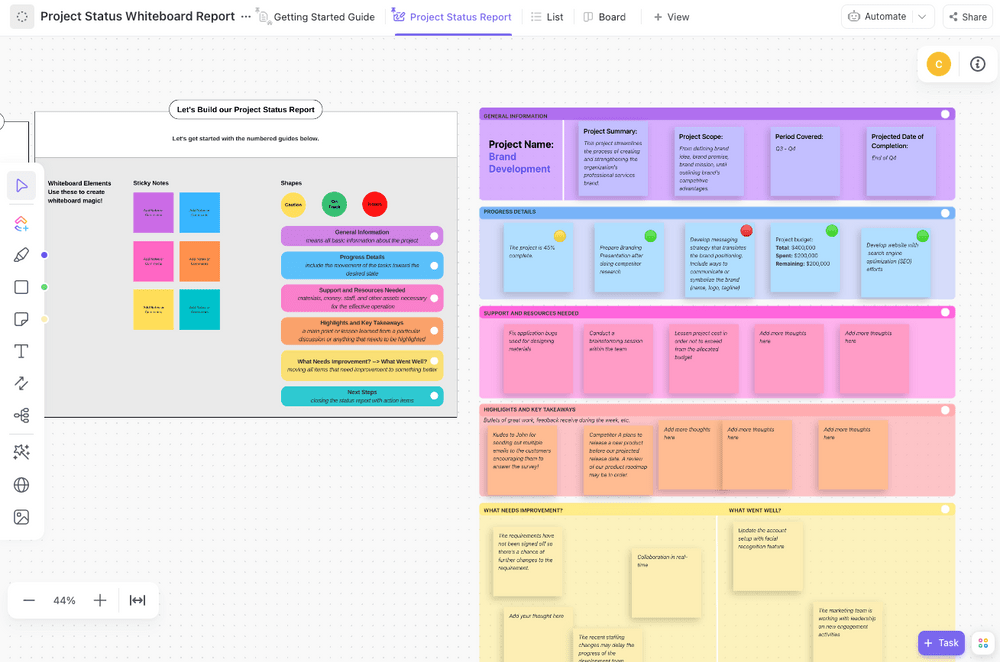
Meanwhile, if you need to provide a quick status update to your stakeholders and team members, you can quickly get this done using the ClickUp Project Status Report Template. This template helps you pick all the information about your project, including the development made, activities in the pipeline, the ownership for each task, and the status of each activity. This makes it easy for you to:
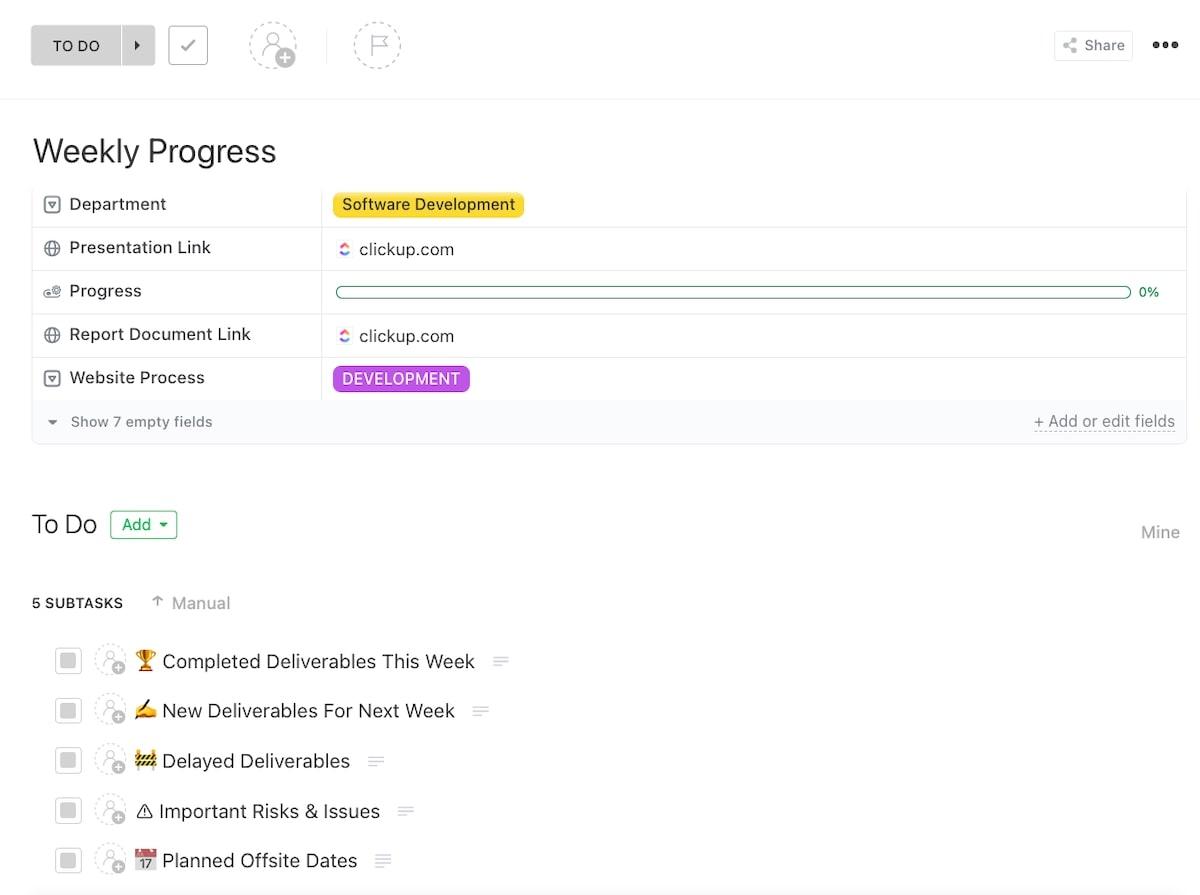
Also, if you provide a weekly progress report in your organization, the ClickUp Weekly Progress Template can be your go-to guide. Like the previous reports, this customizable weekly report allows you to quickly capture detailed information about your current project from different teams and tools, allowing you to:
While various project update templates can help you provide comprehensive information to your stakeholders, ensuring that your reports are logical, clear, and concise for quick consumption is always a good practice.
To make your progress reports as effective as possible, follow these best practices:
💡 Pro Tip: Determine a regular reporting schedule (weekly, bi-weekly, or monthly) for progress reports. This will keep everyone informed on a routine basis and ensure accountability without last-minute rushes.
Effective progress reports are crucial for project success. The more detailed and well-structured your progress report is, the easier it is to gain the trust of your stakeholders and avoid communication gaps.
As a project manager, leverage ClickUp to track progress easily, ensure transparency, and foster stakeholder trust. Create detailed reports with key metrics, challenges, and actionable recommendations in an aesthetically-pleasing format.
Sign up for ClickUp today to streamline your reporting process and drive project success.

© 2026 ClickUp

There’s an easier way. Try a free AI Agent in ClickUp that actually does the work for you—set up in minutes, save hours every week.