


Still downloading templates?
There’s an easier way. Try a free AI Agent in ClickUp that actually does the work for you—set up in minutes, save hours every week.
Sorry, there were no results found for “”
Sorry, there were no results found for “”
Sorry, there were no results found for “”

Every successful project is built on a sequence.
And in the world of project management, that sequence is rarely straightforward. Dependencies multiply, schedules tighten, and even the smallest delay can ripple through an entire project plan.
That’s where you’d need the precedence diagram method. It helps project managers visualize task sequences and dependencies, discover critical paths, and optimize schedules, keeping real-world constraints in mind.
With precedence diagram templates, task relationships can be easily converted into clear, actionable workflows.
Let’s find out more about these templates and see how you can integrate them into your project management.
Each of the templates we have covered in this blog is designed for a specific purpose. However, the core focus of each remains on scheduling and visualization.
Here’s a quick comparison for you before we discuss them in detail.
| Template name | Download template | Ideal for | Best features |
| ClickUp Data Flow Diagram Template | Get free template | Data analysts, project managers, and system architects | ClickUp Whiteboard space to create data flow diagrams with fully editable elements: connectors, blocks, etc. |
| ClickUp Swimlane Flowchart Template | Get free template | Project managers, process owners, and department leads | Preset legends for easy drag and drop swimlane diagram creation |
| ClickUp Process Flow Chart Template | Get free template | Project managers, HR teams, and operations leads | Task relationship mapping via a flowchart on a whiteboard |
| ClickUp Project Charter Template | Get free template | Project managers, team leads, and PMOs | Project overview, deliverables, risk and issues, and sign off |
| ClickUp UML Diagram Template | Get free template | Developers, system designers, and project managers | Whiteboard tools, annotation features |
| ClickUp Kanban Board Template | Get free template | Agile teams and operations leads | Pre-made boards organized by the status and priority of each task |
| ClickUp Simple Gantt Chart Template | Get free template | Project managers and coordinators | Project schedule, Gantt Chart view to track progress |
| ClickUp Project Schedule Template | Get free template | PMOs, program managers, and operations heads | Project summary, phases, and Timeline view for project schedule monitoring |
| ClickUp Project Timeline Whiteboard Template | Get free template | Project managers, marketing teams, and cross-functional leads | ClickUp Automation features to add project steps as sticky notes on whiteboards and convert them into ClickUp Tasks |
| ClickUp Dependency Mapping Template | Get free template | Project managers, PMOs, and operations teams | Dependencies overview, with logical grouping into in-control vs. out of control |
| ClickUp Project Management Template | Get free template | Project managers, department heads, and client-facing teams | Gantt chart, capacity planning, lists, calendar, and team performance |
| Miro Precedence Diagram Template | Download template | Project managers, PMOs, and operations leads | Whiteboard diagramming based on tasks |
| Excel Precedence Diagram Template | Download template | Team leaders, project managers, and planners | Data fields, shapes to determine the Critical Path |
| Creately Precedence Diagram Template | Download template | Project managers and planners | Whiteboard tools, sticky notes, and the option to upload media |
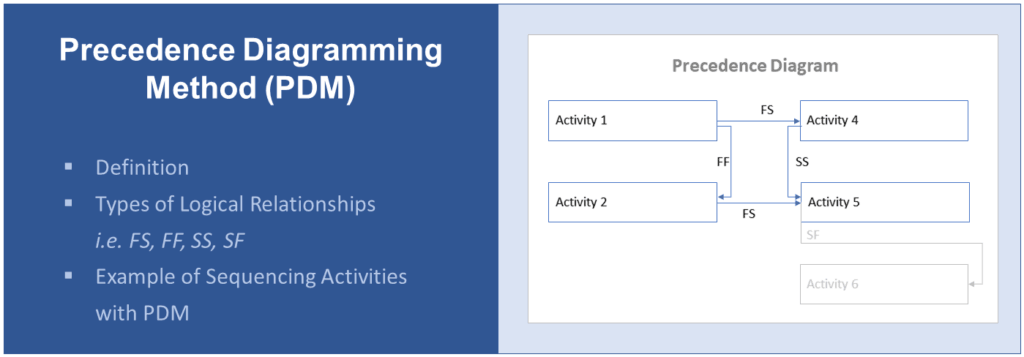
The Precedence Diagramming Method (PDM) is a visual project management technique that you’d use to plan how individual project activities connect and depend on each other.
Visually mapping task dependencies lets teams identify key tasks, anticipate potential delays, and adjust resources to maintain an accurate project schedule.
A precedence diagram typically represents activities as nodes connected by arrows that define the sequence of tasks. These links are defined using relationships such as Finish-to-Start (FS), Start-to-Start (SS), Finish-to-Finish (FF), and Start-to-Finish (SF).
A strong precedence diagram template goes beyond mapping task dependencies to show how work actually flows.
Here is what an ideal template does:
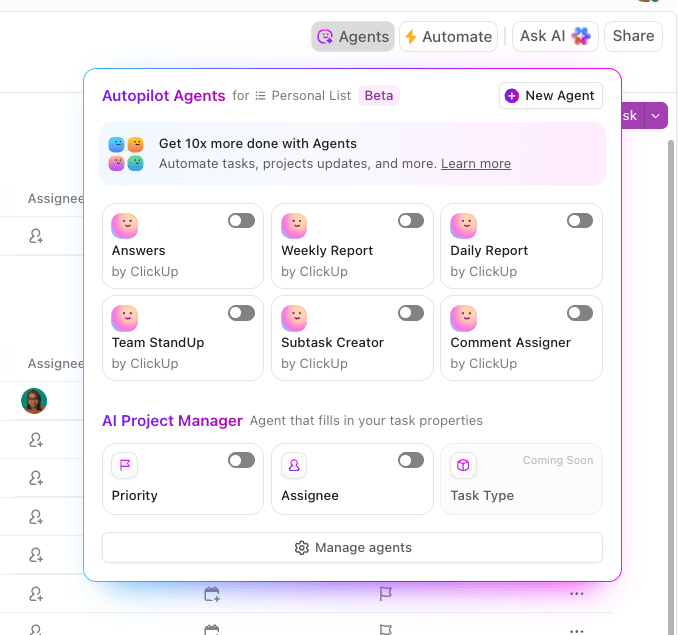
📮 ClickUp Insight: According to our survey, nearly 88% of leaders still rely on manual check-ins, dashboards, or meetings to get updates.
The cost? Lost time, context-switching, and often, outdated information. The more energy you spend chasing updates, the less you have for acting on them.
ClickUp’s Autopilot Agents, available in Lists and Chats, surface status changes and critical discussion threads instantly. Here’s to never having to ask your team to send “quick updates”. 👀
💫 Real Results: Pigment improved team communication efficiency by 20% with ClickUp—keeping teams better connected and aligned.
📚 Read More: Best Flowchart Software
Depending on the teams involved and the nature of the project, you can use one or more of these precedence diagram templates to drive visibility and accuracy in project management.
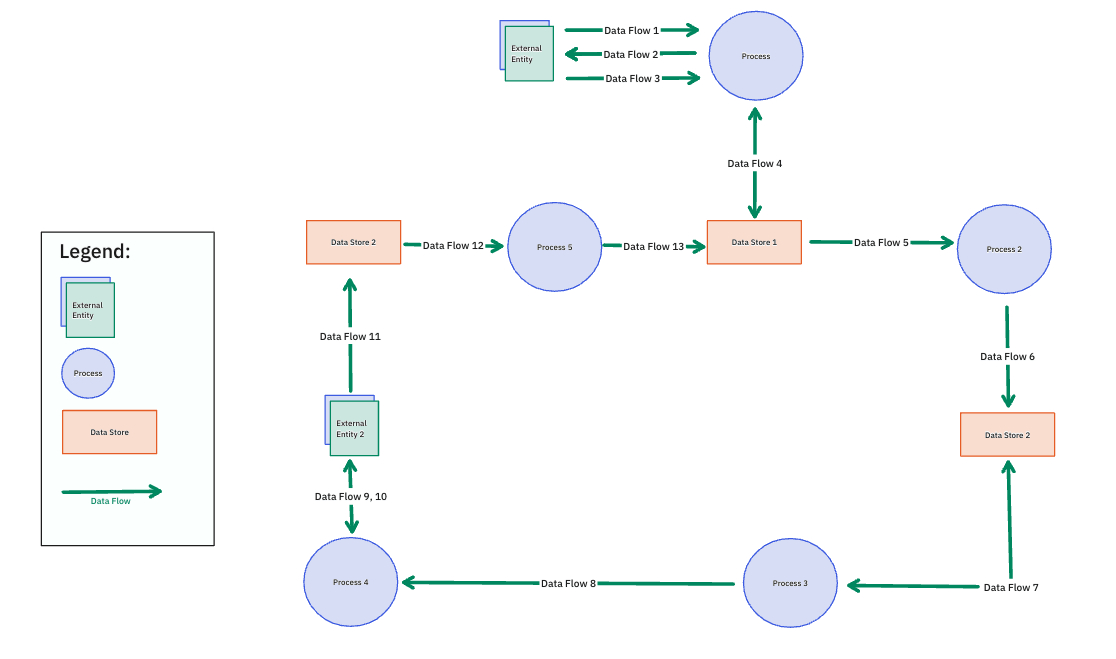
Get the precision of a systems engineer and the clarity of a visual planner with the ClickUp Data Flow Diagram Template. It helps bring structure and logic to complex systems, letting you turn abstract data relationships into clear, traceable visuals.
The editable connectors and labels show exactly how data flows between entities such as customers, managers, and other stakeholders. This way, it gets easy to spot redundancies or missing links.
Why you’ll love this template:
✅ Ideal for: Data analysts, project managers, and system architects mapping complex systems and fixing data flow bottlenecks across teams.
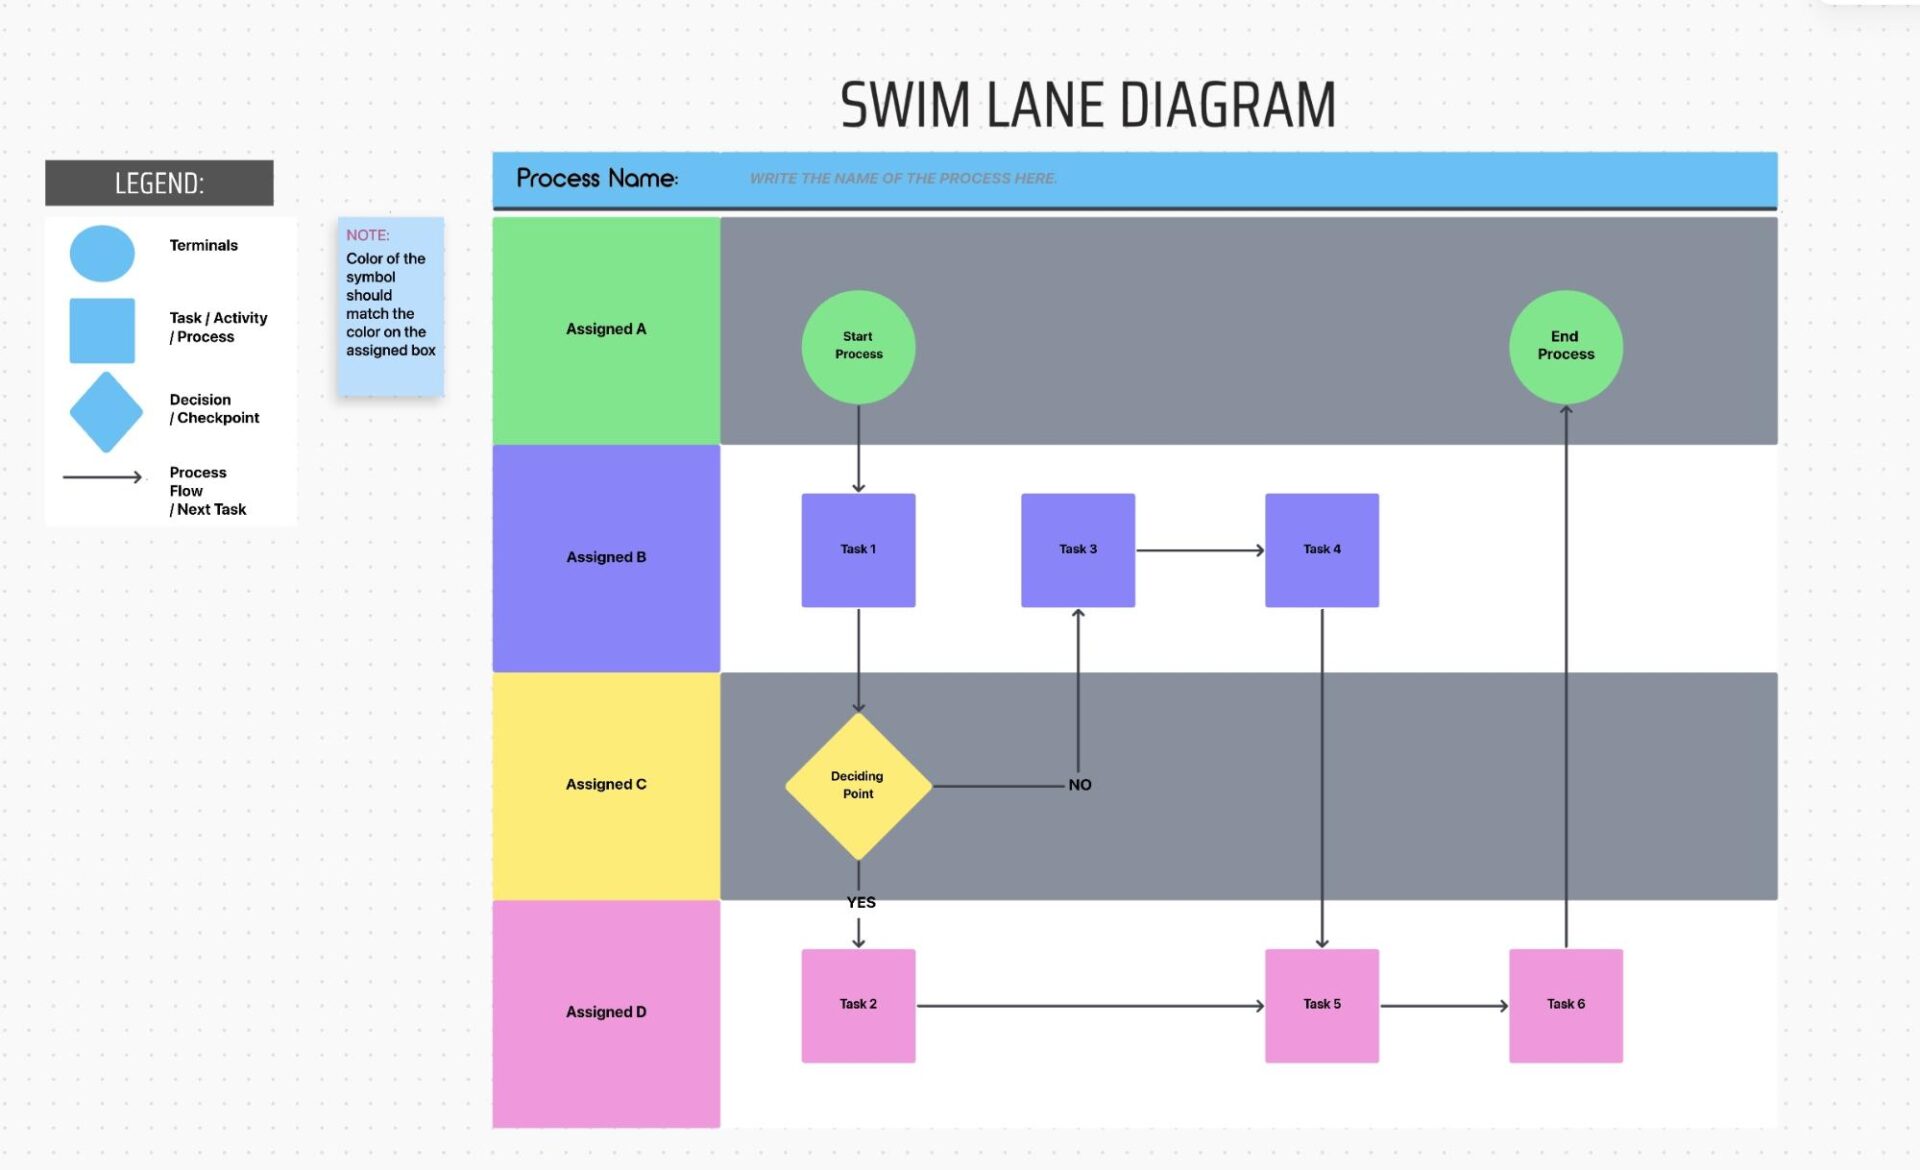
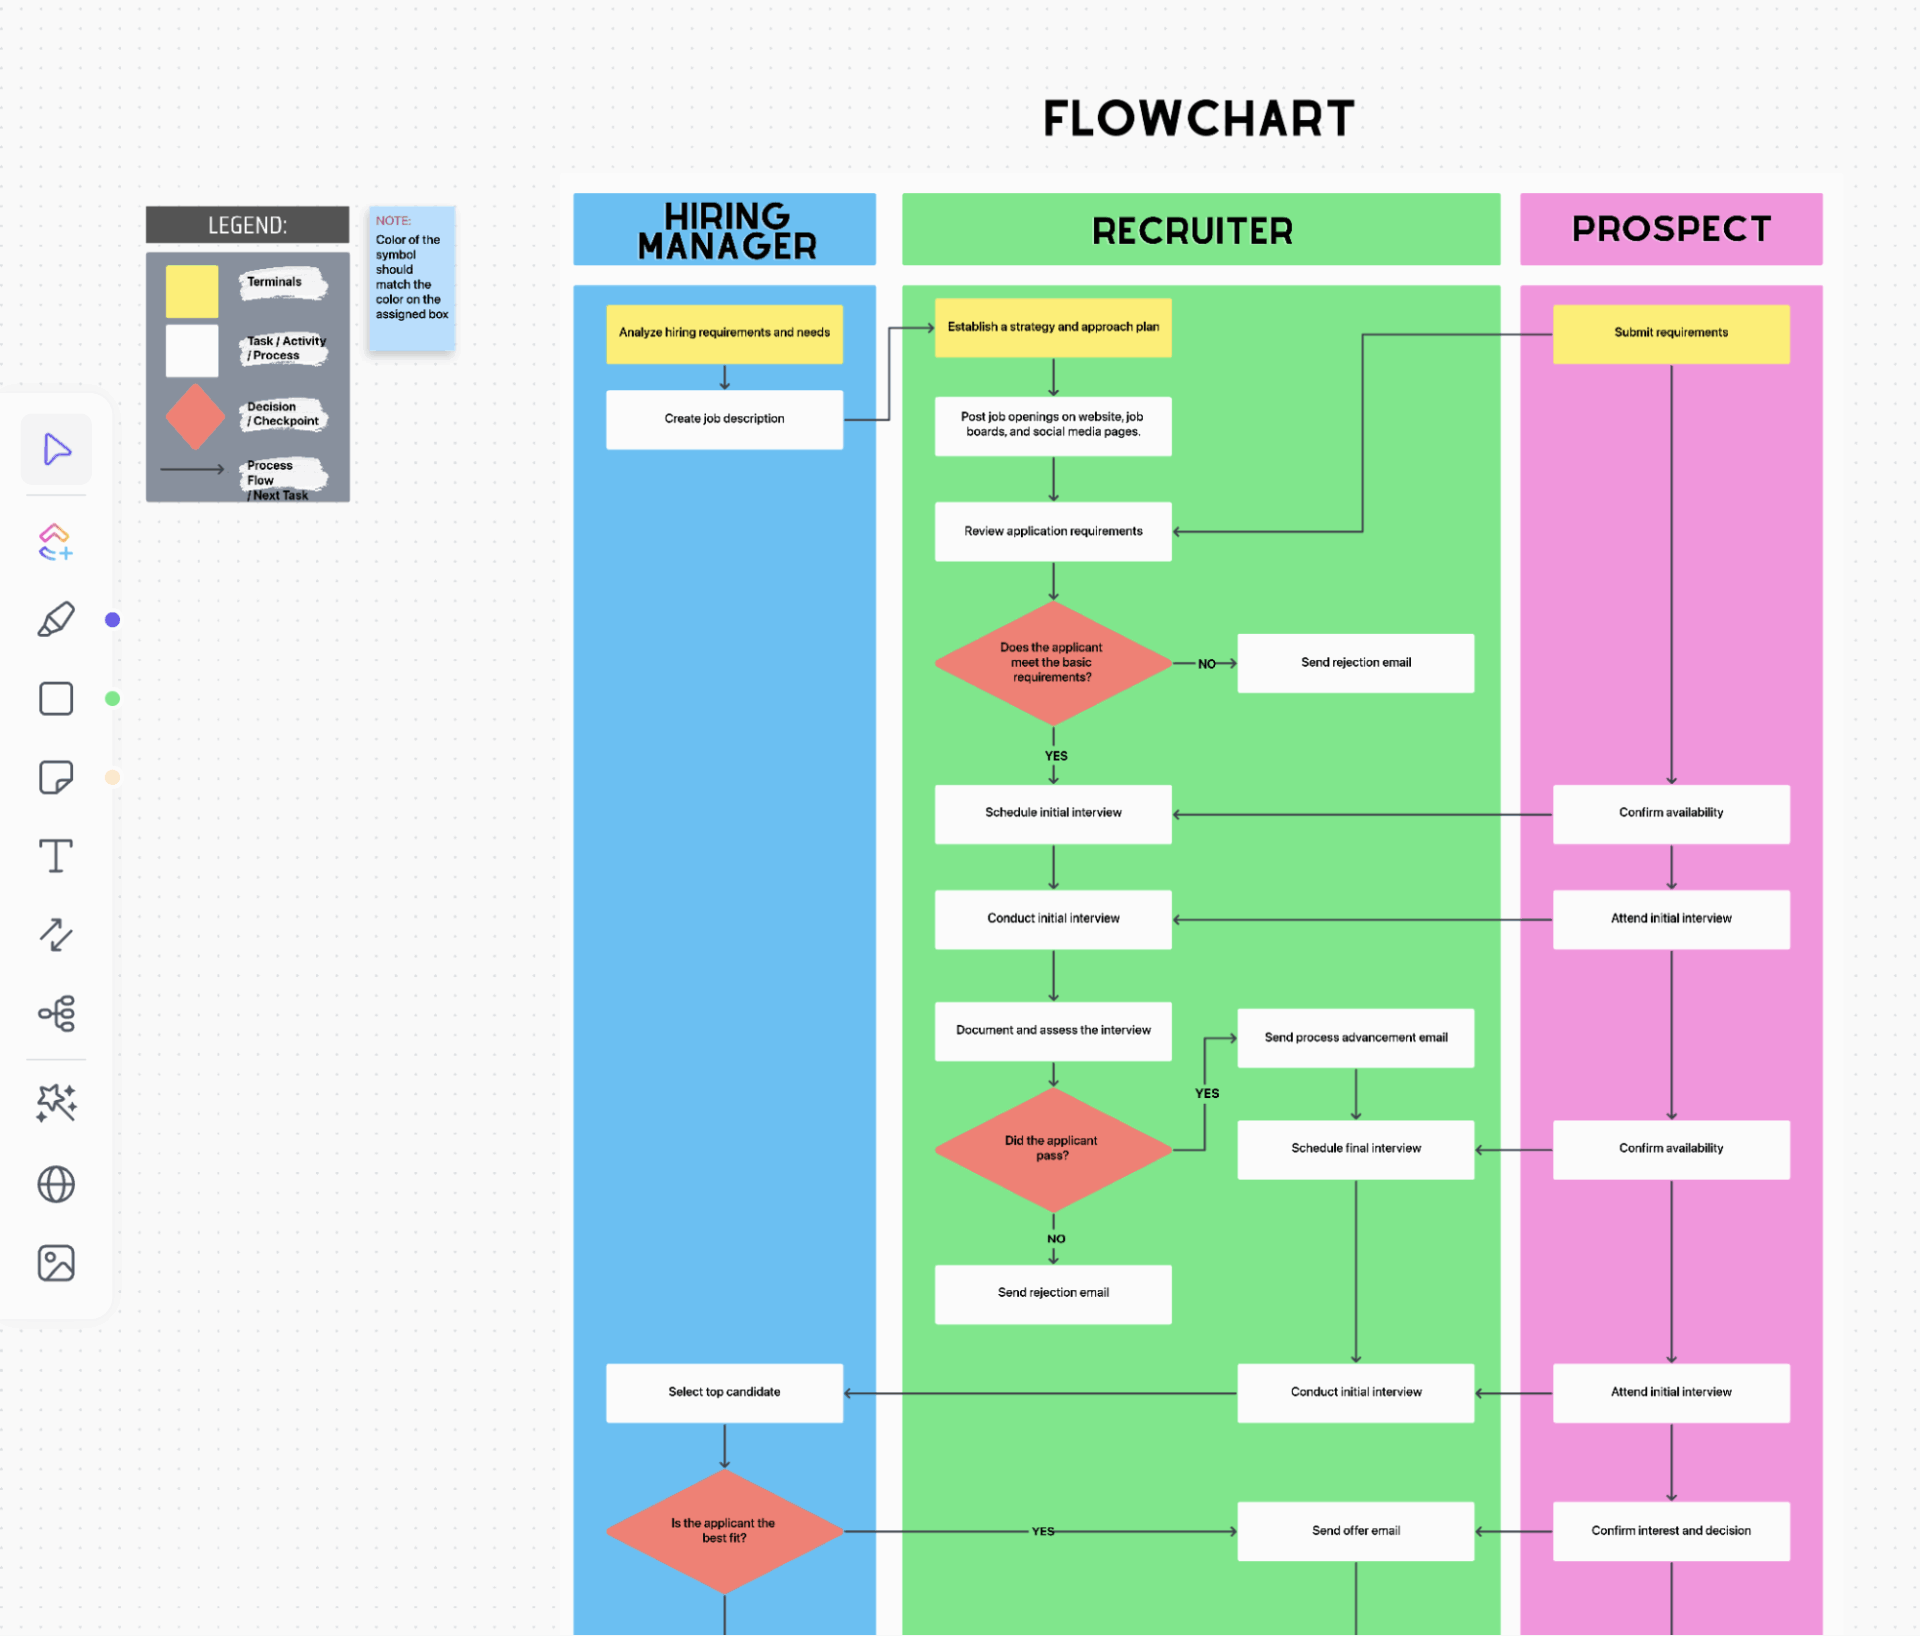
Bring accountability and clarity to every workflow with the ClickUp Swimlane Flowchart Template. It’s a visually powerful way for teams to see who owns what instantly.
Choose from nine different flowchart templates or start from scratch to organize complex processes into clean, color-coded lanes.
Each connecting line may represent a person, team, or department. The process blocks and decision points can be used to map how work moves between them. You can drag and drop shapes, edit task labels, or recolor elements to reflect real-time assignments.
Why you’ll love this template:
✅ Ideal for: Data analysts, project managers, and system architects mapping complex systems and fixing data flow bottlenecks across teams.
Map process steps, assign responsibilities, collaborate in real-time, and drive project execution without switching tools using the ClickUp Process Flow Chart Template.
With a clear visual of every step in a workflow, your team can stay in the know at any point in the process. Each chart can be divided into Process Players (your people or departments) and Process Activities (their specific actions), creating instant clarity around who does what.
It also acts as an interactive digital whiteboard that lets you drag and drop parts of the chart, such as shapes, label process owners, and connect each action with directional flow lines. You can also view tasks in ClickUp’s List or Board View for progress tracking.
Why you’ll love this template:
✅ Ideal for: Project managers, HR teams, and operations leads who want to visualize and execute business processes from start to finish.
💡 Pro Tip: Traditional flowcharts get outdated quickly. AI updates them automatically when tasks, systems, or rules change—keeping your process documentation always current.
Here’s a video that shows you how to use AI in process mapping ⬇️
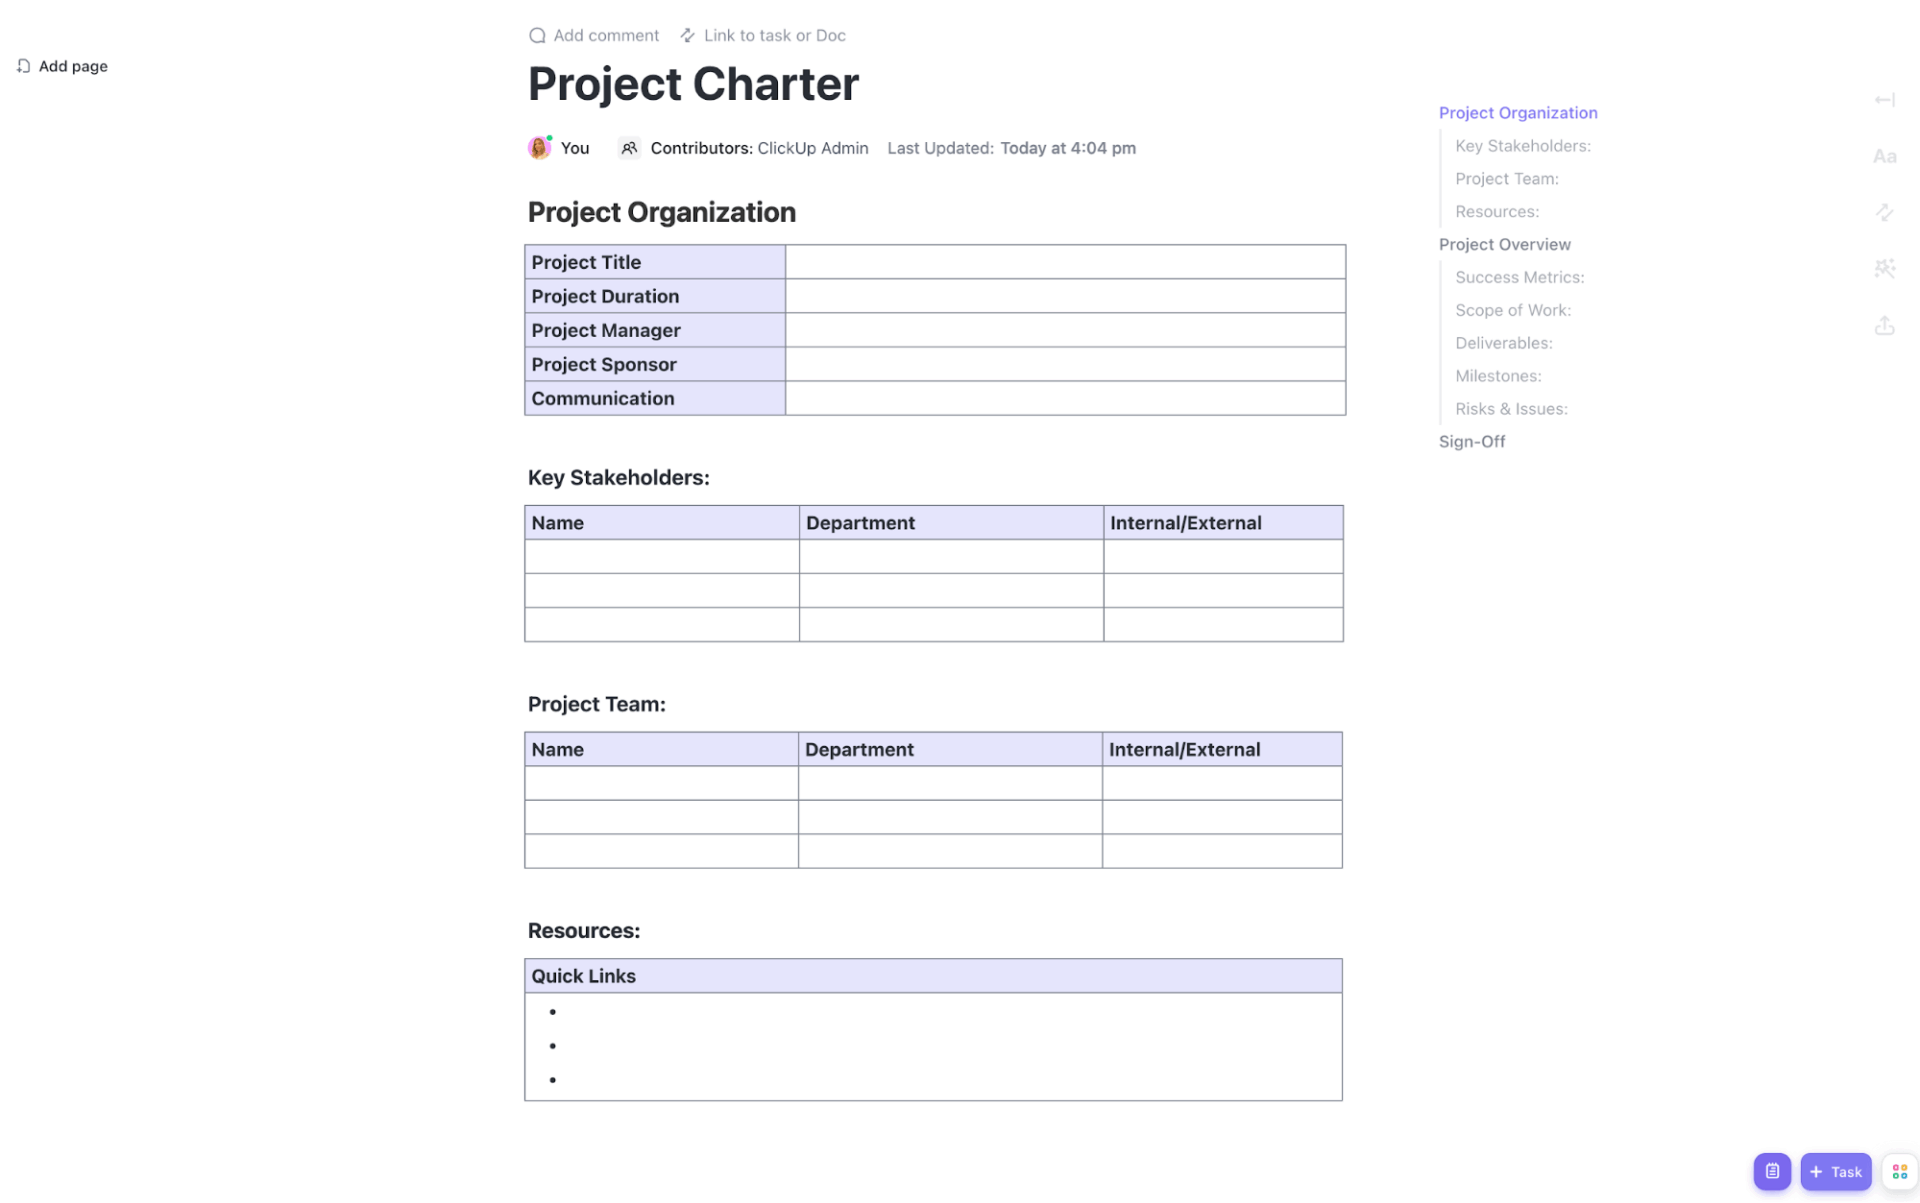
Give your projects structure and your stakeholders clarity with the ClickUp Project Charter Template. This is your one-page blueprint, which can capture your project’s purpose, scope, deliverables, and key roles. Also, it is ready to share or update at any stage of execution.
Each section, from Project Overview to Risks & Issues, comes preformatted for instant use, with space to add key details like deliverables, milestones, timeline, budget, resources, success metrics, etc.
Why you’ll love this template:
✅ Ideal for: Project managers, team leads, and PMOs setting up projects for success with a clear charter and seamless collaboration.
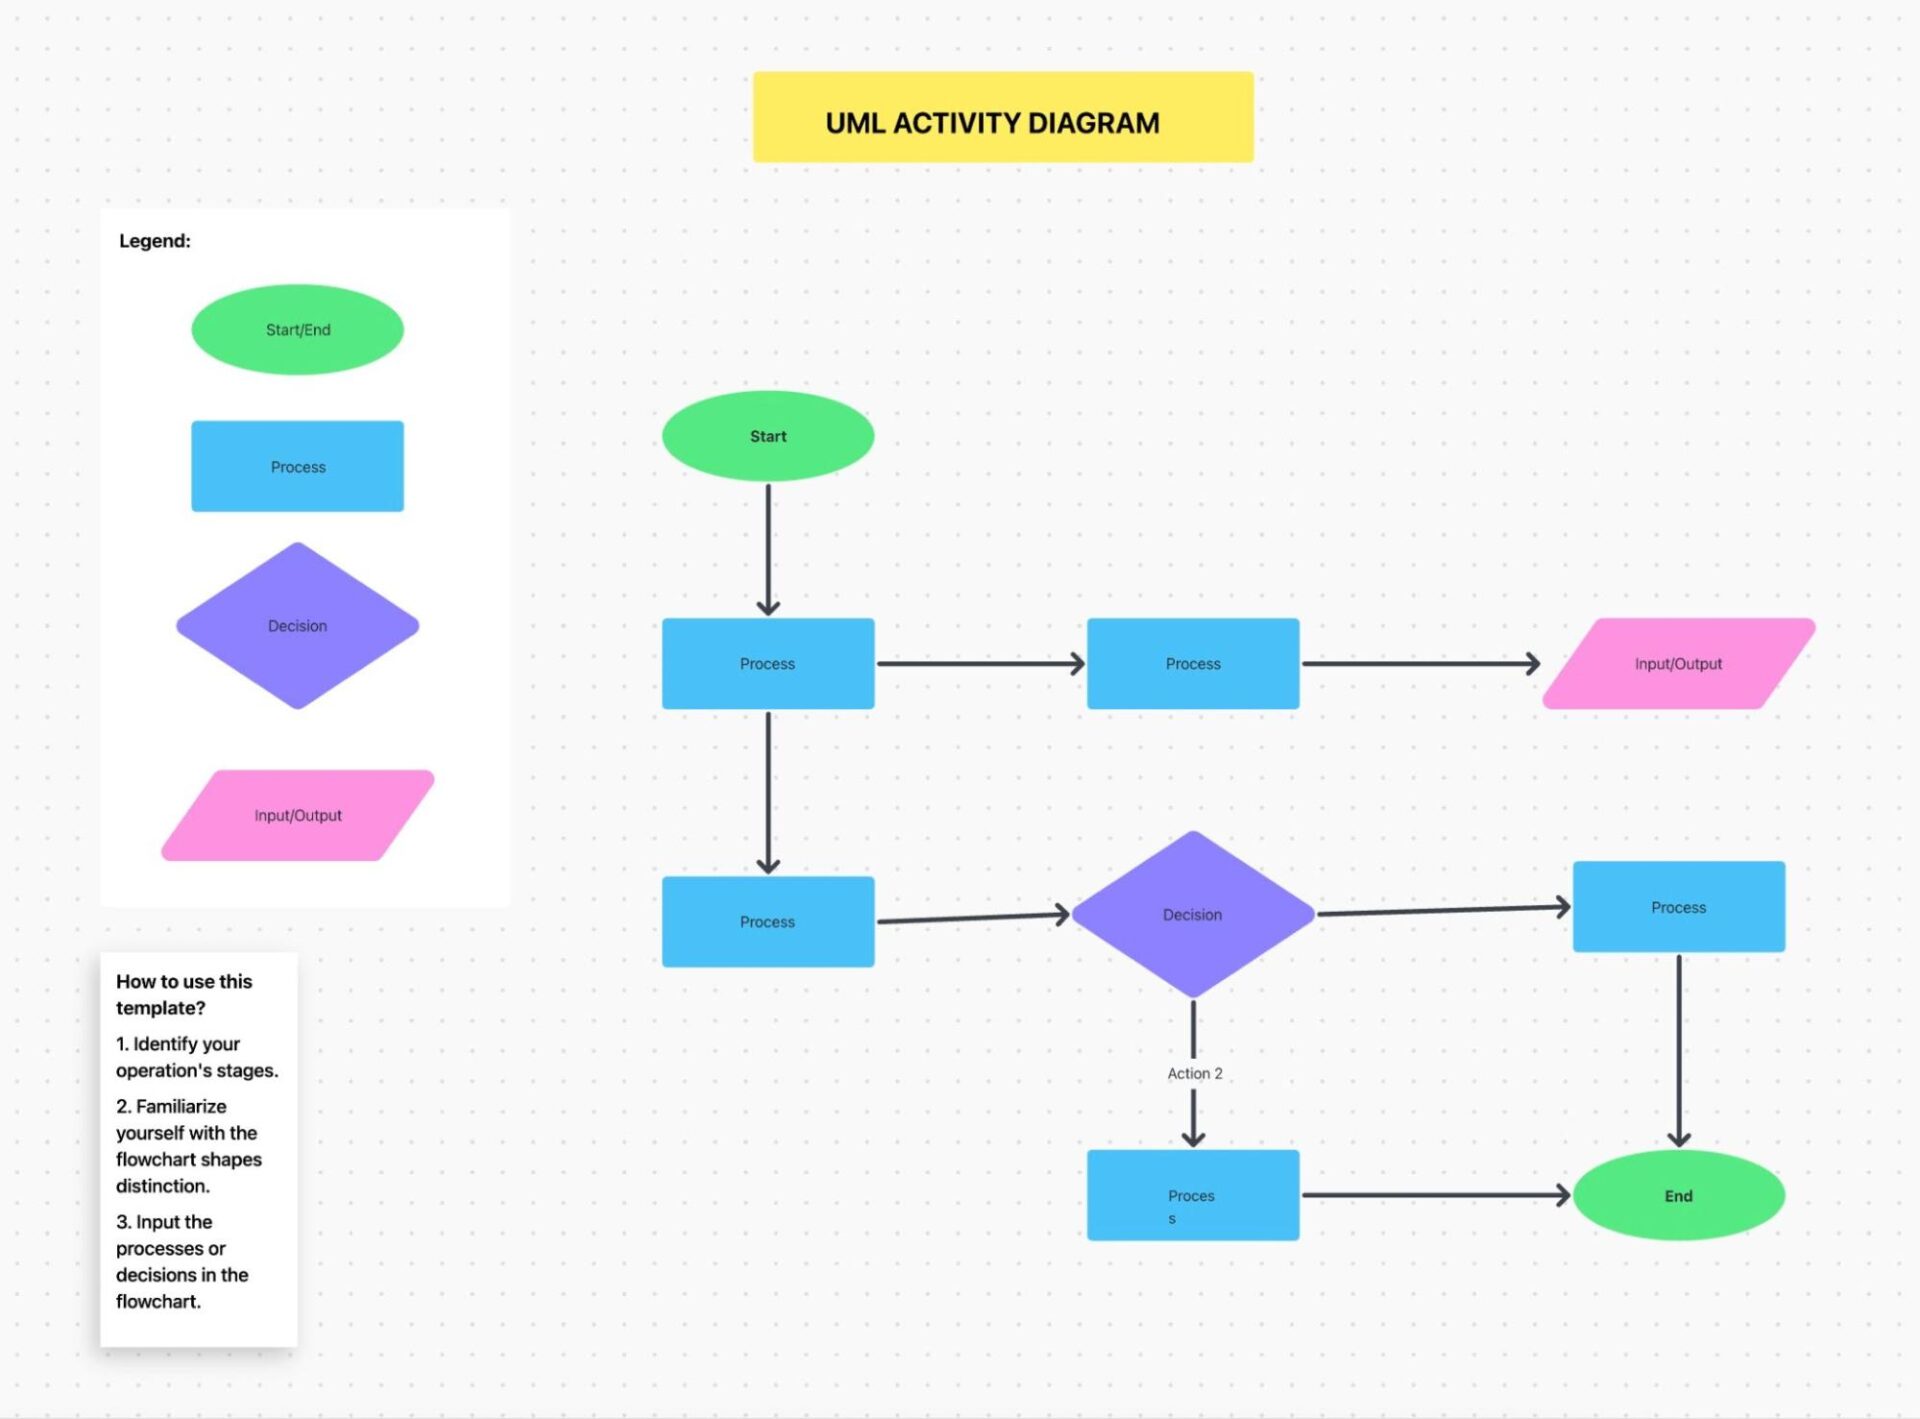
When ideas get tangled between disconnected systems and tools, the ClickUp UML Diagram Template helps bring clarity.
With a UML (Unified Modeling Language), you can sketch how processes connect, see dependencies at a glance, and turn complex processes into simple diagrams everyone can follow.
Start by creating a simple outline of the process you want to model. Then use activity blocks to represent tasks and actions and sequence them in the order they typically occur. You can use arrows to represent this sequence or data flow, and add branching for alternative/parallel paths, yes/no decisions, and error handling.
Why you’ll love this template:
✅ Ideal for: Developers, system designers, and project managers looking to drive clear visual plans for teams to act on.
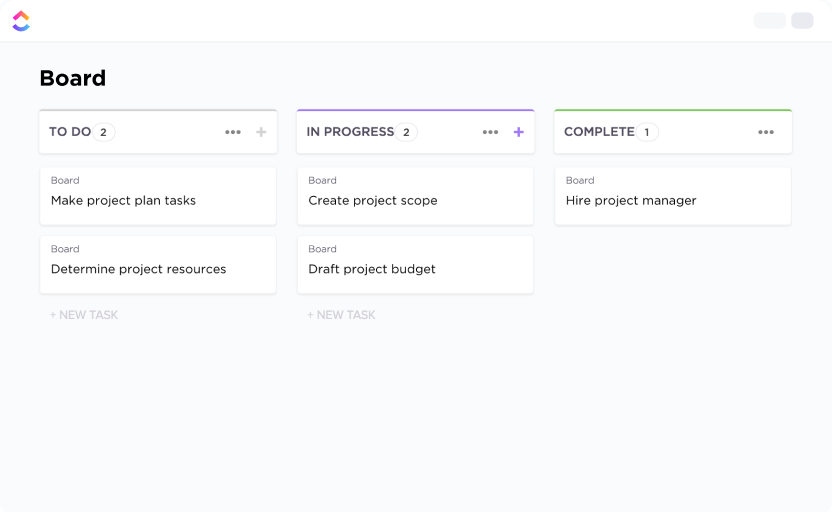
The ClickUp Kanban Board Template adds structure to your workflow by turning tasks into visual cards that move through stages such as Open, In Progress, Review, and Closed. Each task card carries its assignee, subtasks, due date, and priority, so teams always know what’s next and who’s responsible.
If something gets delayed, you can place it in the Blocked column so bottlenecks become easy to spot. The template lets you add additional views, like Calendar View and Table View, and use Custom Fields to categorize and filter tasks.
Why you’ll love this template:
✅ Ideal for: Agile teams and operations leads who prefer a clear, flexible board to keep priorities and progress aligned.
💡Pro Tip: Use ClickUp Automations to update statuses based on if/then conditions and move tasks between columns automatically
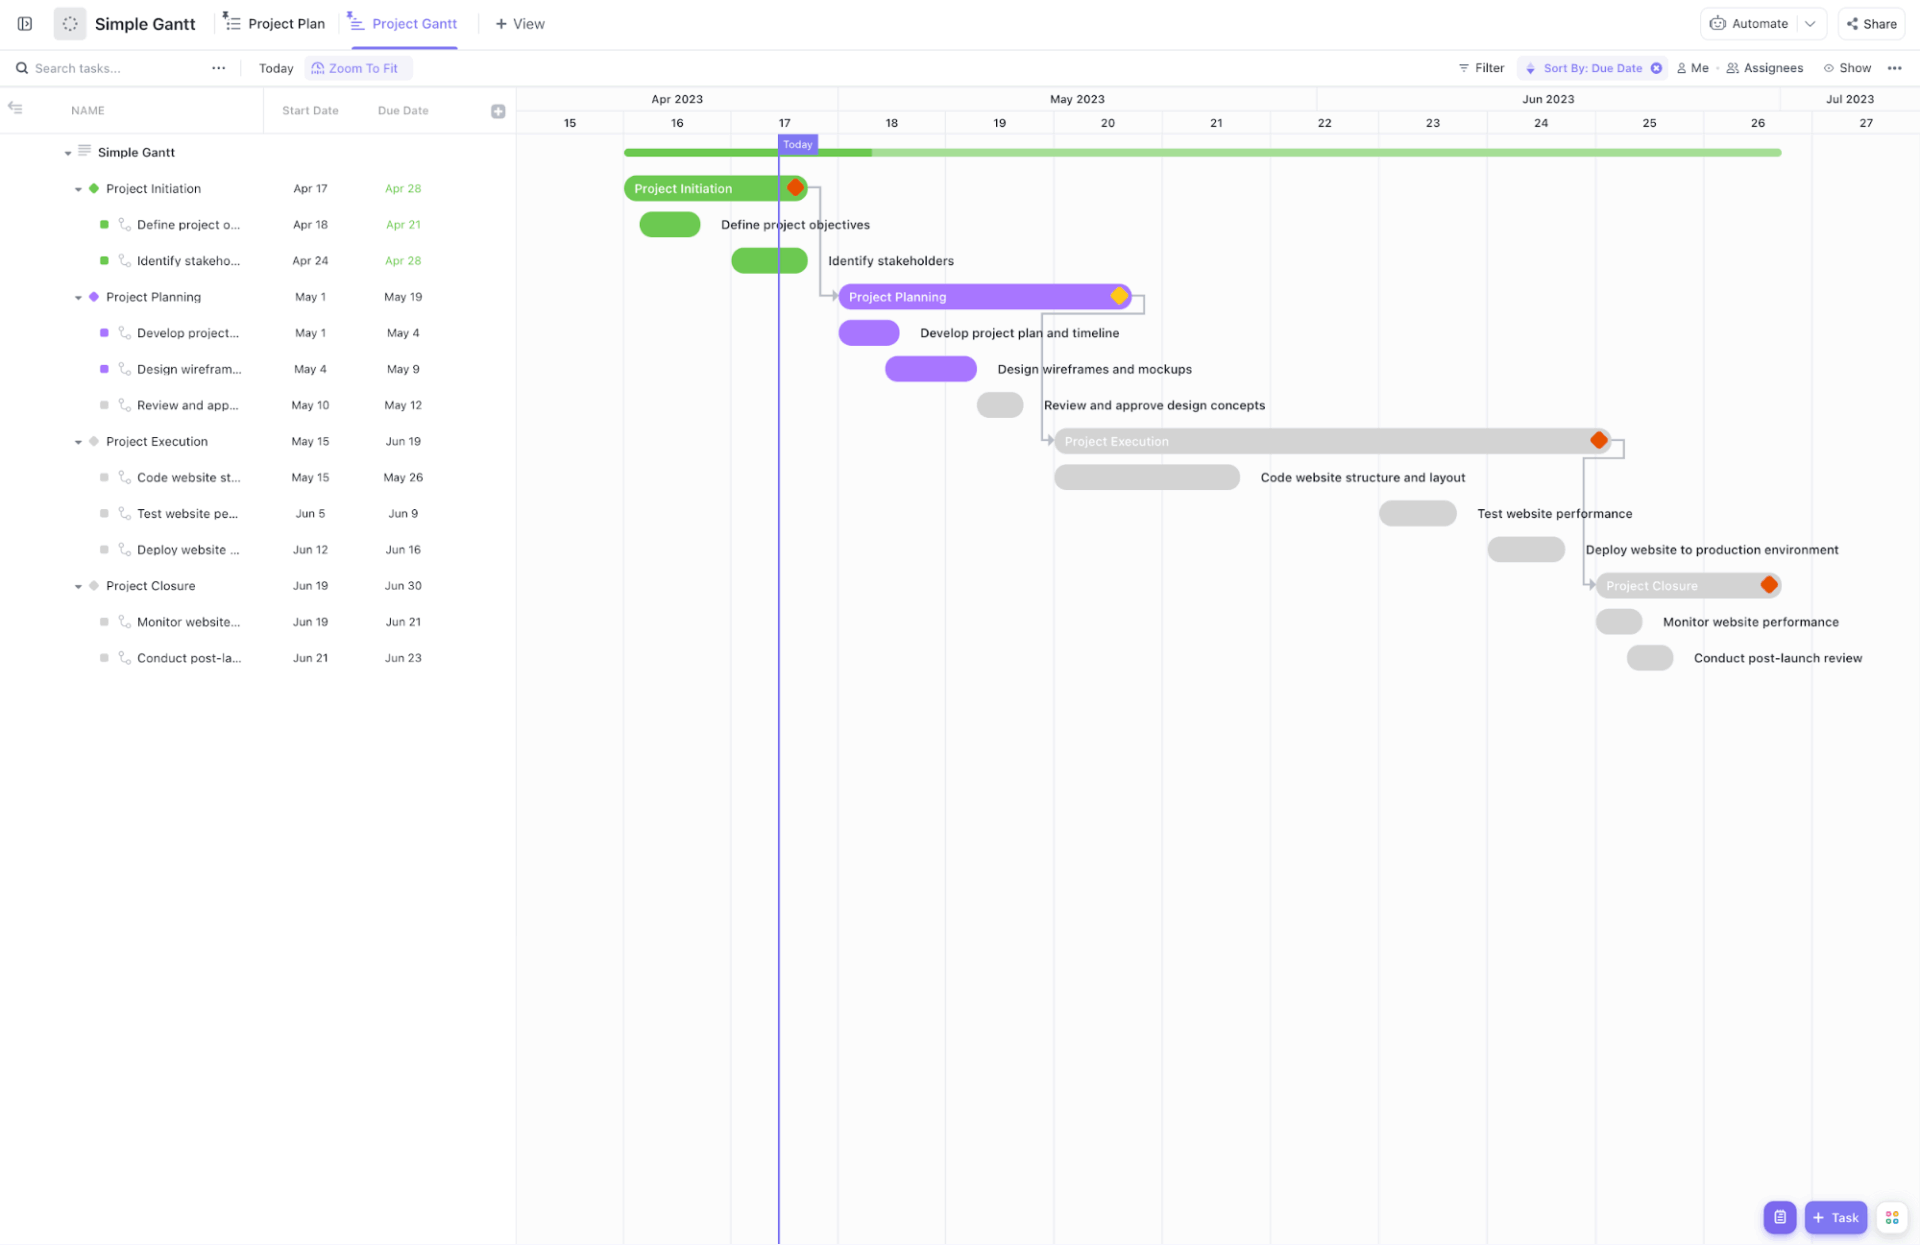
The ClickUp Simple Gantt Chart Template gives you a mini-Gantt setup where you can see dependencies and milestones on a color-coded timeline.
The List View is where you start adding your tasks and set Custom Fields for start date, due date, assignee, priority, type, etc. Once in Gantt View, you’ll see those tasks neatly mapped on a timeline as bars, based on the start and due dates you set.
Drag the bar edges to adjust the task’s duration and connect them to set dependencies. If Reschedule dependencies is turned on, any dependent tasks will move automatically when you shift the main task.
Why you’ll love this template:
✅ Ideal for: Project managers and coordinators managing short projects that need visibility and accountability without complex Gantt software.
💡Pro Tip: ClickUp’s scheduling features allow you to automatically reschedule dependent tasks, skip non-working days, and update timelines when real-world changes happen. This keeps your precedence diagram and project plan always up to date.
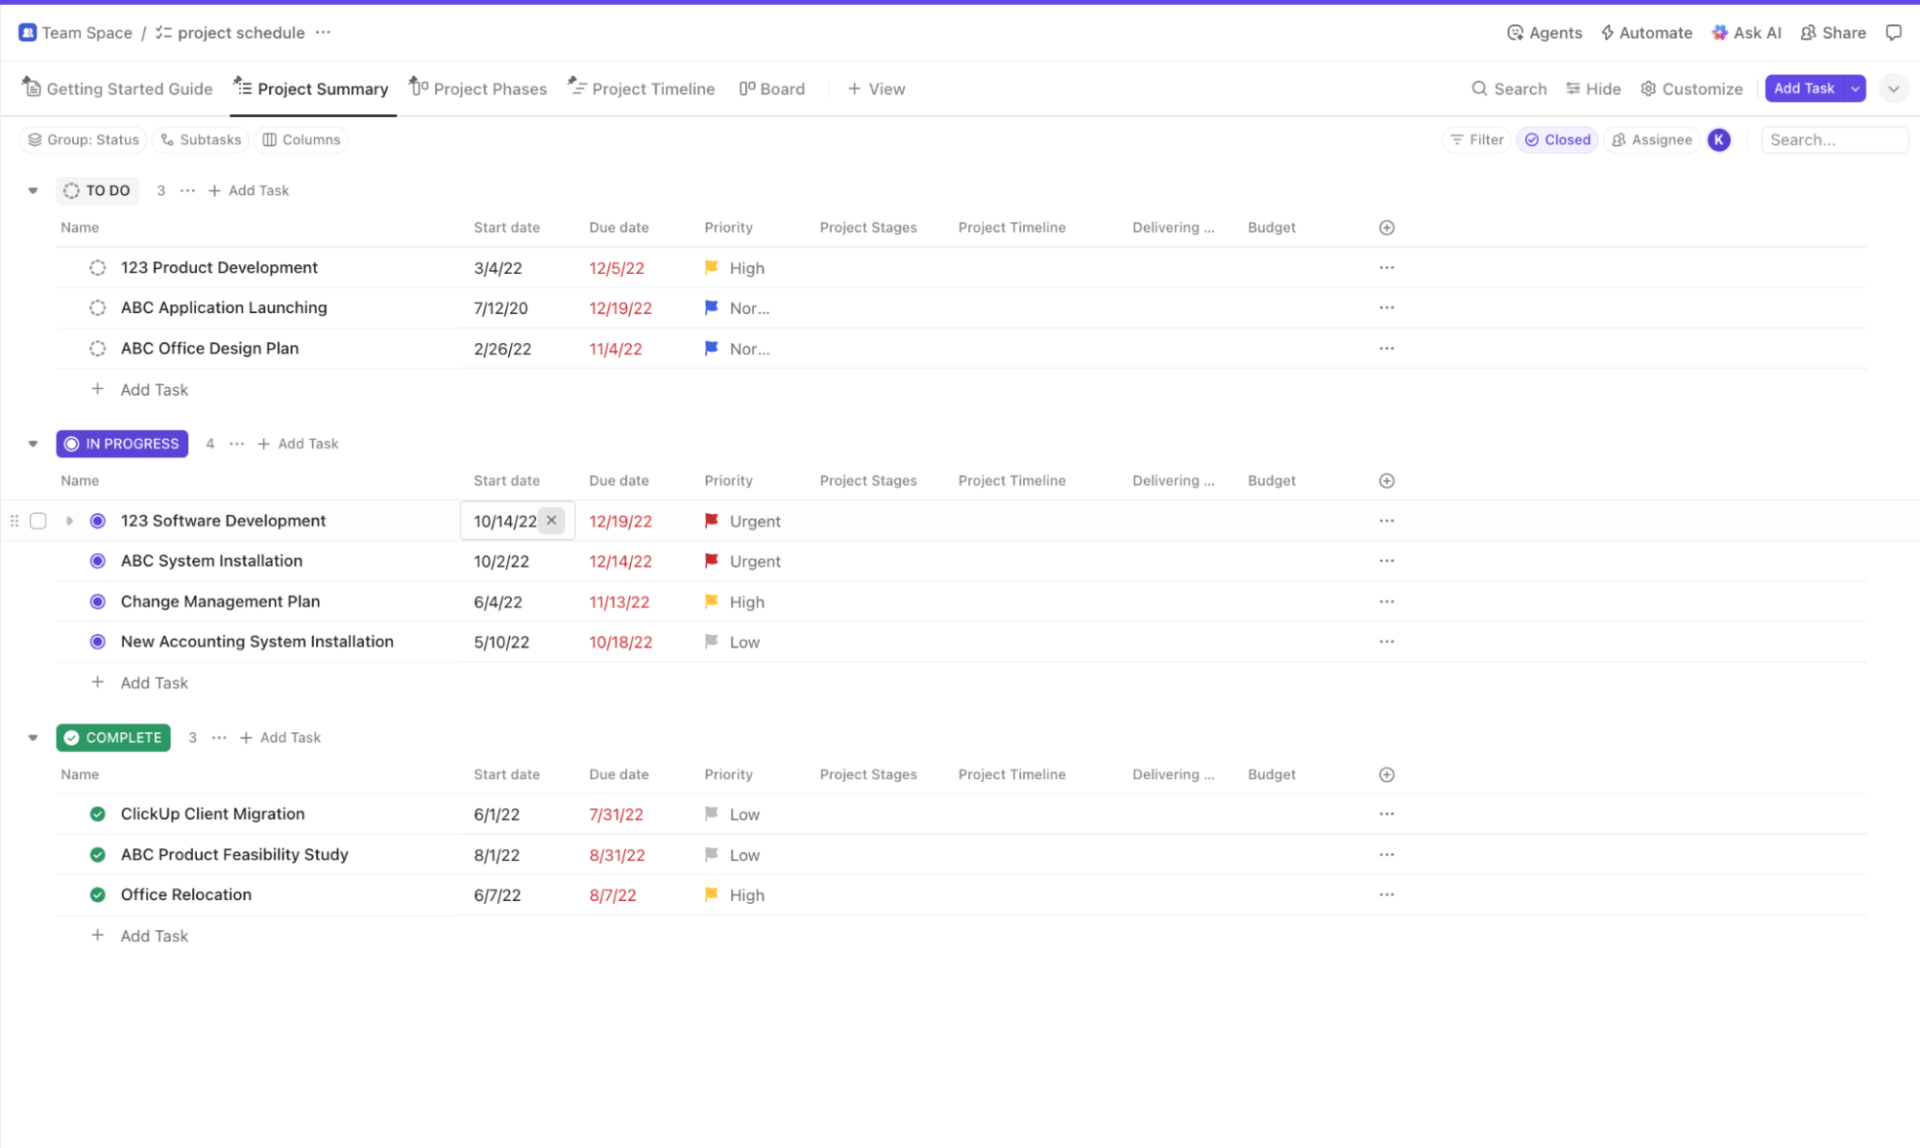
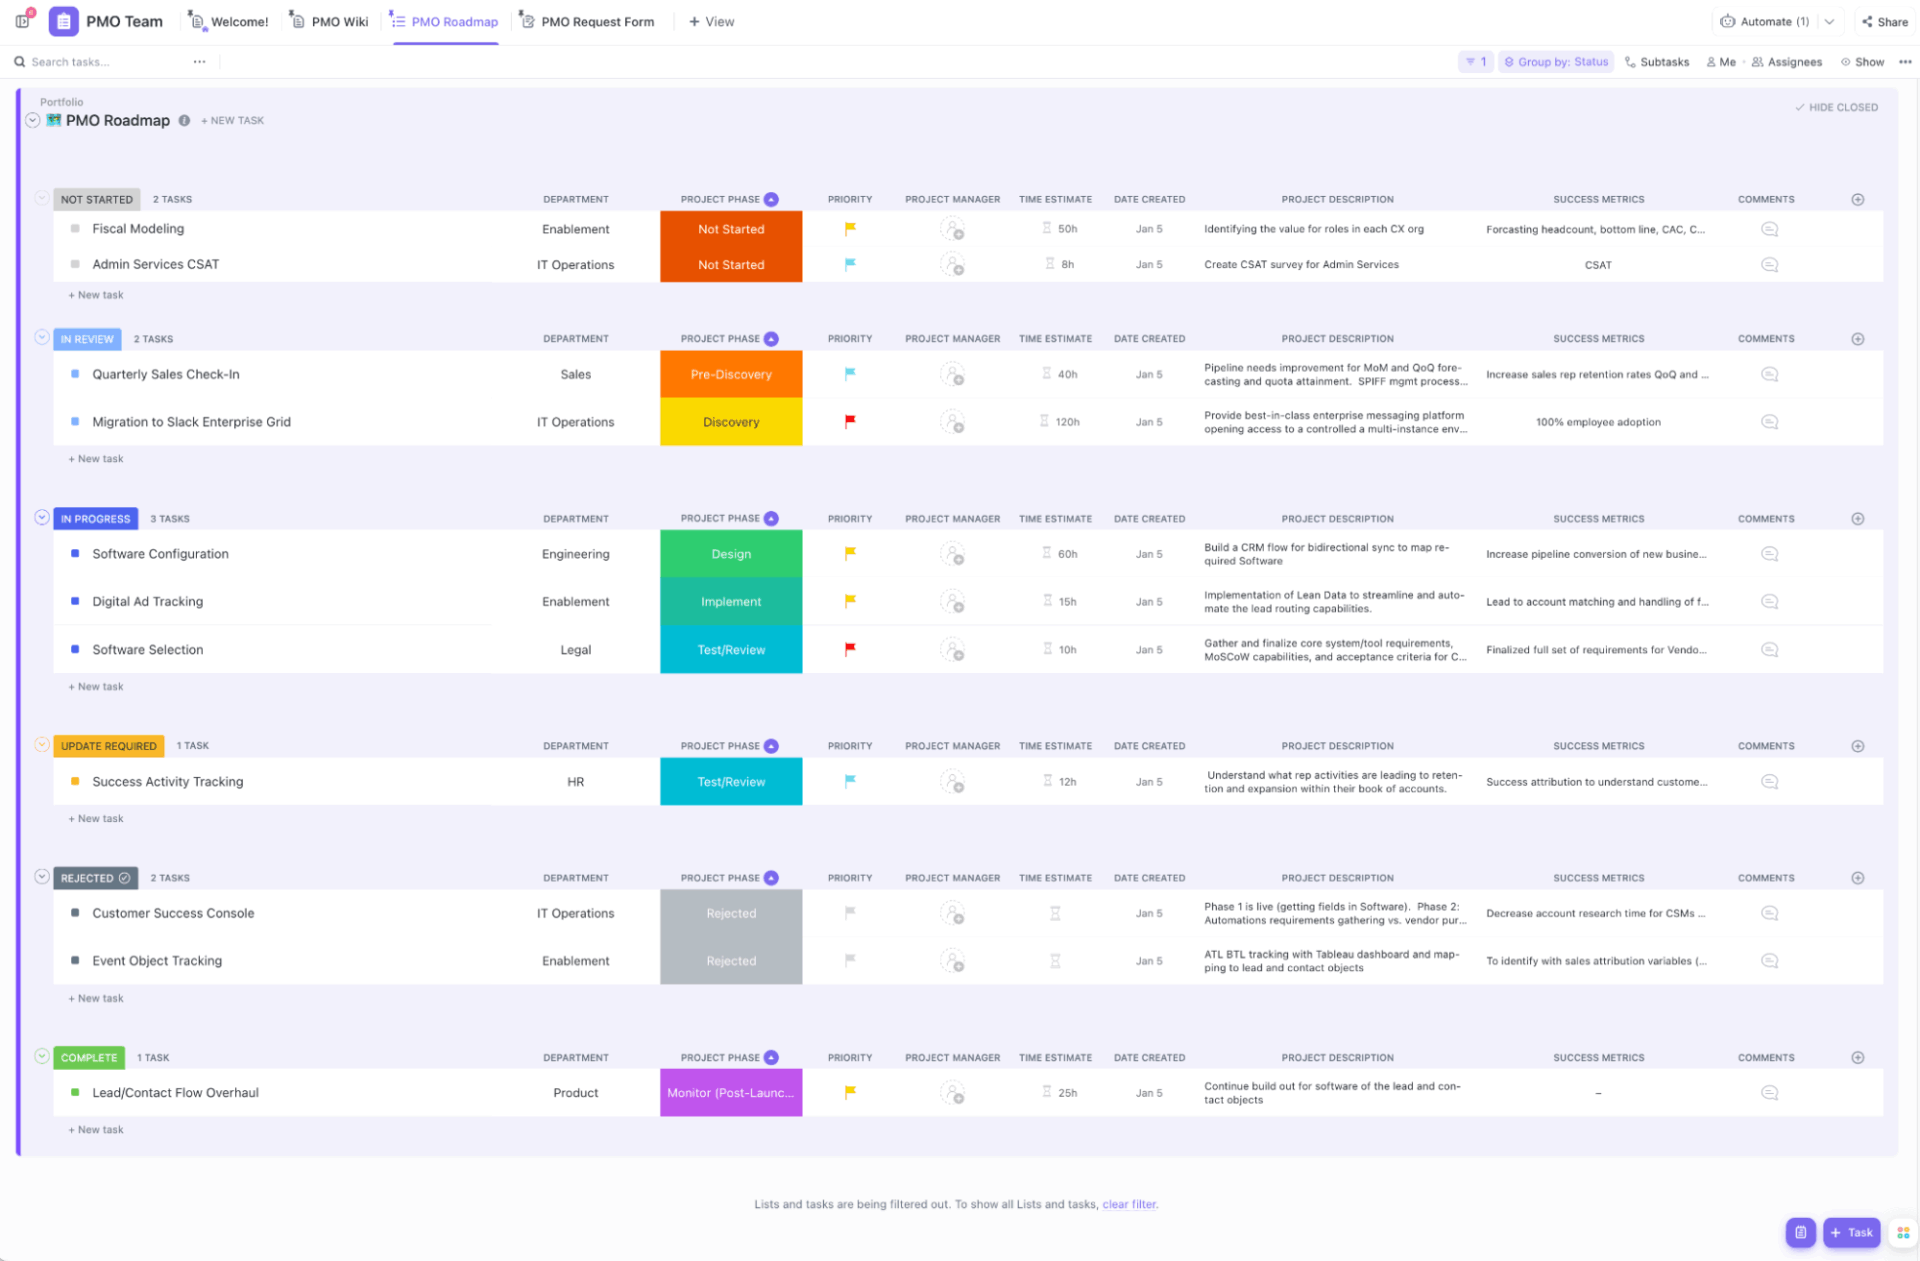
Give your team a single, connected schedule with the Project Schedule Template by ClickUp that turns scattered updates into a clear picture. You’ll get a high-level view of all your active and upcoming projects while being able to drill into phase-specific details.
Switch between List, Board, or Timeline views to see projects by team, stage, or duration. Each of the 15+ Custom Views in ClickUp is synced with real-time updates and color-coded for clarity.
The List View is where you can see all tasks grouped by department or phase. The Board View turns tasks into visual cards that move through phases like Planning, Initiation, Execution, and Completion, making it easier to see progress and balance workloads.
The Timeline View provides visibility into scheduling conflicts and delivery pace to avoid overlaps or delays.
Why you’ll love this template:
✅ Ideal for: PMOs, program managers, and operations heads overseeing multiple cross-functional projects
📚 Read More: Workflow Automation: Project Management Edition
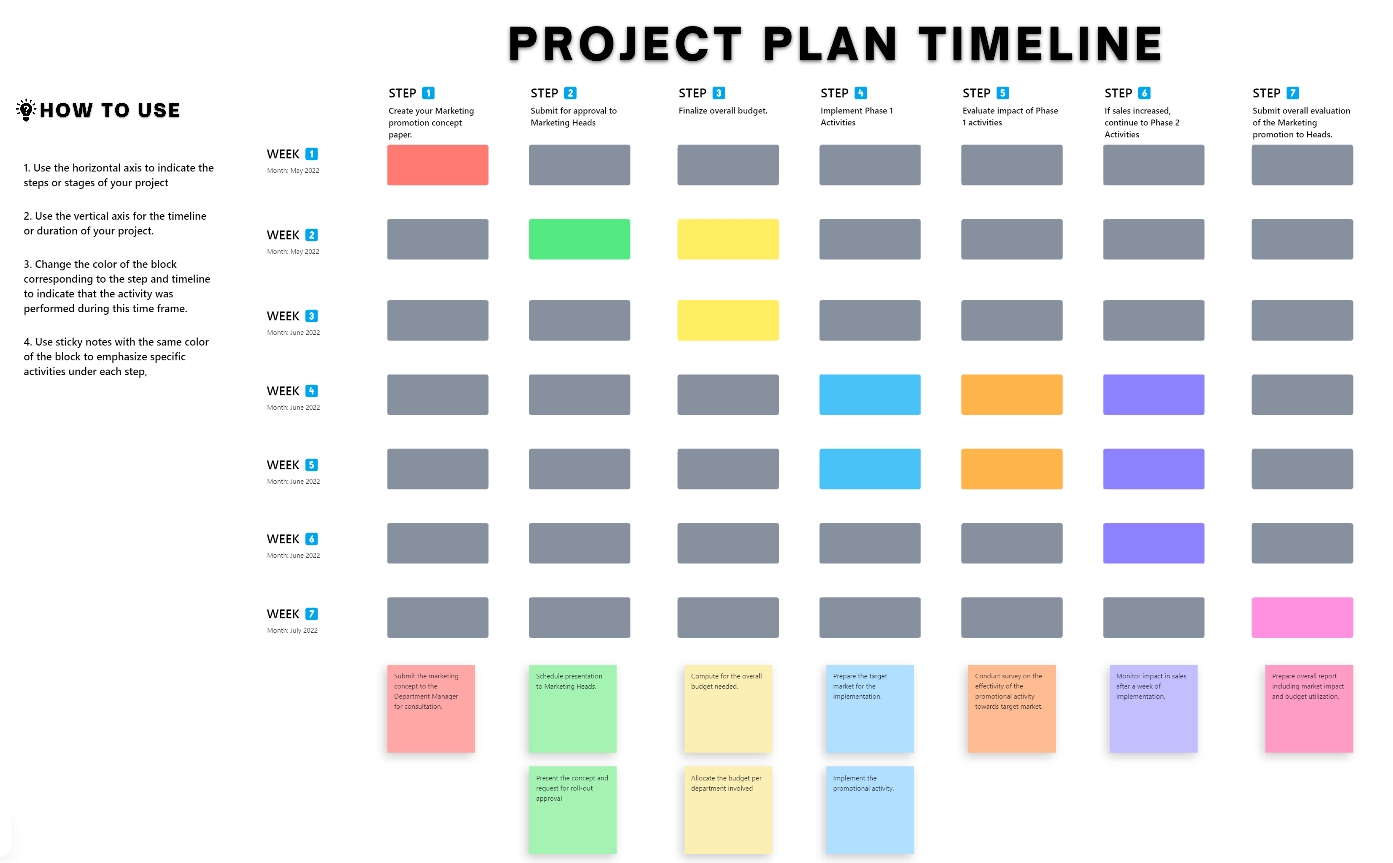
The Project Timeline Whiteboard Template by ClickUp gives you the space to collaborate with your team in real time on ideas and create a high-level project plan with tasks and timeframes. Team members can add tasks on cards, give feedback, draw connections, or use sticky notes for ideas.
ClickUp Whiteboards are flexible. If tasks depend on each other, you can draw lines or connect cards on the whiteboard to show those dependencies. When timelines shift or tasks get updates, you can simply drag-and-drop to reposition or reassign tasks.
Why you’ll love this template:
✅ Ideal for: Project managers, marketing teams, and cross-functional leads who run planning sessions or campaign timelines that evolve fast
💡 Template Archive: Use project timeline templates to make it easier to plan dependencies, track progress, and align priorities in real time, especially for distributed teams.
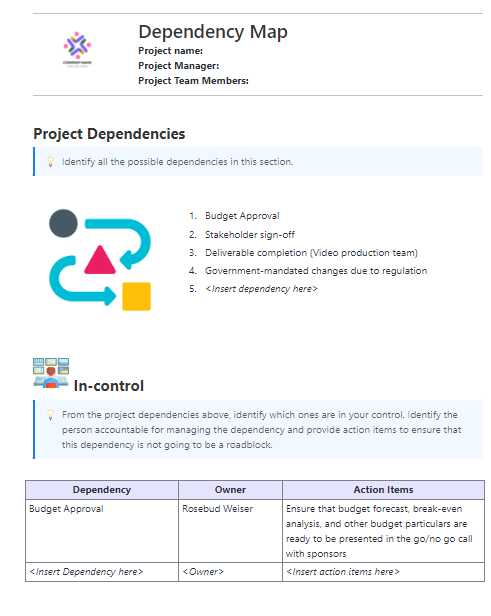
When projects stall, it’s often because dependencies go unnoticed. The ClickUp Dependency Mapping Template is especially designed to help teams identify blockers, plan around delays, assign ownership, and keep timelines on track.
Identify which tasks are waiting on or blocking other tasks, and use Dependencies in ClickUp to map these relationships. Once this is done, you can use priority fields to mark the high-risk or high-impact tasks, so they get the attention they need first.
Why you’ll love this template:
✅ Ideal for: Project managers, PMOs, and operations teams overseeing complex, multi-party projects who need accountability and visibility for early risk detection
💡Pro Tip: With ClickUp Brain MAX, you can search across all your tasks, dependencies, and schedules—even in connected apps like Google Drive or Figma—to find bottlenecks, blockers, or resource conflicts.
Ask questions like “Which tasks are blocking the critical path?” or “Where do we have slack in the schedule?” and get instant, AI-generated answers.

Big projects may stall or fail when momentum slows or when updates are frequently missed. The ClickUp Project Management Template brings all project tasks into one place so teams can plan, assign, and track work without jumping between tools.
Use its pre-structured layout, with project phases, multiple views, and task statuses that reflect real progress. From sprint planning to stakeholder updates, it keeps every project on track and every team member on the same page.
Why you’ll love this template:
✅ Ideal for: Project managers, department heads, and client-facing teams managing multiple projects and requiring a common platform to plan, execute, and report with confidence.
💡Pro Tip: Automate your project reporting using AI Agents in ClickUp. Choose from Prebuilt or Custom Agents to answer stakeholder questions and generate executive summaries, project updates, or standups based on the latest activity, so you always have a clear view of progress and risks—without manual tracking.
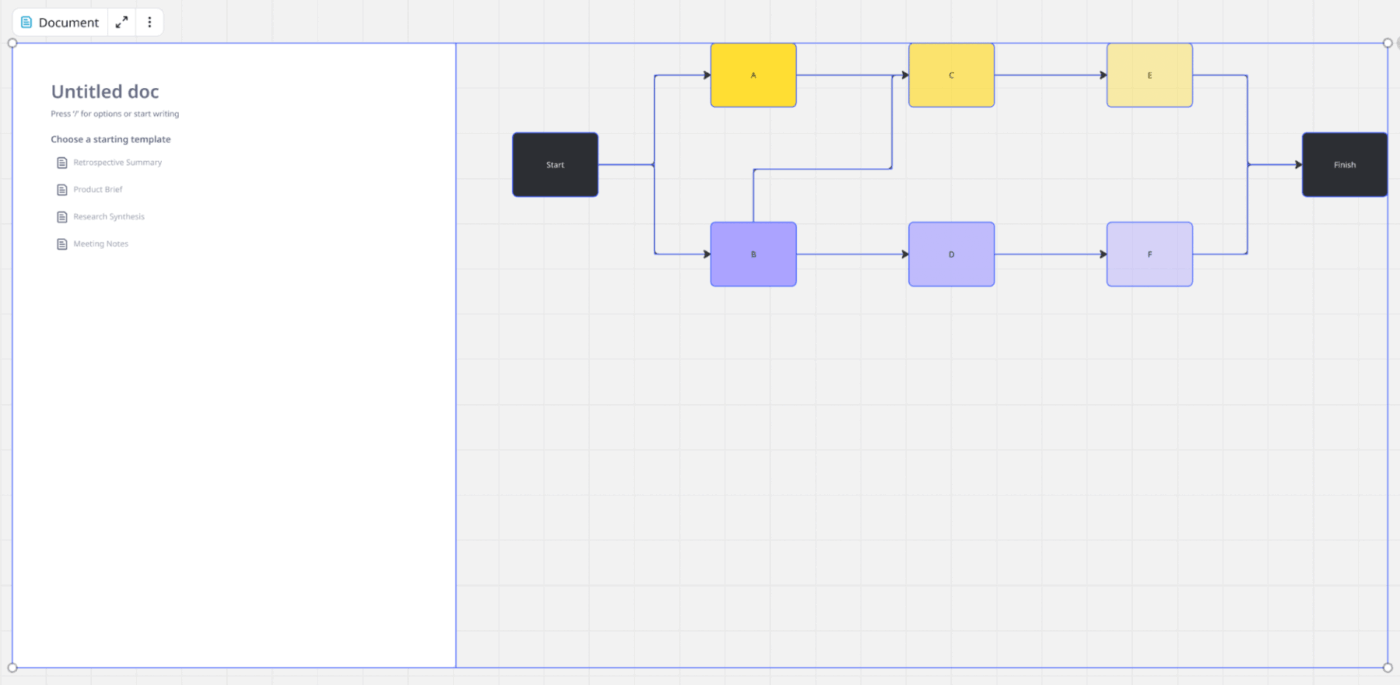
The Miro Precedence Diagram Template enables you to visualize how tasks connect, overlap, and depend on one another.
Instead of static timelines, you get a living map of your project logic from start to finish. See which activities can run in parallel and which ones are potential bottlenecks.
Customization-wise, you can drag, link, or reorder nodes to test different workflows and immediately spot how one delay could impact the next task in sequence.
Why you’ll love this template:
✅ Ideal for: Project managers, PMOs, and operations leads who often visualize dependencies and analyze task order logic
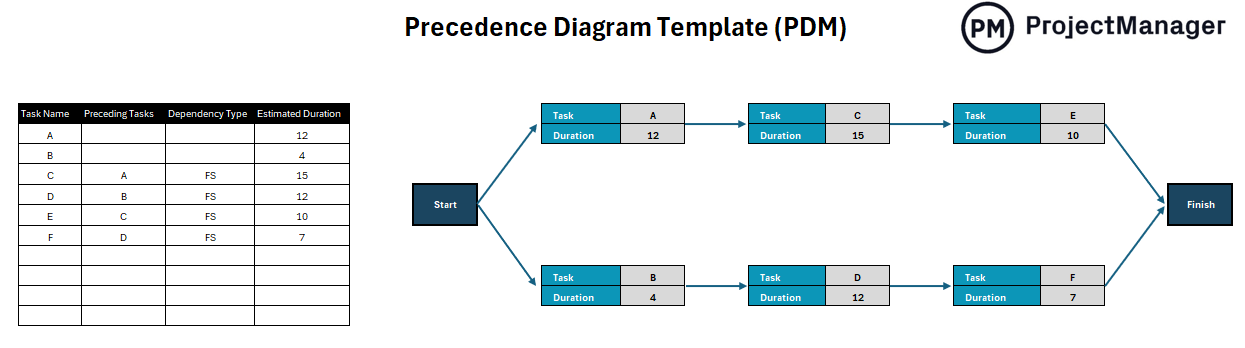
The Excel Precedence Diagram Template gives you a built-in Excel layout that blends data tables and flow diagrams. It lets you input task names, durations, and dependencies that automatically form a sequence chart.
Why you’ll love this template:
✅ Ideal for: Project managers, team leads, and planners mapping task dependencies, optimizing schedules, and ensuring smooth project execution
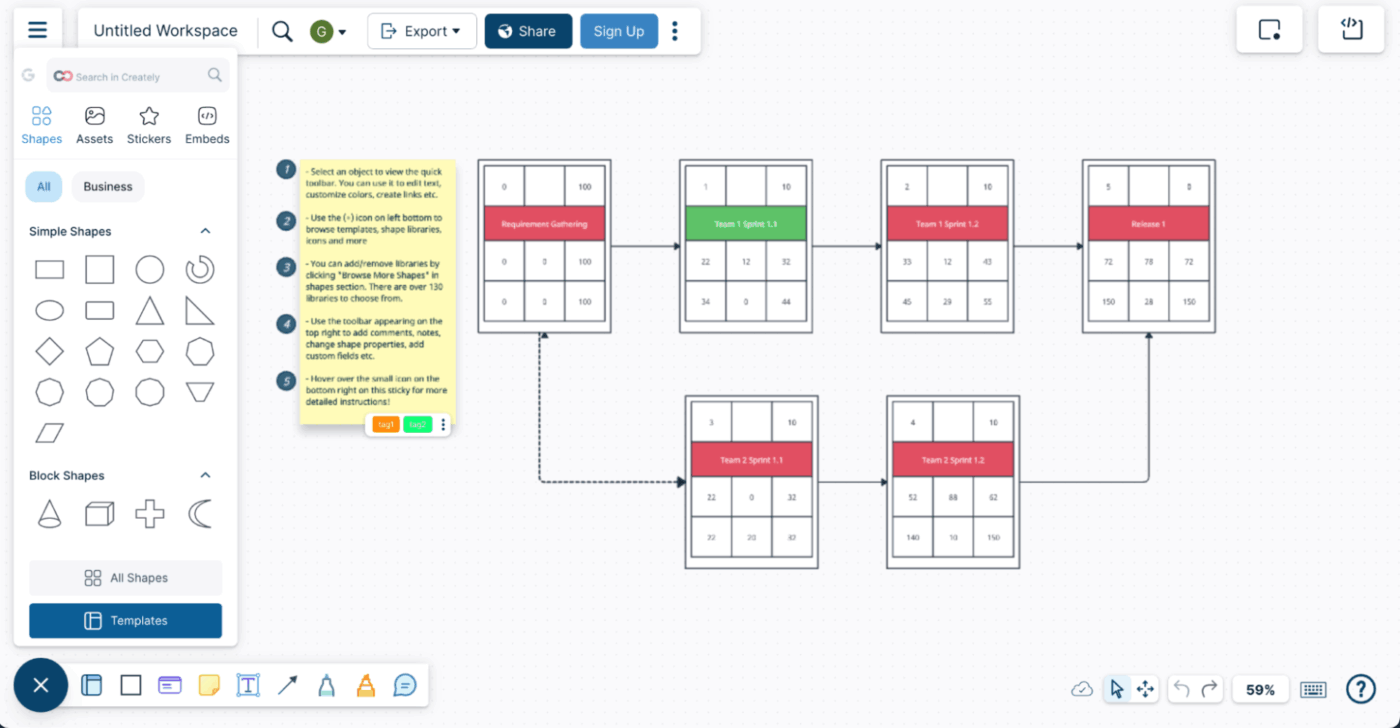
Creately’s Precedence Diagram Template is a planning tool that you can use during the design and planning phases of your projects.
Built for fast iteration, every shape, color, and connector adjusts to how your project evolves. Add notes, responsibilities, or parallel tasks directly on the canvas and export your diagram into slides or reports without needing to redraw anything.
Why you’ll love this template:
✅ Ideal for: Project managers and planners handling interdependent tasks across teams and tight project timelines.
The success (or struggles) of your project is based on how well its moving parts connect. The precedence diagram templates we’ve shared here today let teams identify critical tasks and dependencies, anticipate risks early, and track project management processes with greater confidence.
ClickUp helps you map workflows and manage project timelines in one place. Plus, with all your project tasks, documents, team conversations, and work data in one place, the platform cuts out the overwhelm of work sprawl so you and your team can focus on what really matters.
Sign up for free today!
To start with, you’ll need to list all project activities, define task relationships, and connect them using nodes and arrows to show sequence. Start with the ClickUp templates mentioned above that make it easy to build, edit, and share your precedence diagram visually.
Using precedence diagrams can reveal task dependencies, highlight key project paths, and help teams plan accurate schedules. The visibility reduces delays, improves collaboration, and brings accountability across complex projects.
A precedence diagram can map task logic and project dependencies. On the other hand, a Gantt chart visualizes timelines and progress. Together, they give managers both structural clarity and time-based control.
ClickUp, Miro, and Creately are top choices for their real-time collaboration, customizable templates, and ease of integration with project planning workflows.
Key dependencies in PDM include Finish-to-Start (FS), Start-to-Start (SS), Finish-to-Finish (FF), and Start-to-Finish (SF). Each of these defines how one task relates to another in sequence.

© 2026 ClickUp

There’s an easier way. Try a free AI Agent in ClickUp that actually does the work for you—set up in minutes, save hours every week.