Start using ClickUp today

  • Manage all your work in one place
  • Collaborate with your team
  • Use ClickUp for FREE—forever

The performance review season can often force you to condense a full quarter of selling into a few lines that your management can scan and trust. 

In that scenario, you need to capture your sales performance with clean sales data and key performance indicators without turning them into overwhelming sales reports. That’s tougher than it sounds when your sales metrics sit across tools, and your story gets lost in all the data.

It also explains why writing a sales performance summary takes longer than it should. Salesforce reports sales reps spend only 28% of their week actually selling, while the remainder goes to admin and other tasks.

In this guide on how to write a sales performance summary, you’ll learn what to include and how to write it step by step. You will also see examples, common mistakes to avoid, how to use templates, and how to track everything faster with ClickUp.

Summarize this article with AI ClickUp Brain not only saves you precious time by instantly summarizing articles, it also leverages AI to connect your tasks, docs, people, and more, streamlining your workflow like never before.
ClickUp Brain
Avatar of person using AI Summarize this article for me please

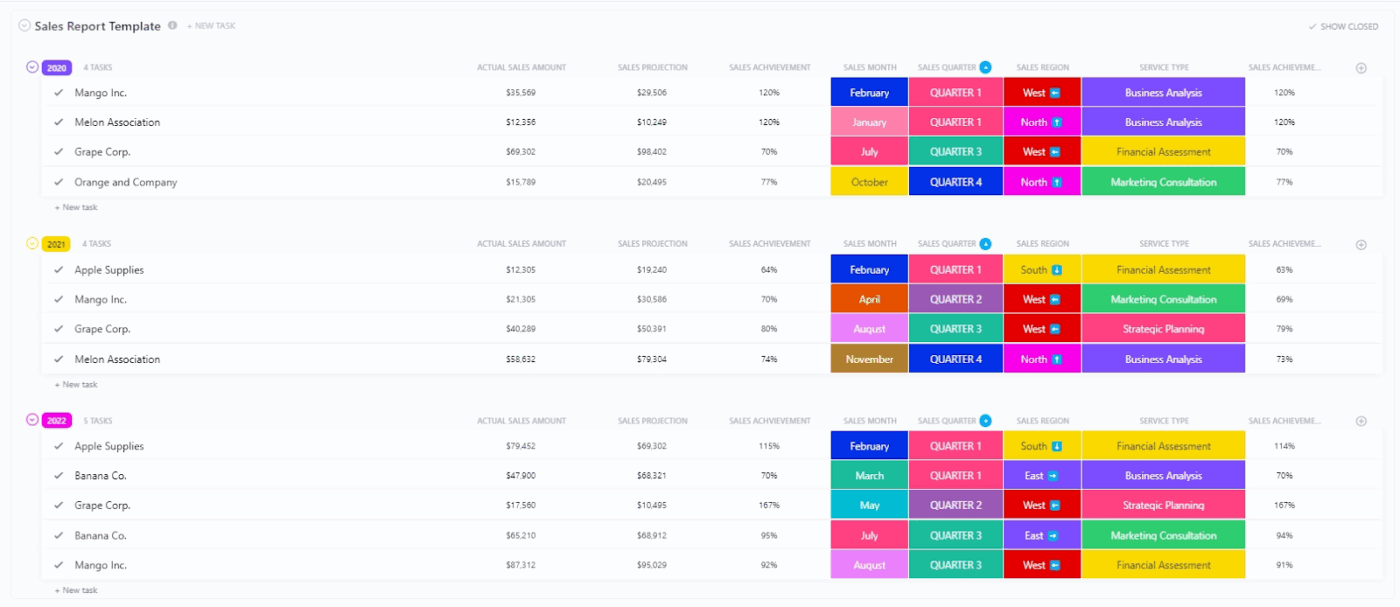
When you’re pulling together an annual sales report, more things need your attention than writing. You must look out for any inconsistencies, faulty data, and incorrect interpretations. 

In such cases, the ClickUp Sales Report Template provides a structured way to gather sales data, track sales performance, and maintain comparable key sales metrics across periods.

Organize your sales list with ClickUp’s Sales Report template
Summarize this article with AI ClickUp Brain not only saves you precious time by instantly summarizing articles, it also leverages AI to connect your tasks, docs, people, and more, streamlining your workflow like never before.
ClickUp Brain
Avatar of person using AI Summarize this article for me please

What Is a Sales Performance Summary?

A sales performance summary is a short, structured report that explains how a sales representative (or a sales team) performed over a specific period. 

The summary uses performance metrics to tell a clear story of what happened, why it happened, and how you can leverage it for future sales.

In a sales performance summary, you need to include the decision-worthy points. This allows a sales manager to coach better and adjust the sales strategy. Various tools like HubSpot, Salesforce, and ClickUp help you write a sales performance summary.

✅ Here’s what makes a sales performance summary different from other documents:

  • A sales report is broader and more “logbook-style.” It is built to track sales pipeline movement, activity, and outcomes across sales representatives
  • A sales performance summary is more analytical, focusing on overall sales performance, and what your sales performance measurement suggests you should do next

🧠 Did You Know? Only 35% of sales pros say they completely trust the accuracy of their data, which is a big reason performance write-ups often need extra context, not just numbers.

Summarize this article with AI ClickUp Brain not only saves you precious time by instantly summarizing articles, it also leverages AI to connect your tasks, docs, people, and more, streamlining your workflow like never before.
ClickUp Brain
Avatar of person using AI Summarize this article for me please

What To Include In A Sales Performance Summary?

To write a sales performance summary, you must follow a consistent structure that ties sales data to business impact. 

Include the components discussed below so that your sales manager (and anyone in HR or sales operations) can review results and diagnose performance trends. 

1) Reporting period and scope

  • Define the timeframe (monthly, quarterly, annual sales reports) and role (sales rep, sales manager, SDR, account manager)
  • Specify what you owned (territory, segment, accounts, inbound vs outbound, product line)
  • Note major changes during the period (coverage shifts, pricing changes, territory realignment)

2) Sales goals and targets

  • List the targets you were measured against (quota, pipeline target, renewal target, MRR/ARR target)
  • Show target vs actual for each goal (one line per goal, no extra commentary)
  • Include any agreed adjustments (ramp period, leave coverage, reassigned accounts)

3) Key performance indicators and outcomes

  • Summarize 3 to 5 key performance indicators (KPIs) that reflect your sales strategy
  • Include outcome metrics (revenue generated, closed deals, win rate, conversion rate)
  • Include efficiency metrics where relevant (average deal size, sales cycle length, average sales cycle)

4) Sales pipeline health and sales forecast view

  • Provide a snapshot of your sales pipeline (pipeline value, stage mix, stalled deals)
  • Point out any forecast accuracy or forecast risk drivers (slippage, late-stage dependencies, buyer delays)
  • Add a short view of what you expect next period (pipeline coverage, commit vs best-case)

5) Activity and sales process inputs (only what explains results)

  • Include activity metrics that link directly to outcomes (sales calls, demos, meetings held, follow-ups)
  • Flag the parts of the sales funnel that improved or weakened (lead-to-meeting, meeting-to-opportunity, late-stage conversion rate)
  • Note process changes that affected performance measurement (new qualification rules, stage definitions, routing)

📮ClickUp Insight: 16% want to run a small business as part of their portfolio, but only 7% currently do.

Fear of having to do it all on your own is one of the many reasons that often holds people back.

If you’re a solo founder, ClickUp Brain MAX acts as your business partner. Ask it to prioritize sales leads, draft outreach emails, or track inventory—while your AI agents handle the busywork.
Every task, from marketing your services to order fulfillment, can be managed via AI-powered workflows – freeing you to focus on growing your business.

6) Customer impact metrics (when your role includes retention or expansion)

  • Report retention and expansion outcomes (renewals, upsells, churn risk, customer churn report summary)
  • Include customer economics if your org uses them (customer lifetime value (CLV), customer acquisition costs, customer lifetime value)
  • Tie customer metrics to actions taken (adoption plans, renewal timelines, stakeholder alignment)

7) Qualitative impact: teamwork, leadership, and operational improvements

  • Document contributions that improved sales team performance (playbooks, handoffs, coaching, onboarding support)
  • Call out cross-functional work that influenced outcomes (marketing campaigns, product alignment, CS escalation)
  • Note repeatable behaviors that supported the team’s success (process discipline, pipeline hygiene, peer enablement)

8) Context behind the numbers

  • Explain 2 to 3 drivers that shaped results (lead quality shifts, buying committee changes, procurement delays, seasonality)
  • Highlight interesting sales trends you observed (pattern in lost deals, stage where deals drop, segment performance)
  • Add any constraints that affected execution (coverage gaps, product limitations, approval timelines)

9) Next steps for future sales

  • List 3 to 5 actions you will take next period, each tied to a metric (conversion rate, forecast accuracy, average deal size, sales cycle length)
  • Separate “continue” items from “fix” items (what worked vs what needs adjustment)
  • Include one improvement focused on reporting quality (cleaner pipeline stages, tighter qualification, stronger sales forecast report inputs)
Summarize this article with AI ClickUp Brain not only saves you precious time by instantly summarizing articles, it also leverages AI to connect your tasks, docs, people, and more, streamlining your workflow like never before.
ClickUp Brain
Avatar of person using AI Summarize this article for me please

Step-by-Step: How To Write A Sales Performance Summary

Follow the steps below to write an optimal sales performance summary:

1) Gather your sales data (and standardize it)

Start by fixing the time window (month, quarter, annual sales) and pulling the same sales data for every sales rep. This will help your sales performance summary stay comparable.

  • Capture outcomes like the revenue generated, closed deals, win rate, average deal size, and sales cycle length
  • Capture pipeline health, such as deal stages, slippage, stalled opportunities, and sales pipeline report movement
  • Capture activity and input, including sales calls, meetings, follow-ups, and marketing campaigns that influenced the pipeline
  • Add customer economics, which involves customer lifetime value (CLV), customer acquisition costs, customer churn report, and monthly recurring revenue

If you track deals inside ClickUp’s CRM workflows, you can store key fields (deal value, stage, owner, and close date).

2) Compare results with goals and targets (without extra spreadsheets)

Next, you need to show performance vs. expectation. This turns a standard sales report into a sales performance review snapshot.

  • Compare quota or target vs actual by individual sales reps and the overall sales team
  • Check pipeline coverage vs. targets to forecast future sales more confidently
  • Note changes that impact targets (territory shifts, lead volume changes, staffing, resource allocation)

In ClickUp, you can track targets by adding quotas and goal numbers as ClickUp Custom Fields on deals or rep-level tasks, assign ownership with ClickUp Tasks, and then visualize target vs. actual on Dashboards for quick team performance checks.

3) Highlight measurable achievements tied to your sales strategy

Pick 3 to 5 key performance indicators that best represent the company’s sales strategy and your role in the sales process. Then show what moved and why.

Some good “signal” metrics (use what fits your sales funnel and sales cycle) are as follows:

  • Conversion rate (the percentage of prospects who take a defined action in your sales process)
  • Average deal size (used to analyze team performance and forecast revenue)
  • Sales cycle length (helps you explain speed to revenue and forecast accuracy)
AI-powered ClickUp Dashboards give you quick, at-a-glance summaries on where things stand

If you’re already using ClickUp Dashboards, this is when you lay out trends visually. For example, average deal size increases while sales cycle length remains flat, or conversion rates improve in the late-stage pipeline. 

ClickUp’s CRM setup also supports dashboard tracking of metrics such as average deal size and customer lifetime value.

4) Use action-oriented language 

Use active language and direct speech in your sales performance summary. Start with the action you took, then attach the result and the metric.

  • Use strong verbs (improved, reduced, increased, rebuilt, negotiated, launched)
  • Write in a simple pattern: Action → impact → metric
  • Prefer specifics over adjectives: “Improved conversion rate from X to Y” beats “Improved pipeline quality.”

5) Add context behind the numbers to interpret correctly

Connect your docs with the rest of your work with ClickUp Docs
Connect your docs with the rest of your work with ClickUp Docs. Get assistance from the built-in AI to generate content!

Numbers in your sales report can shift for reasons that do not show up in a spreadsheet. Add 1 to 2 lines of context so sales leaders can judge your performance fairly.

  • Explain pipeline quality changes (lead source mix, campaign timing, ICP shifts)
  • Flag deal complexity (procurement steps, multi-stakeholder approvals, pricing changes)
  • Note constraints or tailwinds (seasonality, product launches, account churn)

To keep this clean, write the narrative in ClickUp Docs and link supporting proof (notes, decisions, call summaries) next to the numbers. 

6) Add qualitative impact (teamwork and operational wins)

A strong sales summary also shows how you improved sales team performance beyond your own closed deals.

  • Improve handoffs and pipeline hygiene for the sales operations team
  • Mentor sales representatives or onboard new reps to protect future sales
  • Share repeatable plays that improve conversion rate or reduce the average sales cycle
  • Collaborate cross-functionally to unblock deals (CS, product, finance)

HR guidance often emphasizes using both quantitative and qualitative input in performance evaluation, so these details help balance the story. 

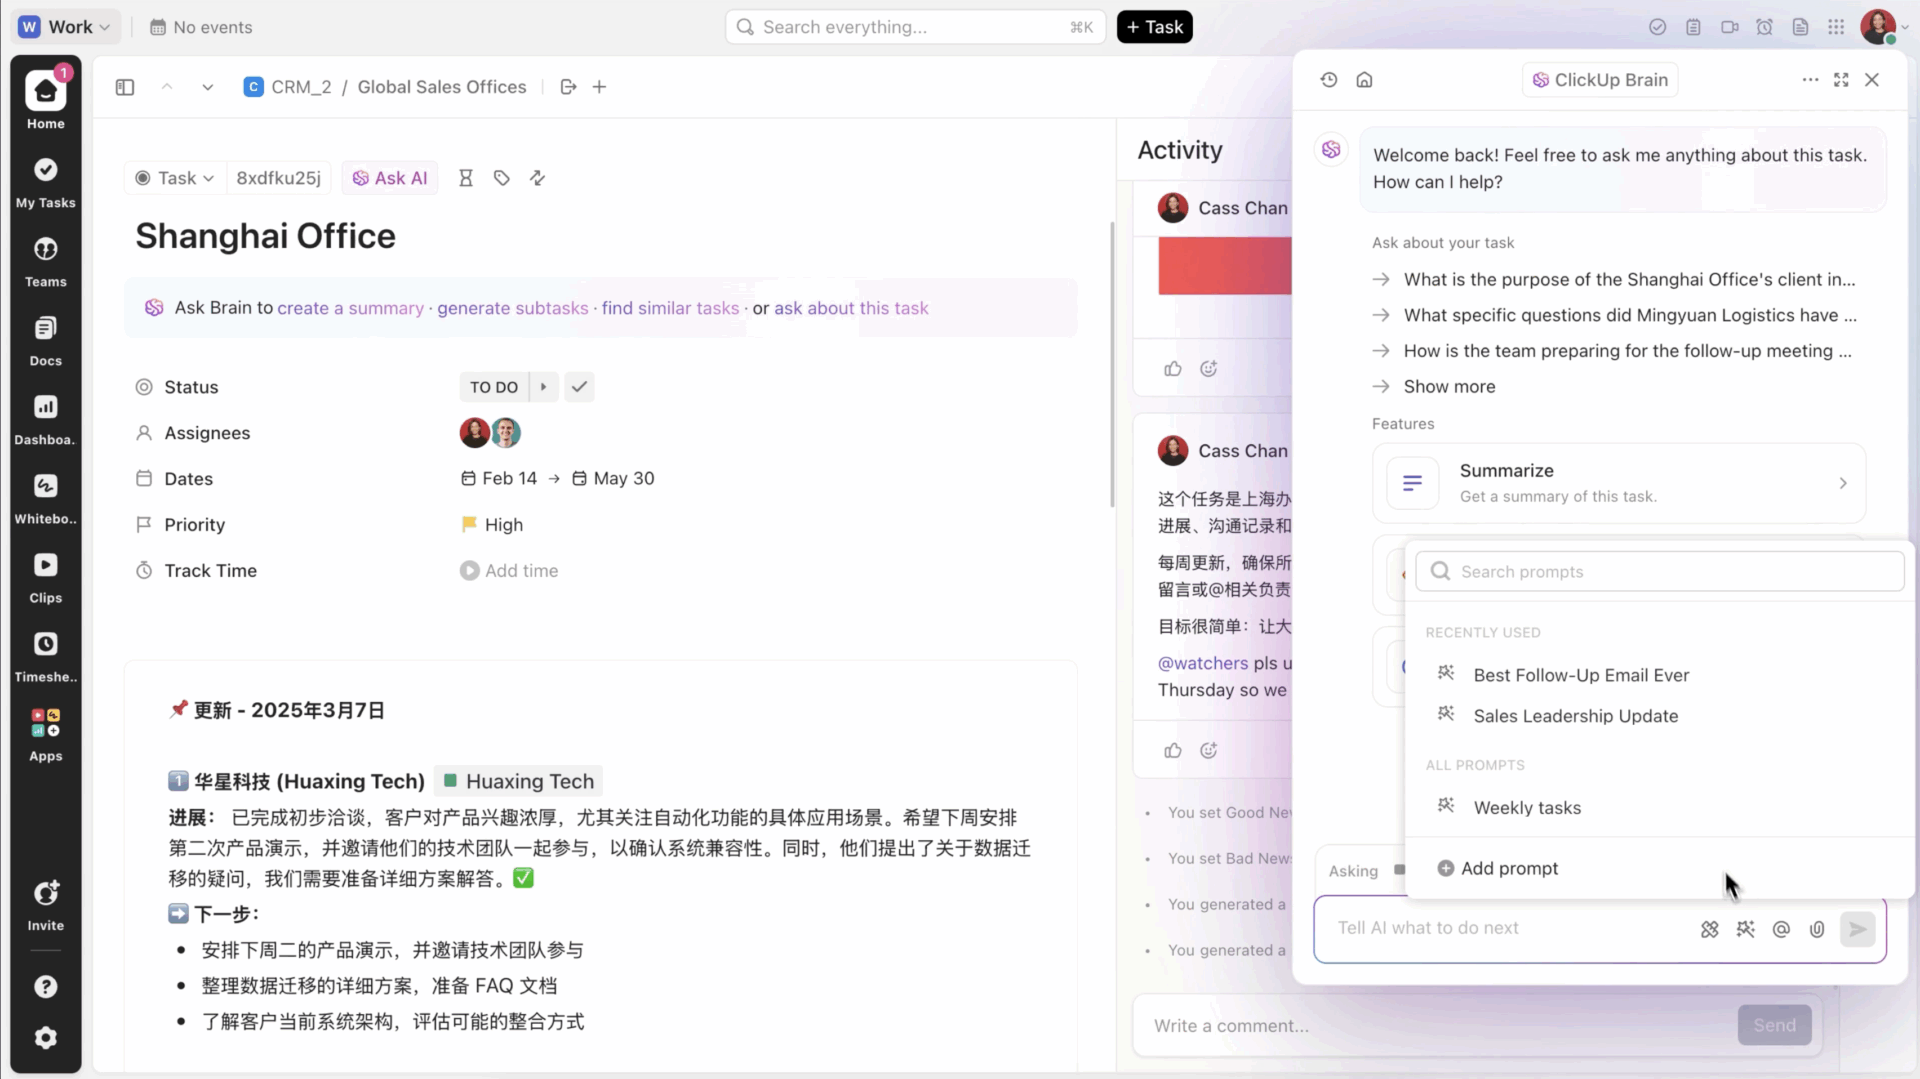
If you want to speed up drafting, you can use ClickUp Brain to turn raw updates across tasks and docs into summaries that can be shared with your team and management. Just @ mention Brain and ask for you what you need!

Summarize this article with AI ClickUp Brain not only saves you precious time by instantly summarizing articles, it also leverages AI to connect your tasks, docs, people, and more, streamlining your workflow like never before.
ClickUp Brain
Avatar of person using AI Summarize this article for me please

Sales Performance Summary Examples

You can use the sales performance summary examples as models for your sales performance review notes. 

Each example balances outcomes (quota, revenue generated, closed deals), pipeline health (sales pipeline report and forecast accuracy), and context so you can evaluate performance fairly and forecast future sales with fewer surprises. 

Let’s go through a couple of sales performance summary examples:

Example 1: Strong closer with forecast accuracy gaps (Account executive)

Michael delivered 111% of his quarterly quota, closing $560K in new business across 12 closed deals. He increased average deal size from $41K to $47K by targeting higher-fit accounts and elevating conversations to economic buyers earlier in the sales cycle. 

His win rate is 30%, above the sales team’s average of 25%, and he consistently earns positive feedback for handling competitive objections while keeping stakeholders aligned through late-stage approvals.

However, his forecast accuracy sits at 73%, below the team’s goal of 90%. Several deals remained in the late-stage pipeline without clear next steps, which made the sales forecast report less reliable for sales operations and resource allocation.

Why this matters:
Accurate forecasts help sales leaders plan hiring, budget, and coverage decisions. When forecast accuracy drops, leadership risks overcommitting resources or underplanning capacity for future sales.

Next steps for growth:

  • Run weekly pipeline hygiene checks to remove stalled opportunities and tighten stage criteria
  • Apply weighted forecasting based on the historical conversion rate by stage
  • Partner with the sales operations team to review the top drivers of forecast misses and update qualification rules

Example 2: High activity, uneven conversion (Sales development representative)

Jessica generated 58 qualified meetings and influenced $820K in pipeline value this quarter. She supported her team’s performance during a higher-volume period driven by marketing campaigns. 

Jessica improved speed-to-lead by responding faster to inbound requests and increased show rate by tightening reminders and pre-meeting confirmation. She also documented the top objections she heard in sales calls and shared patterns that helped AEs adjust messaging earlier in the sales funnel.

However, her meeting-to-opportunity conversion rate is 13%, below the SDR team benchmark of 18%. Several meetings lacked a firm problem definition or timeline, which created friction later in the sales process and reduced downstream win rates.

Why this matters:
Activity metrics only help if they translate into pipeline quality. Strong qualification improves conversion rate downstream and protect forecast accuracy by keeping your sales pipeline report grounded in real buyer intent.

Next steps for growth:

  • Tighten qualification questions to confirm pain, timeline, and stakeholder involvement beforehand
  • Segment outreach by ICP and past-win patterns to improve opportunity quality and sales productivity
  • Review call recordings weekly with an AE to refine discovery and reduce low-intent meetings

Example 3: Enterprise seller with strong deal quality and longer cycle times (Enterprise account executive)

Daniel achieved 92% of the quota while closing $1.05M in annual contract value across 5 enterprise deals, with an average deal size of $210K.

He expanded multi-threading across buying committees earlier and improved late-stage conversion by building clearer business cases tied to measurable outcomes. Daniel also brought in product and security partners earlier, reducing last-minute escalation risks and improving stakeholder alignment.

However, his average sales cycle length increased from 78 to 96 days. Additionally, two of his deals slipped into the next quarter due to procurement and legal reviews. His forecast accuracy fell to 80% because close dates shifted late in the cycle.

Why this matters:
Sales cycle length affects cash flow timing and forecast reliability. When cycle times extend without clear risk flags, it becomes harder to predict future sales and plan coverage accurately.

Next steps for growth:

  • Add formal close-plan checkpoints for legal, security, and procurement to reduce late-stage slippage
  • Create a risk scoring framework for enterprise deals to surface blockers earlier in the pipeline
  • Align forecast categories with documented buyer commitments rather than target close dates

Example 4: Retention and expansion leader with improving customer economics (Account manager)

Ashley protected $980K in monthly recurring revenue while expanding $240K in upsell and add-on revenue from existing customers. 

She reduced renewal risk by building structured QBRs, clarifying success criteria, and escalating product issues earlier. Ashley also improved customer lifetime value (CLV) signals by increasing adoption in strategic accounts. She aligned expansion proposals to usage-based outcomes and renewal timelines.

However, her account prioritization remained reactive in the first half of the quarter, and churn risk surfaced late in two mid-market accounts. That created last-minute resource shifts and made renewal forecasting less predictable.

Why this matters:
Customer lifetime value reflects the long-term revenue you can expect from customer relationships, not just one-time wins. When churn risk appears late, it disrupts planning and reduces forecast accuracy for renewal revenue.

Next steps for growth:

  • Build an account health routine that flags adoption drops and renewal risks 90 days earlier
  • Standardize renewal forecasting with milestone tracking for decision dates and stakeholder alignment
  • Coordinate with sales leaders on expansion plays that balance customer acquisition costs with long-term value

Example 5: Sales manager driving team performance with uneven pipeline coverage (Sales manager)

Brandon led the sales team to 103% attainment this quarter, with total revenue generated up 9% quarter over quarter. 

He improved team performance by standardizing deal reviews and tightening stage exit criteria. He also coached sales reps on handling late-stage objections. 

Win rate improved from 22% to 26%, and the average sales cycle length for SMB deals fell by 11 days after implementing clearer follow-up cadences and qualification standards.

However, pipeline coverage varied widely across the team. Two reps carried less than 2x coverage entering the final month. This increased the risk to the sales forecast and forced late-quarter rebalancing of accounts and support time.

Why this matters:
Pipeline coverage compares the value of your sales funnel to your revenue target and helps you spot gaps early. When coverage drops, you lose predictability and risk future sales.

Next steps for growth:

  • Set weekly pipeline coverage targets by segment and enforce early-stage creation activity
  • Run rep-level performance trends reviews to spot coaching needs before results slip
  • Standardize the sales analysis report cadence so leadership sees the same key metrics every week

💡 Pro Tip: Build an AI-assisted sales summary routine with ClickUp Brain MAX.

Use AI dictation on any app with ClickUp Brain’s Talk to Text feature
Use AI dictation on any app with ClickUp Brain MAX’s Talk to Text feature

ClickUp Brain MAX, the standalone desktop app from ClickUp, helps you keep performance reporting consistent by capturing updates quickly, then pulling the right proof when it’s time to write a sales performance summary. 

Here’s what you can do: 

  • Log performance updates instantly with your voice: Use Talk to Text to convert voice to text hands-free, so weekly rep updates, deal notes, and call takeaways get captured while they’re fresh
  • Ask questions that reveal what changed: Search ClickUp and connected sources to quickly answer prompts like “Which deals slipped this month?” or “What were the most common reasons for stage delays?”
  • Search past decisions fast with Enterprise Search: Leverage Enterprise Search to pull context-rich answers from tasks, Docs, chats, and meetings, so you can support performance claims with the exact decisions, blockers, and follow-ups behind the numbers
  • Choose the right AI for your needs: ClickUp BrainGPT gives you access to multiple LLMs, including Claude, GPT-4, and Gemini for different prompting needs
Summarize this article with AI ClickUp Brain not only saves you precious time by instantly summarizing articles, it also leverages AI to connect your tasks, docs, people, and more, streamlining your workflow like never before.
ClickUp Brain
Avatar of person using AI Summarize this article for me please

Common Mistakes To Avoid

A sales performance summary should make performance easy to evaluate and easy to act on. The following mistakes make the summary less credible during reviews:

  • Skipping goals or targets makes sales performance impossible to score fairly
  • Listing sales metrics without explaining what changed in the sales process
  • Treating activity as performance when outcomes do not improve
  • Reporting closed deals without showing sales pipeline health for future sales
  • Mixing definitions across periods, especially for conversion rate and sales cycle length
  • Comparing individual sales reps without accounting for territory, segment, or lead quality
  • Leaving out context behind the numbers makes coaching and resource allocation harder
  • Using vague language like “performed well” instead of measurable achievements
  • Burying weak performance trends in a long narrative that nobody will scan
  • Ending without next actions, which turns the summary into documentation instead of a plan

🧠 Did You Know? Gartner found that only 45% of sales leaders and sellers have high confidence in their organization’s forecasting accuracy.

Summarize this article with AI ClickUp Brain not only saves you precious time by instantly summarizing articles, it also leverages AI to connect your tasks, docs, people, and more, streamlining your workflow like never before.
ClickUp Brain
Avatar of person using AI Summarize this article for me please

Templates for Writing a Sales Summary Report

When you write an annual sales report (or even a quick monthly update), the hardest part is usually keeping your sales data consistent. This is followed by capturing the context behind those numbers without rebuilding the same format from scratch every cycle.

If you’re looking for sales report templates that combine structure with built-in fields and views, the ClickUp templates below can help:

1. ClickUp Performance Report Template

Measure your team’s progress and identify high performers with ClickUp’s Performance Tracking Report template 

The ClickUp Performance Report Template supports performance narratives that need both outcomes and operational context. This comes in handy, especially when you’re summarizing performance metrics for a review cycle and want follow-ups to stay visible after the report gets shared.

🌻 Here’s how this template will help:

  • Track progress and KPIs with real-time reporting so numbers stay current as work updates
  • Standardize reporting with Custom Statuses, Custom Fields, and multiple views (including List, Gantt, Workload, and Calendar)
  • Keep supporting evidence attached through comments, tagging, attachments, and notifications so the summary reflects decisions and blockers, not only totals

2. ClickUp Summary Report Template

Summarize your data effectively with ClickUp’s Summary Report template 

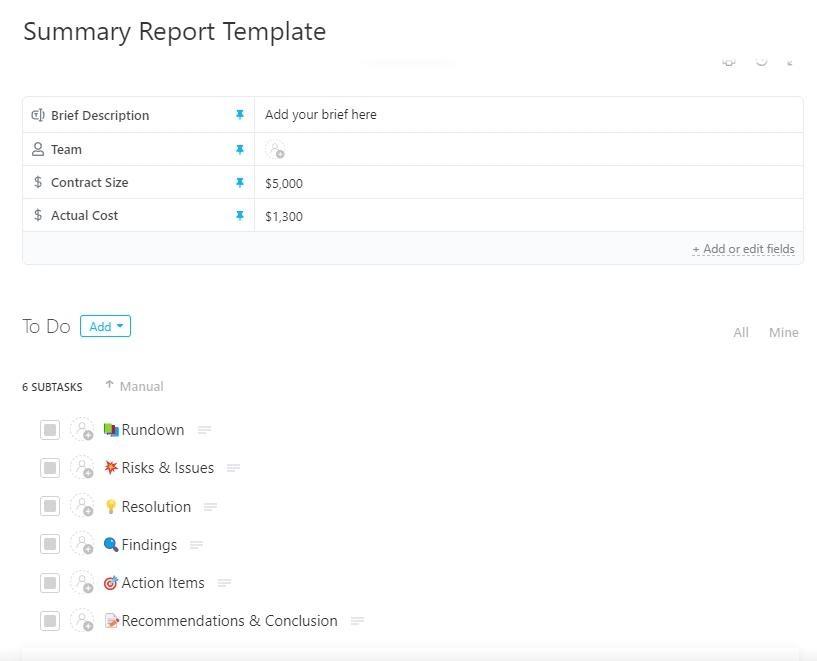
The ClickUp Summary Report Template works well when stakeholders want a high-signal summary first, with the option to drill into the details. It helps you keep the report crisp while still tracking the underlying work and updates over time.

🌻 Here’s how this template will help:

  • Organize complex data into a clear report format and track progress as results change
  • Store report inputs using Custom Fields (examples include Actual Cost, Contract Size, Brief Description, and Team)
  • Build a repeatable reporting workflow with multiple views

🎥 If you’re new to AI in sales or feel like most AI advice is hype, here’s a video on how you can use AI to help you in sales:

3. ClickUp Sales Tracker Template

Track all your sales in real time with ClickUp’s Sales Tracker template

If you are looking for a dependable way to track individual and sales team performance in real time, the ClickUp Sales Tracker Template helps. With this template, your sales activity and pipeline remain visible in one place. 

This is a structured tracker that helps teams see where sales efforts are best spent and make data-driven decisions to improve the sales process and sales pipeline.

🌻 Here’s how this template will help:

  • Track individual and team performance in real time, with clearer visibility into where sales efforts are best spent
  • Organize sales progression with five Custom Statuses (Complete, Goal Met, Goal Unmet, Not Started, Ongoing)
  • Capture consistent sales data using 12 Custom Fields, including examples like Shipping Cost, Are there returns, Unit Cost, Shipping Charge, and Profit Target
  • Review performance from four built-in views, including Sales Tracker, Sales Volume per Month, Getting Started Guide, and Sales Status per Product
  • Support ongoing tracking with project management capabilities such as time tracking, tags, dependency warnings, and emails 
Summarize this article with AI ClickUp Brain not only saves you precious time by instantly summarizing articles, it also leverages AI to connect your tasks, docs, people, and more, streamlining your workflow like never before.
ClickUp Brain
Avatar of person using AI Summarize this article for me please

How ClickUp Can Help You Track and Write Sales Performance Summaries

When you write a sales performance summary, you rarely struggle with just the writing. 

You struggle with collating the data and interpreting it to form measurable actions. Your sales data lives in your CRM, your sales calls live in another tool, your notes live in docs, and your KPIs may be in a spreadsheet someone updates. 

That creates work sprawl, which eats into your sales team’s productivity. You also face AI sprawl, as the next layer of the same problem, where teams use disconnected AI tools that have no context of the work you actually need to summarize. 

This is where ClickUp can help. ClickUp offers a converged AI workspace, where you can keep tasks, docs, reporting, and AI in one connected workspace. This allows you to create your performance summary from what your sales team actually did.

Use ClickUp Docs and Docs Hub for performance summary templates

Use ClickUp’s DocsHub to organise all your docs in one place
Use ClickUp’s Docs Hub to organise all your docs in one place

If you want consistent, fair performance summaries across reps and teams, standardize the structure first. 

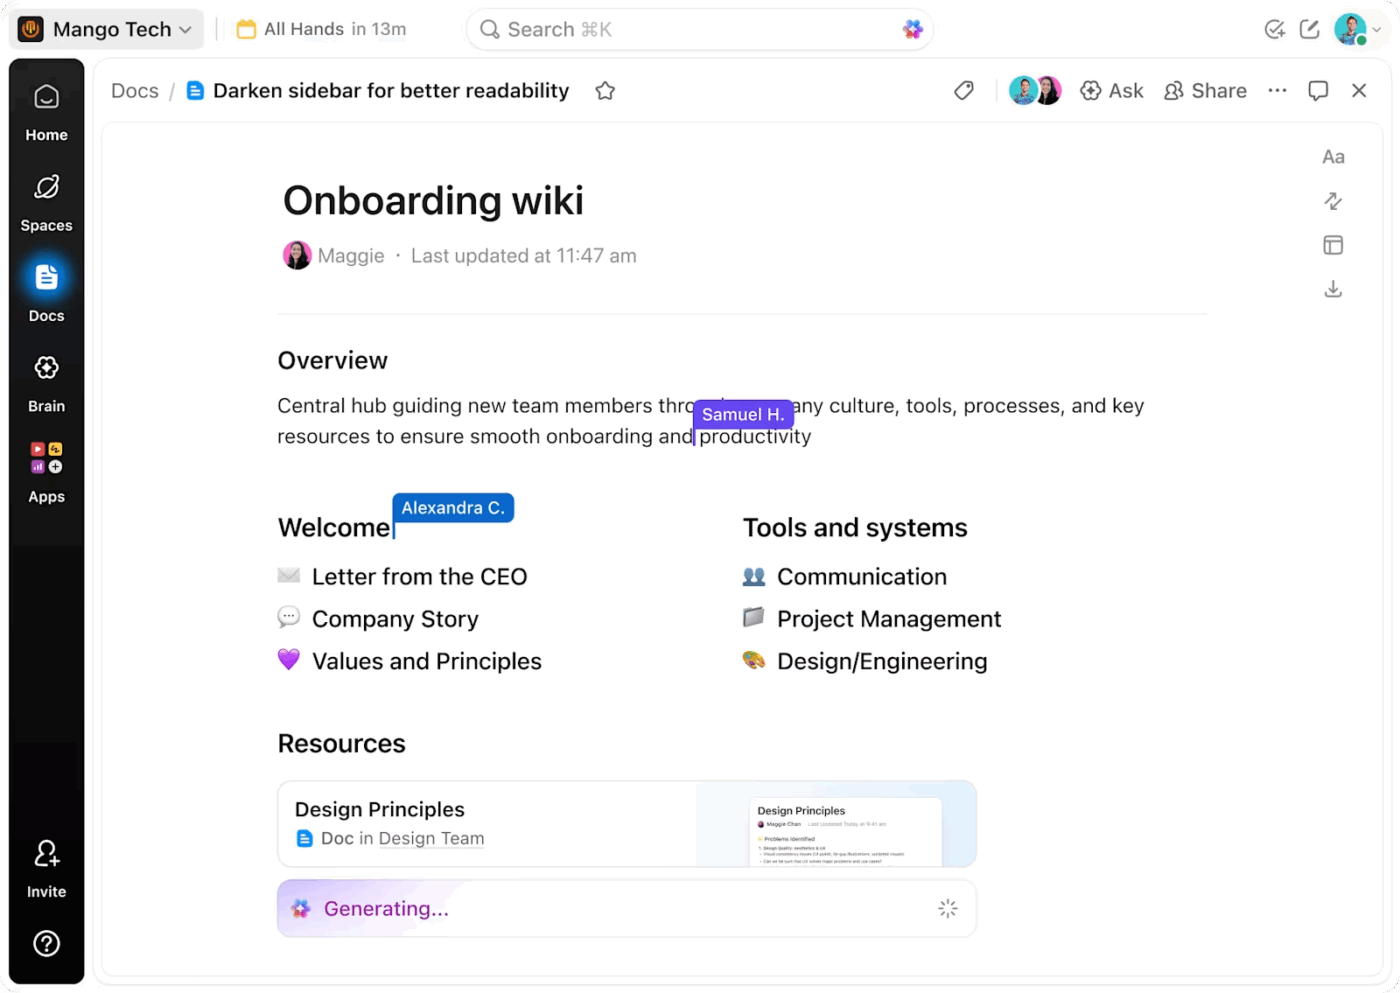
With ClickUp Docs, you can build a repeatable performance summary template (quarterly, monthly, or annual sales reports) with headings for KPIs, pipeline context, wins, risks, and next steps. 

It supports nested pages, tables, and templates, so you can keep the format consistent across all sales reps while still tailoring the content. ClickUp Docs also helps you tag teammates in comments and convert text into trackable tasks. 

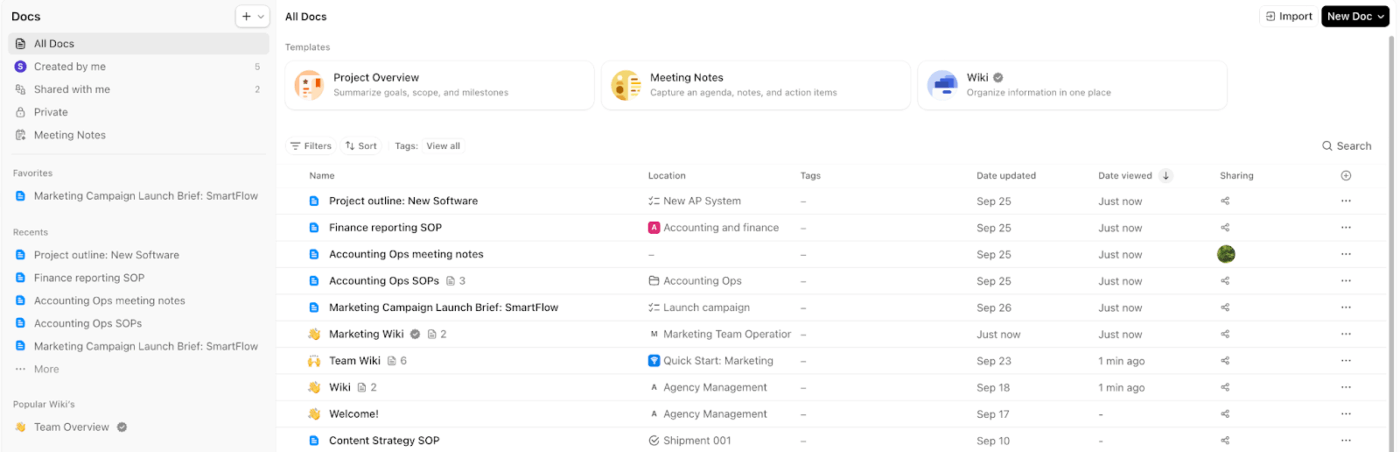
To top it off, ClickUp’s Docs Hub gives you a centralized place to organize and create all your Docs. This makes it easier for sales managers and HR to quickly find the right summary, especially across multiple teams or regions. 

Draft and refine performance summaries with ClickUp Brain

Get detailed project-specific summaries and answers with ClickUp Brain

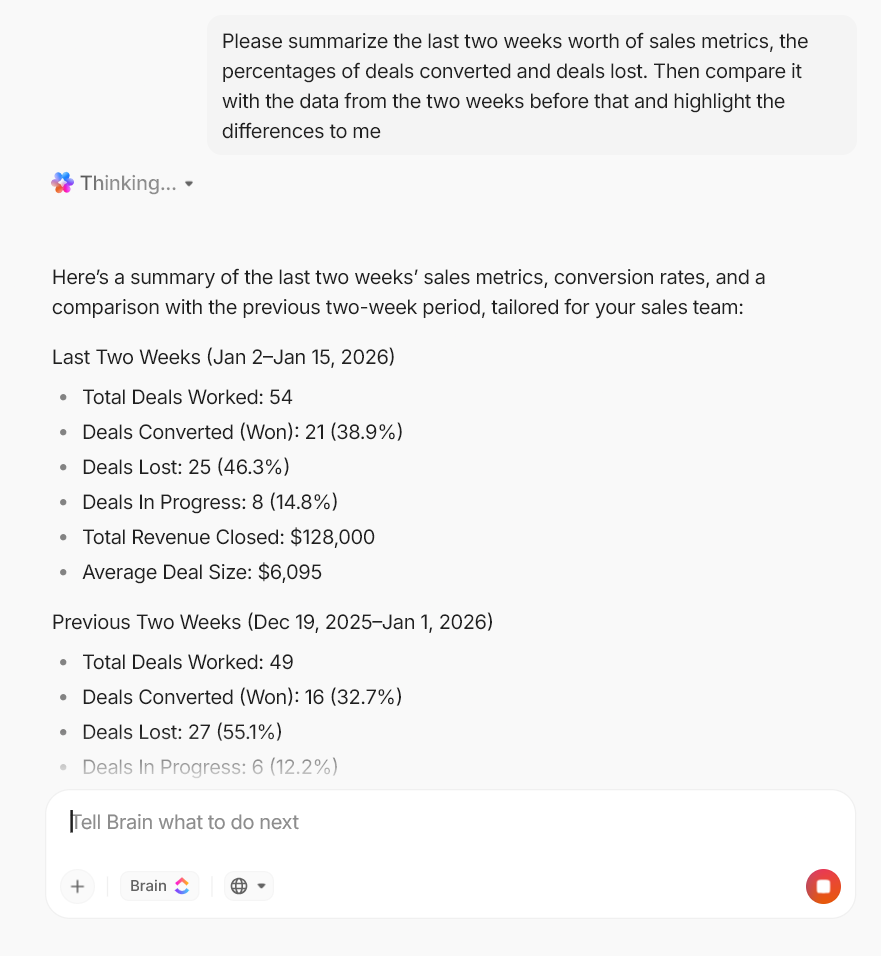
Once your metrics and notes are in the same workspace, AI becomes useful in a very specific way. AI can draft a summary with context. 

ClickUp Brain is designed to work with what you’ve already done. This helps you move from raw activity to a structured first draft faster (without copy-pasting from five different tools). 

✅ Here are two practical ways to use ClickUp Brain for sales performance summaries:

  • Summarize activity and outcomes without rereading everything: ClickUp AI can summarize task activity (descriptions, comments, subtasks) and help you pull a clean list of measurable achievements or risks you need to address 
  • Turn long Docs into executive-ready takeaways: ClickUp AI can summarize a document’s content. This helps when you’ve collected weekly updates and coaching feedback in one place, following which you need a concise performance narrative 

The result is that you spend less time writing from scratch and more time checking the story for context and accuracy.

Turn sales goals into trackable action items with ClickUp Tasks and owners

Manage your tasks in one space and connect them with the rest of your work using ClickUp Tasks 

Your performance summary gets stronger when you can point to owned execution.

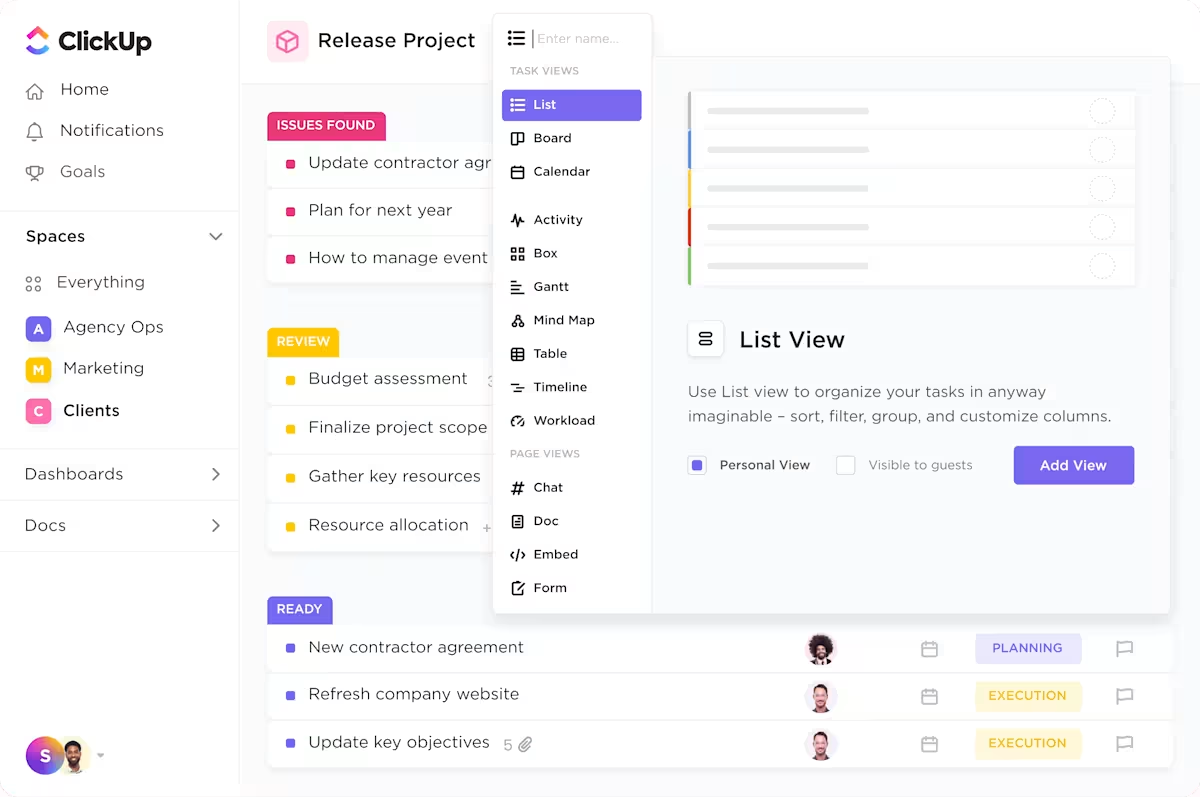
You can use ClickUp Tasks to assign sales goals and supporting work to clear owners (pipeline creation, follow-ups, strategic account plans, renewal milestones), then track progress in the same place you later report on it.

✅ To make this “goal tracking” practical for sales operations, add structure that maps to your review cycle:

  • Track quotas, segments, regions, and periods using ClickUp Custom Fields so every deal, account plan, or pipeline task carries the same metadata 
  • Use formula-friendly numeric fields to calculate rollups you care about (for example, quota attainment or weighted pipeline values) and keep the math tied to the work, not separate spreadsheets 
  • Automate routine ownership steps with ClickUp Automations (like assigning follow-ups when a deal moves stages or creating a task when a renewal window opens) so the “next actions” in your sales process do not depend on memory 

This setup gives you a cleaner audit trail for employee performance: you can show what the rep owned, what shipped, what slipped, and what changed, without having to reconstruct the quarter from memory.

💡 Pro Tip: Automate sales follow-through with ClickUp Super Agents.

Maximise your productivity with ClickUp’s Agentic AI teammates
Maximise your productivity with ClickUp’s Agentic AI teammates 

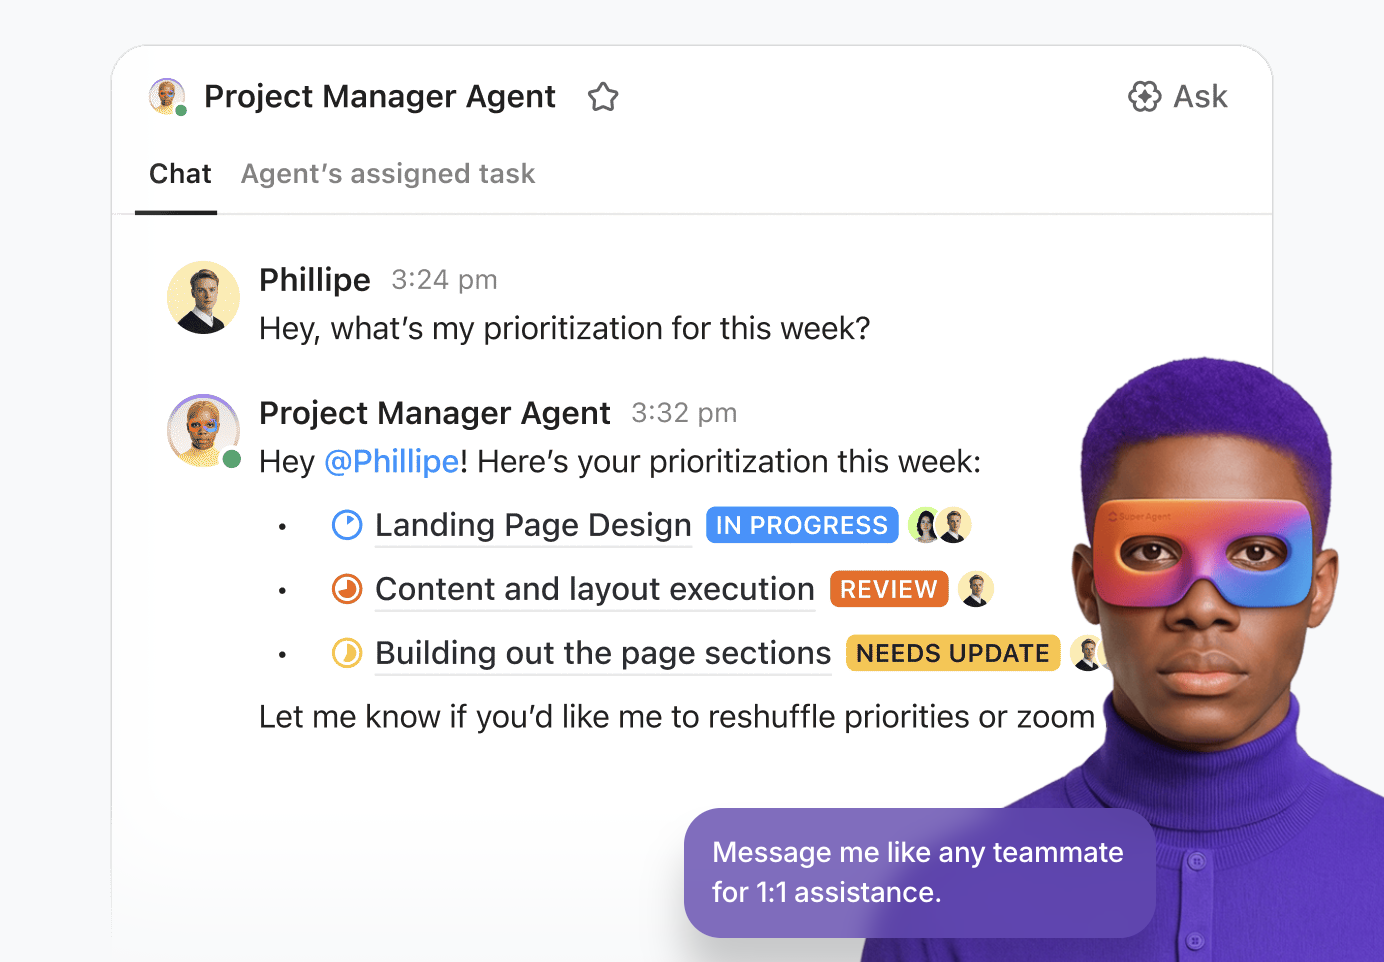
When sales goals get tracked as tasks, the breakdown usually happens in the follow-through. These include updating and creating next steps while keeping ownership clear across the sales team.

 ClickUp supports this with Super Agents:

  • Set up a Super Agent to draft and send performance-cycle emails, assign coaching tasks, schedule review touchpoints, and mention stakeholders based on what’s happening in ClickUp
  • Keep governance clean by controlling which tools/data the agent can access and who can trigger or manage it, with actions logged and human approval required for critical decisions 

Track KPIs, revenue, and quotas with ClickUp Dashboards

Create custom no-code dashboards faster with ClickUp

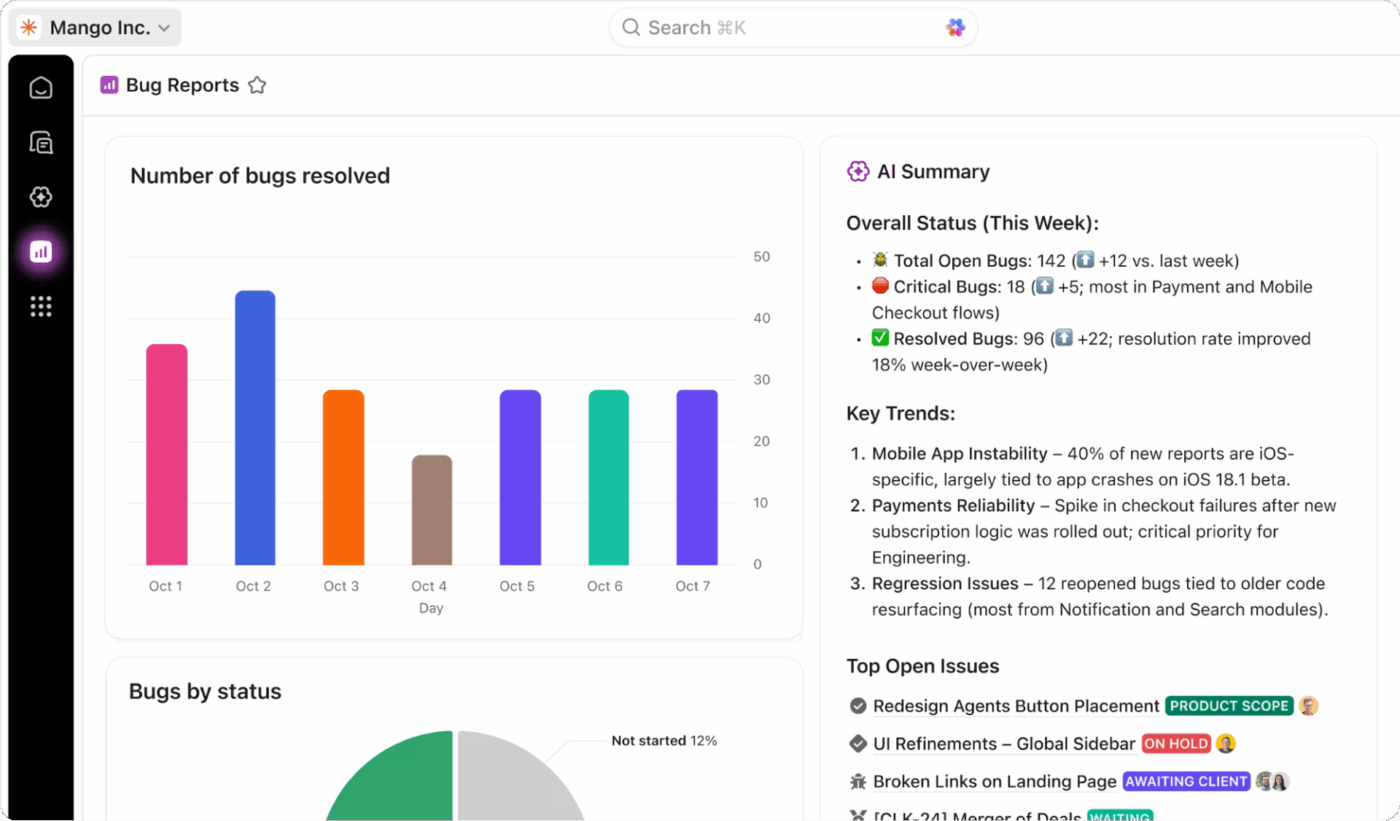
A sales performance summary needs credibility, which usually comes from clear reporting. You need to log the progress, revenue generated, conversion rate shifts, and pipeline movement.

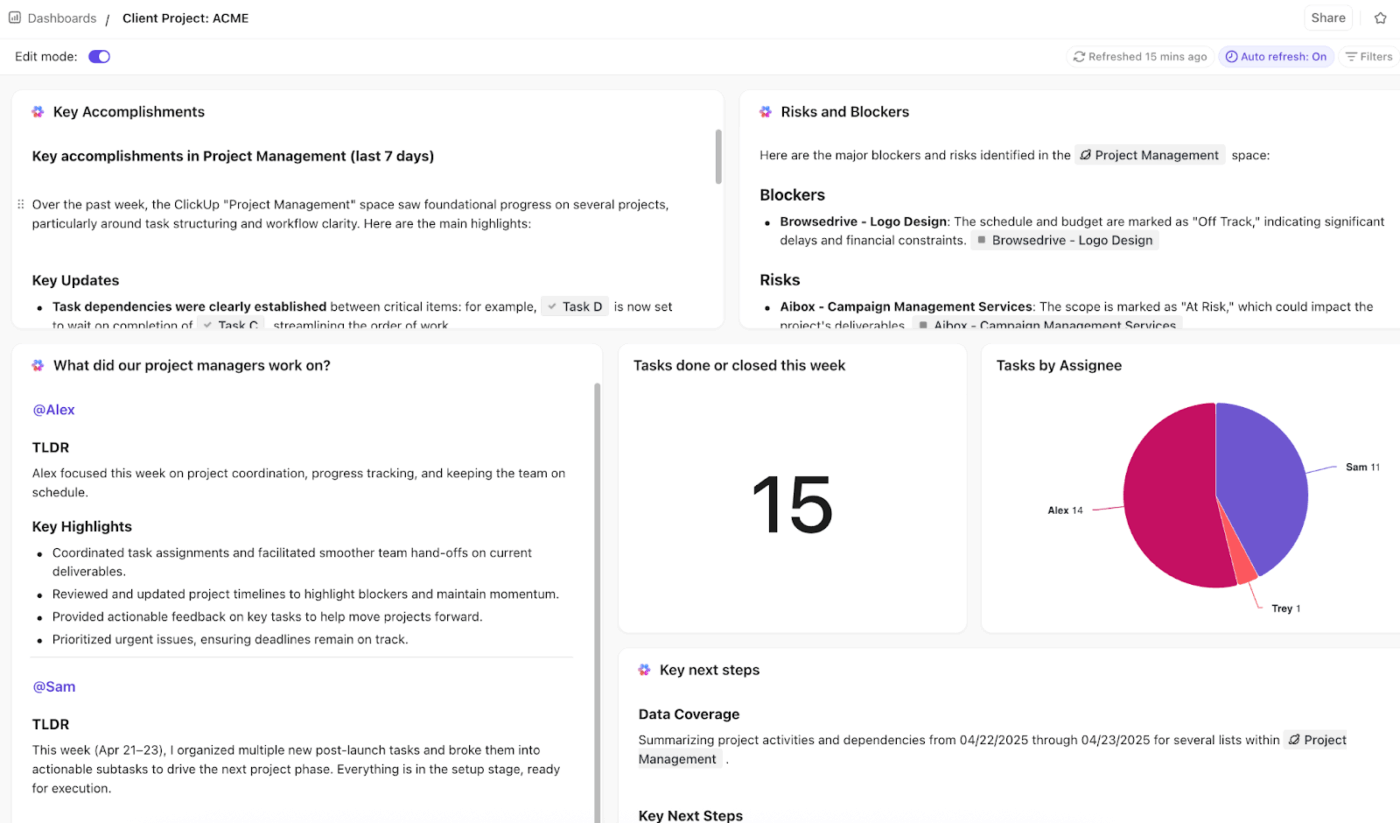
ClickUp Dashboards let you convert that workspace data (including task and Custom Field data) into visual reporting, so you can monitor performance metrics continuously rather than rushing a last-minute sales analysis report. 

✅ For sales managers and team leads, ClickUp Dashboards can help you in the following ways:

  • Build a live KPI view for overall sales performance (revenue, closed deals, pipeline value, rep activity)
  • Compare team performance across segments by filtering the same dashboard view (SMB vs mid-market vs enterprise)
  • Spot performance trends early (stalled pipeline, slipping close dates, uneven resource allocation across reps)

If you run multiple dashboards (team dashboard, pipeline dashboard, forecast dashboard), Dashboards Hub helps you organize, search, and manage them from one centralized location. 

💡 Pro Tip: Turn KPI dashboards into review-ready insights with ClickUp AI Cards.

How to write a sales performance summary-Add AI-powered reporting to your dashboards using ClickUp’s AI Cards
Add AI-powered reporting to your dashboards using ClickUp’s AI Cards

ClickUp AI Cards add AI-powered reporting directly to ClickUp Dashboards, so your performance summary isn’t limited to charts and totals.

  • Generate leadership-ready rollups: Add an AI Executive Summary card to produce an up-to-date summary of the health and status of a selected List, Folder, or Space. This can help you write your sales summary
  • Capture weekly rep activity without manual notes: Add an AI Team StandUp card to summarize selected people or teams’ recent activity over a set time period (e.g., this week, last 7 days). This is suitable for tracking your team’s sales performance.

Run CRM workflows in ClickUp so reporting stays connected to execution

How to write a sales performance summary-Manage everything from customer engagement to orders using ClickUp’s CRM solution
Manage everything from customer engagement to orders using ClickUp’s CRM solution

If your CRM workflow and your reporting workflow are in different places, your summaries start to drift from reality. 

ClickUp’s CRM is flexible enough to match your pipeline, with customizable workflows and smooth handoffs. When you keep your pipeline and execution in the same workspace, it reduces “reporting tax” at the end of the month. 

✅ In practice, that means you can:

  • Build pipeline stages that reflect your sales cycle and track deal stages in views that match how your team works 
  • Automate lead and deal updates (auto-assign leads, trigger follow-ups, update stages) to reduce admin work that slows reps down 
  • Sync customer data and email activity with tools like Salesforce, HubSpot, Gmail, and Outlook, so key context for performance reviews doesn’t disappear into inbox threads 

💡Pro Tip: Keep pipeline updates and follow-through work connected with ClickUp Integrations.

How to write a sales performance summary-Embed web pages into your sales report using ClickUp Integrations
Embed web pages into your sales report using ClickUp Integrations

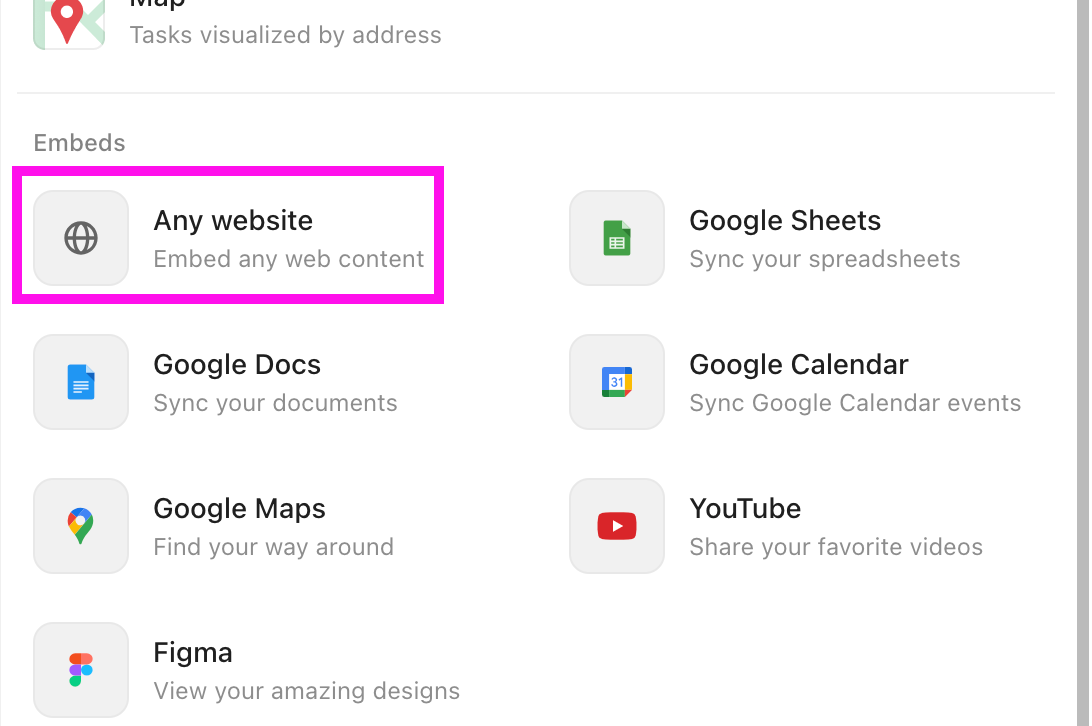
ClickUp Integrations help you link your CRM workflow to the tasks, notes, and handoffs that make performance summaries easier to justify. Instead of copying updates from one tool into another, you can connect deal movement to owned work and keep the reporting trail intact. 

  • Trigger delivery work from deal changes: Connect ClickUp with CRMs like HubSpot so deal-based triggers can create items in ClickUp and push work to the right owner as soon as a deal moves through stages
  • Keep customer communication tied to execution: Integrate email into ClickUp’s CRM setup so outreach and follow-ups stay connected to the work your team needs to complete 
Summarize this article with AI ClickUp Brain not only saves you precious time by instantly summarizing articles, it also leverages AI to connect your tasks, docs, people, and more, streamlining your workflow like never before.
ClickUp Brain
Avatar of person using AI Summarize this article for me please

Write Your Next Sales Performance Summary In ClickUp

A sales performance summary works when it reads like a clear decision note. If you keep your pipeline, notes, and metrics spread across tools, you will keep rewriting the same sales report from scratch. 

That is where work sprawl turns into reporting sprawl. ClickUp helps you bring the workflow together in one place, so your numbers stay tied to the context that explains them.

When your tracking and your writing live in the same workspace, your summaries become faster, fairer, and easier to act on.

Ready to write your next summary? Sign up for ClickUp for free ✅.

Summarize this article with AI ClickUp Brain not only saves you precious time by instantly summarizing articles, it also leverages AI to connect your tasks, docs, people, and more, streamlining your workflow like never before.
ClickUp Brain
Avatar of person using AI Summarize this article for me please

Frequently Asked Questions (FAQ)

1. How do you evaluate a sales rep’s performance fairly?

You evaluate fairly when you judge the rep against the same goals and role expectations you set at the start, then add context like territory, lead quality, and account mix. You look at outcomes and the process behind them, so you reward repeatable execution, not luck.

2. What metrics should I use in a sales performance review?

Use a small set that covers results and how those results were achieved: revenue generated vs quota, closed deals and win rate, sales pipeline coverage, conversion rate at key stages, average deal size, and sales cycle length. If you track them reliably, include forecast accuracy, customer acquisition costs, and customer lifetime value.

3. What’s the difference between a sales review and a performance summary?

A sales review is the conversation and evaluation process that covers results, coaching, and development. A sales performance summary is the short written record of that period’s performance, explaining what happened, why it happened, and what actions to take next.

Everything you need to stay organized and get work done.
clickup product image
Sign up for FREE and start using ClickUp in seconds!
Please enter valid email address