


Still downloading templates?
There’s an easier way. Try a free AI Agent in ClickUp that actually does the work for you—set up in minutes, save hours every week.
Sorry, there were no results found for “”
Sorry, there were no results found for “”
Sorry, there were no results found for “”
The client calls you for a quick update on when you’ll finalize their office construction, but you need help answering. Why? Because you simply don’t know.
Managing construction involves focusing on several variables as you progress through the lifecycle. Multiple crews are at work, a long list of tasks must be accomplished, and you must chase an overwhelming number of timelines.
35% of construction professionals waste over 14 hours per week on nonproductive tasks such as finding project information and dealing with errors.
Every construction manager wishes for a bird’ s-eye view of all project activities and progress. Luckily, Gantt charts make this possible. They provide an overview of tasks, from the smallest to the biggest and from the independent to the interdependent ones.
Let’s learn how to use Gantt charts in construction, how they function, their drawbacks, and how to make your own using some Gantt chart examples.
A Gantt chart is a horizontal bar chart that displays the project schedule status of different tasks and their dependency relations to provide a visual overview of the entire project.
A construction Gantt chart is also the same—it showcases the construction project timelines.
Overseeing varied tasks at once is an inevitable aspect of construction projects, which makes Gantt charts a boon for the industry.
Typically, the left side of a Gantt chart has a spreadsheet detailing the different tasks, allocations, and deadlines. The right side contains a visual bar of each task’s progress.
The managers know exactly what happens, when, and where. If you compare Gantt charts to Kanban boards, milestone charts, and line charts, you’ll realize they offer a much more detailed insight into a project’s progress and subtasks.
Also read: Gantt Charts vs. Timeline
Usually, construction project managers only get a binary knowledge of the project status (such as ‘Completed’ or ‘Not Completed’). Gantt charts detail how much progress a project has made in real-time.
In construction management, the Gantt chart is divided into phases, and each subtask has a designated timeline. You get status updates for each activity, helping you stay informed about the overall project progress and make sure everything happens at the right time.
Suppose a Gantt chart outlines the construction of a house. Electrical wiring can’t begin until framing is complete, and drywall installation depends on the electrical work. By visualizing these dependencies, the chart ensures electricians arrive on-site when needed, not a week early (costing you money) or a week late (holding up drywall).
A Gantt chart also provides information on the available resources so you can adjust your timelines or resources based on the project’s needs.
Let’s say you have two concrete pours scheduled for different parts of the building. The chart can highlight if you have enough concrete trucks and workers to handle both pours simultaneously. This allows you to adjust the schedule or bring in extra resources to avoid delays.
Here’s what a Gantt chart includes:
It’s hard to track numerous tasks across different people and dates. The Gantt chart provides a visual representation of every task in the project within a single dashboard. Whether you want an update or are planning your next move, this one-stop solution is everything you need.
Having all the information in one place simplifies management. You can quickly identify overlaps and prioritize tasks against each other. You can also group tasks to be performed together.
Believe it or not, Excel can come in handy while creating a chart for your construction project management. Let’s see how!
You can create a Gantt chart using Google Sheets or Microsoft Excel, whichever you prefer. We’ll show you the steps to create one in Excel.
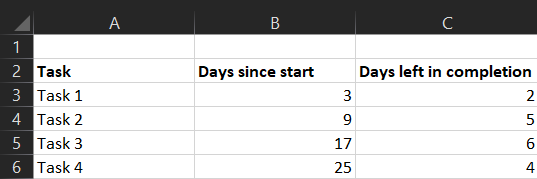
Step 1: Create a data range in Excel detailing the task name, days since start, and days left for completion
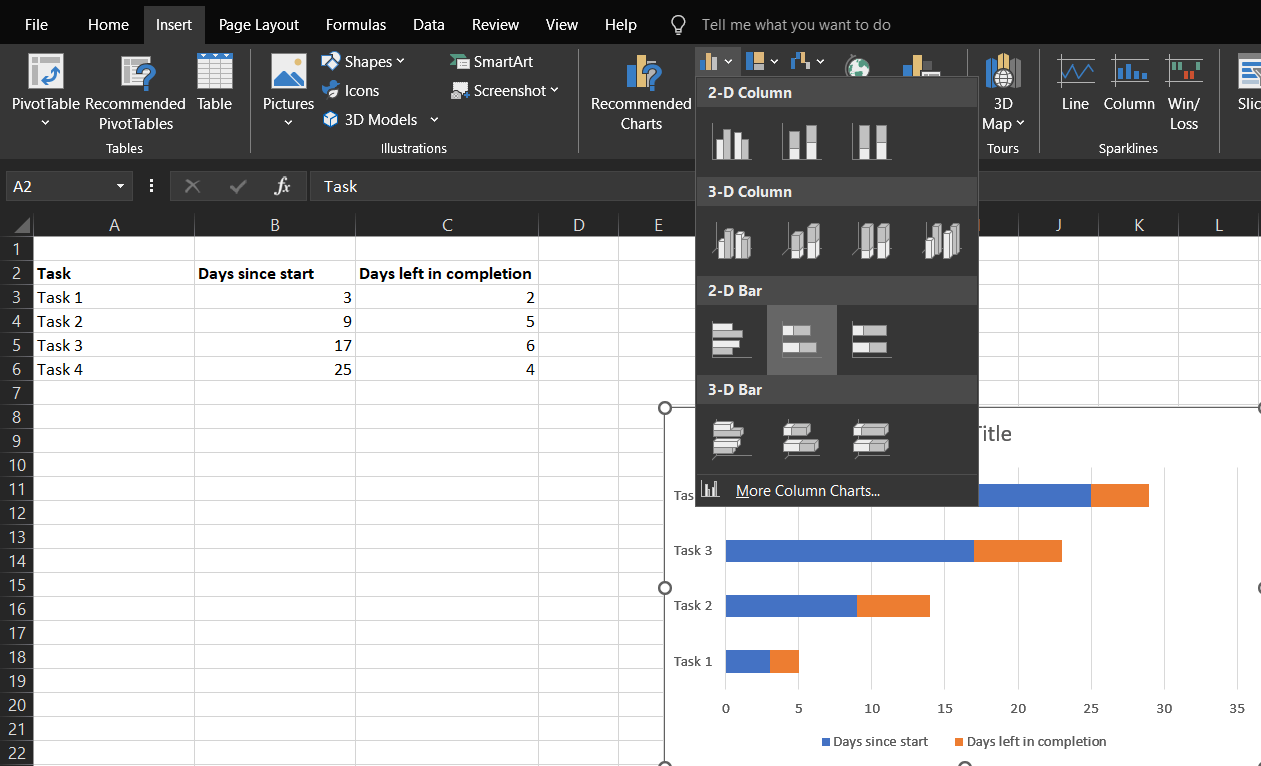
Step 2: Select the data range to create a chart and click Insert > Insert Bar Chart > Stacked Bar chart. The stacked bar chart is Excel’s closest option to a Gantt chart
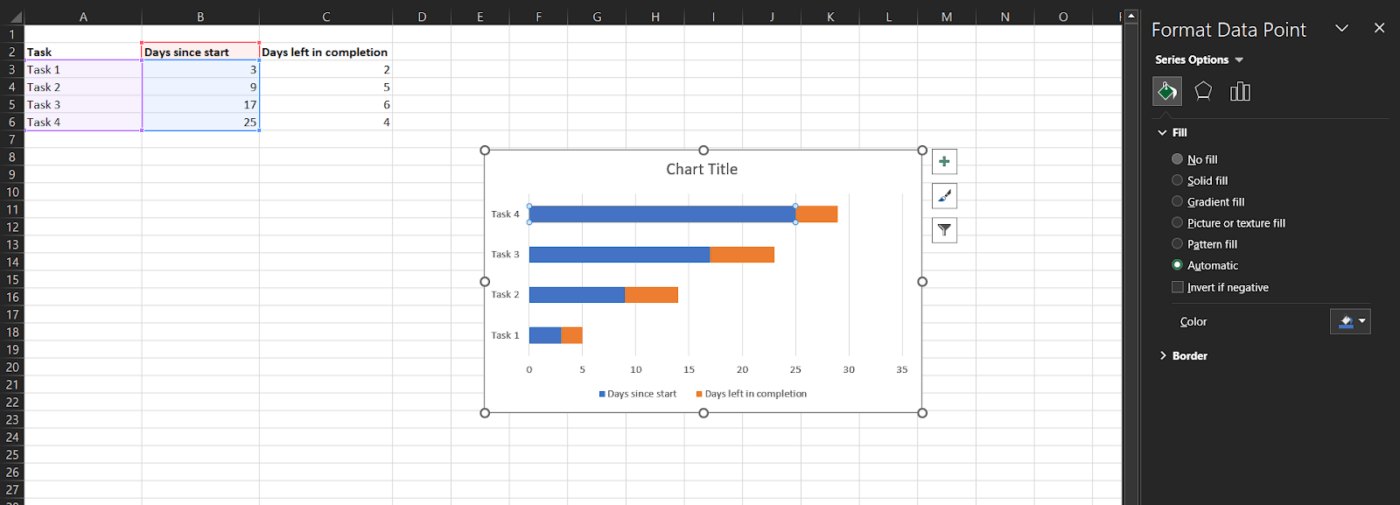
Step 3: Now, it’s time to customize the chart to make it more like a Gantt chart. Click the first data set (the blue section of the first bar). A Format Tab will open on the right. Click Shape Fill > No Fill
Step 4: Did you notice the chart shows the data range in reverse order? The final step corrects that. Press and hold the control key and select the vertical axis (task axis). Once again, the Format Tab will open on the right. Click Format Axis > Axis Position > Categories in reverse order
If you want to name your chart, double-click the box saying Chart Title and enter your title.
You can customize your chart further to include colors, select a different layout, and add elements such as labels and gridlines, among other things.
Tip: Save your customized graph as a Gantt chart project template for later use.
That was a lot of steps, wasn’t it?
There’s so much to do already; why spend time creating a Gantt chart?
That’s where a smarter solution comes in—ClickUp, a comprehensive project management software with built-in Gantt charts and timeline views that you don’t have to spend hours creating from scratch.
It lets you collaborate with contractors, employees, and clients to keep everyone on the same page. You no longer have to call the client to tell them the conference room will be ready in 2 days; they can view it on the Gantt chart directly.
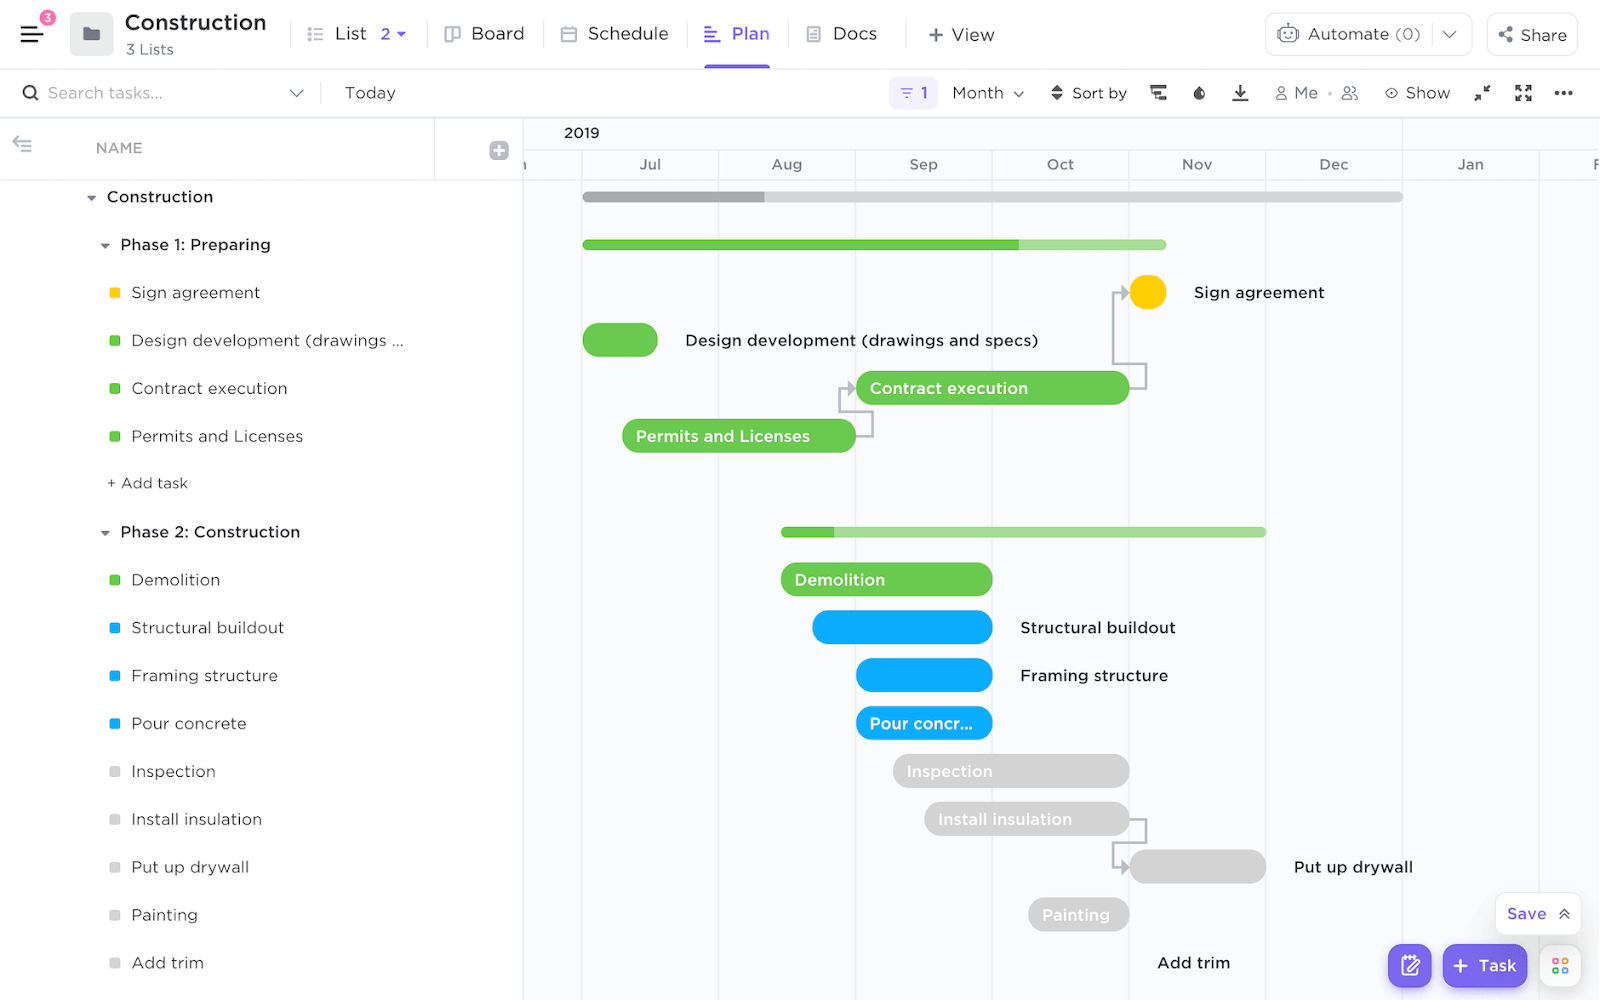
The ClickUp Gantt Chart Construction Management Template, for example, lets you hit the ground running with the basics already in place. All you have to do is fill in your data!
This template helps you:
If you’d rather not fill out the template and would like to create one independently, we’re here to help. Here’s how you can create a Gantt chart with project management tools like ClickUp:
Make a detailed project outline to cover all the details in your Gantt chart. Ensure it covers everything, from the smallest renovations to the construction of an entire office. You can use ClickUp Goals to simplify organizing them and even write down all your to-dos by creating a simple task checklist in ClickUp Docs.
Create a list of the construction project tasks. Use ClickUp’s Custom Fields option to enrich your chart with details such as phases, duration, and completion. Add start and due dates to track each task.
Tip: You can also add priorities and dependencies to the tasks to help your workers know if they must fix a kitchen change before beginning work in the drawing room.
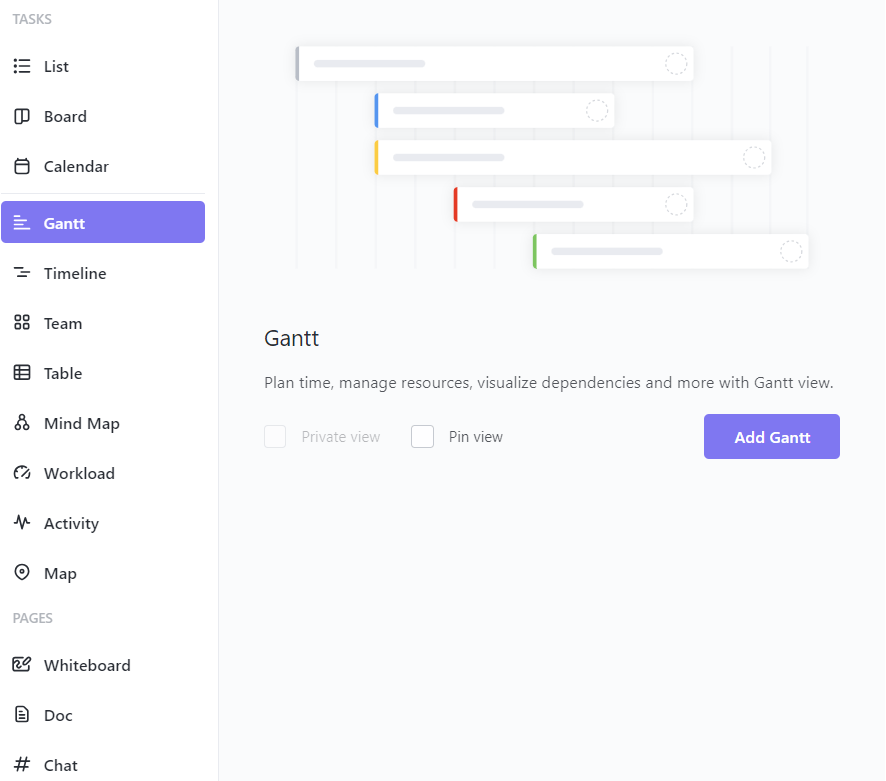
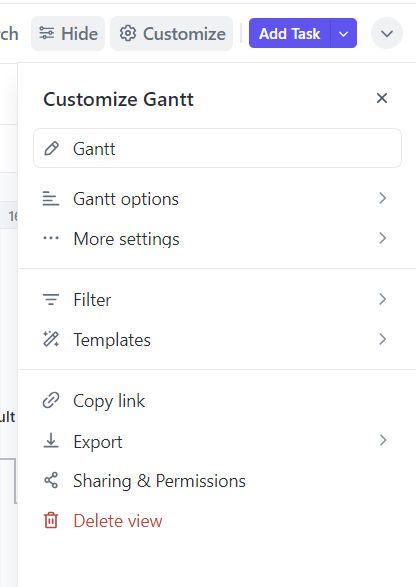
The best part is that you don’t have to manually create your Gantt chart at all. ClickUp’s Gantt Chart View directly provides you with a chart. Simply open the toolbar and click Gantt > Add Gantt.
The customization settings will appear on the right side of your Gantt chart. You can change the chart’s name, control its access settings, color tasks based on updates or categories, and set a timeframe you wish to examine.
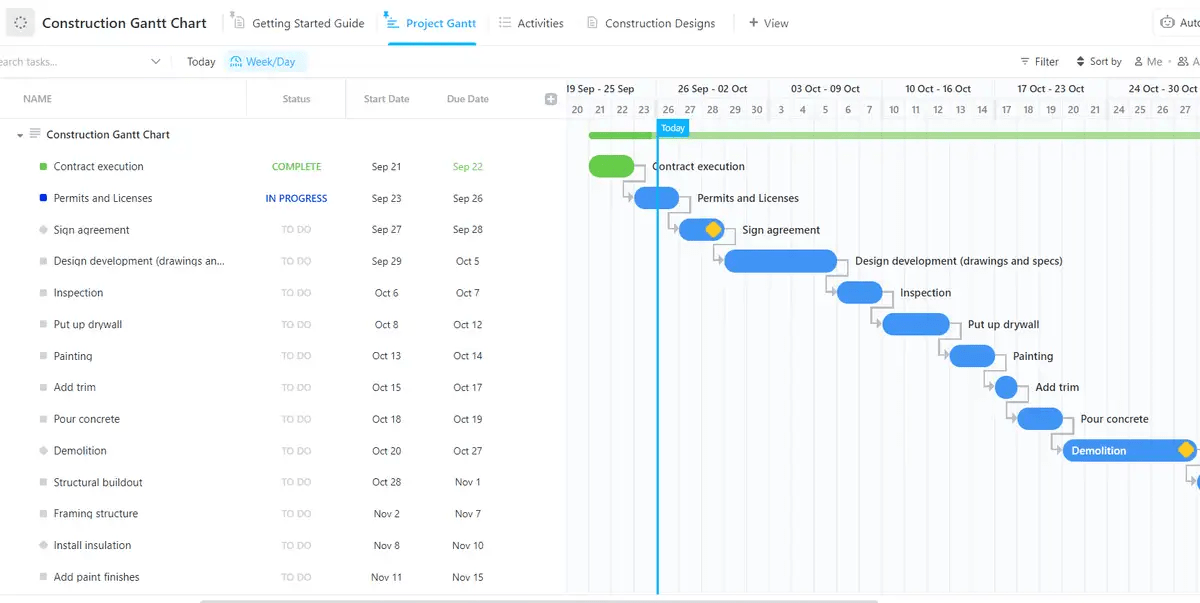
You can also use the ClickUp Construction Gantt Chart Template tailored to construction project management. This template allows you to minimize time spent managing your project deliverables and focus on more strategic tasks.
Here’s how this construction management template helps you keep the project on track:
ClickUp’s Construction Project Management Software facilitates seamless communication between field workers and the office. Team members can update tasks, share files, and collaborate on documents in real time, keeping everyone informed of progress and any arising issues.
ClickUp’s robust automation features can streamline repetitive tasks in construction projects. Automate workflows like sending notifications when a permit is approved or triggering the next phase of work when the previous one is completed, saving time and reducing errors.
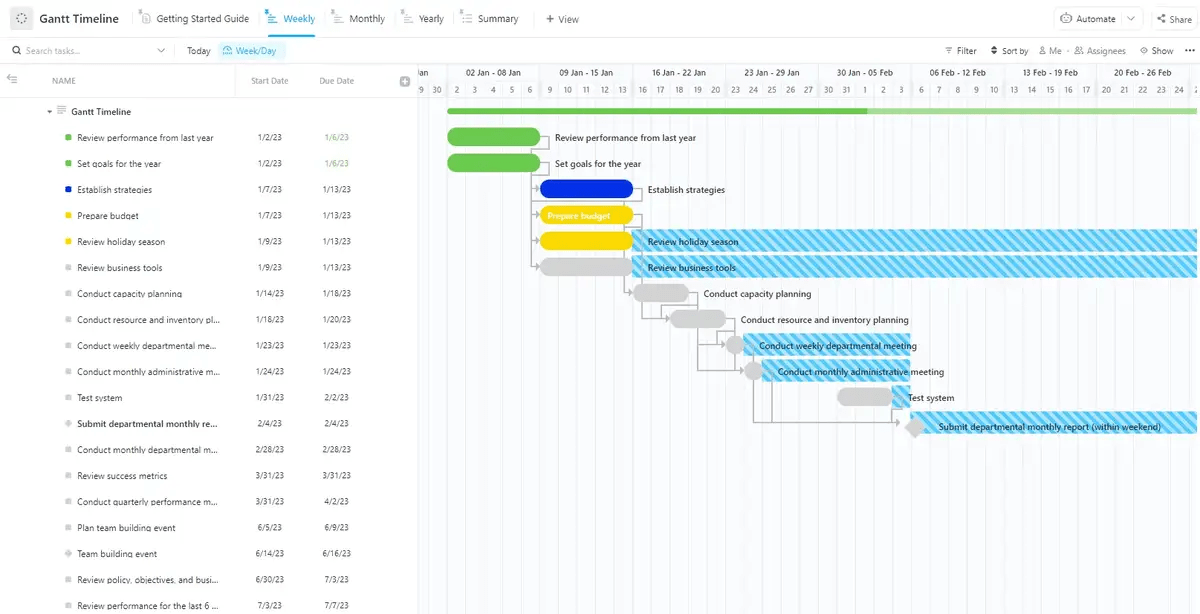
If you want to further enhance your scheduling and management skills, ClickUp’s Gantt Timeline Template is the right fit for you!
Here’s how this template can assist you:
Here’s what Jennifer Vollbrecht, PMP-certified Project Manager and Principal Consultant at JVC has to say about the ClickUp construction Gantt chart:
We use Gantt charts to highlight critical tasks and use a three-week lookahead to communicate upcoming milestones on our construction projects. Gantt Charts are a great way to visualize many moving parts and pieces during construction.
I send the Gantt chart out to all project stakeholders a few days prior to a status meeting so that it can be reviewed, and everyone comes to the meeting prepared to discuss their upcoming activities.
This is how ClickUp simplified the operations for JVC, and it can do the same for you!
Whether you follow a traditional waterfall methodology common in construction projects or a more back-and-forth agile approach, Gantt charts will fit in seamlessly into your workflow.
Waterfall project management is also understood as the linear form of management.
Here’s a linear construction project flow example:
Client Consultation → Designing → Design Aproval→ Project Planning and Resource Allocation → Permits and Approval → Execution → Monitoring → Handover
You can create tasks for each process and even divide them into small tasks, such as further classifying design into structural and architectural design.
The Gantt chart showcases the progress of each task and the utilization of resources. It lets you visualize this entire timeline and the progress of each task to see where you stand in the overall project.
An agile method involves a more back-and-forth approach that breaks the entire project into phases or sprints and focuses on continuous improvement.
This is what a typical agile project methodology in construction projects looks like:
Client Consultation →Designing →Development →Testing →Deployment →Review →Iteration
Testing or review is a frequent part of this methodology and occurs after every sprint. The Gantt charts in this methodology break down the project into different sprints and schedule testing after each one.
These charts are updated regularly to accommodate the feedback from each review round and create new tasks where necessary. Real-time communication and the sharing of updates assist businesses in executing a construction project using an agile management method.
Let’s look at the benefits and drawbacks of Gantt charts to help you assess their suitability in construction management.
Some positive effects of Gantt charts in construction project management include:
Gantt charts are not entirely immune to challenges. Here are some drawbacks that construction project managers often experience:
How to mitigate: Focus on the critical path (essential tasks) and break down projects into phases with separate charts for better understanding. Use clear legends and color-coding
How to mitigate: Leverage construction project management software like ClickUp for real-time updates and schedule regular reviews to catch changes early. Build buffer time for unexpected delays to avoid frequent adjustments
All in all, Gantt charts are the way to go for construction projects!
Construction project management can be tedious, but you can simplify your workflows by using Gantt charts.
They provide an overview of the entire project at once and showcase how far each subtask has progressed. This gives you insight into what’s happening now and how smooth the project completion is expected to be.
With the ClickUp Gantt chart project templates, you can create a comprehensive Gantt chart and tailor it to your needs. It also lets you collaborate with all stakeholders, track costs, accomplish milestones, and maximize efficiency in executing successful construction projects.
Sign up for ClickUp today to manage your next construction project.

© 2026 ClickUp

There’s an easier way. Try a free AI Agent in ClickUp that actually does the work for you—set up in minutes, save hours every week.