


Still downloading templates?
There’s an easier way. Try a free AI Agent in ClickUp that actually does the work for you—set up in minutes, save hours every week.
Sorry, there were no results found for “”
Sorry, there were no results found for “”
Sorry, there were no results found for “”

Weekly status reports are important, but let’s be honest, they can also eat up hours every week. Gathering updates, chasing team members for progress, formatting data, and turning it all into a clean report can feel like a whole new mini-project.
That’s where automation steps in. Tools like ClickUp offer easy-to-configure AI workflows that take the manual work out of reporting.
Instead of spending Fridays compiling notes and screenshots, you can have your updates automatically organized, summarized, and shared—ready before you even think about it.
In this post, we’ll walk through how to automate weekly status reports with AI, generate clear summaries, and save several hours every week—without sacrificing visibility or quality.
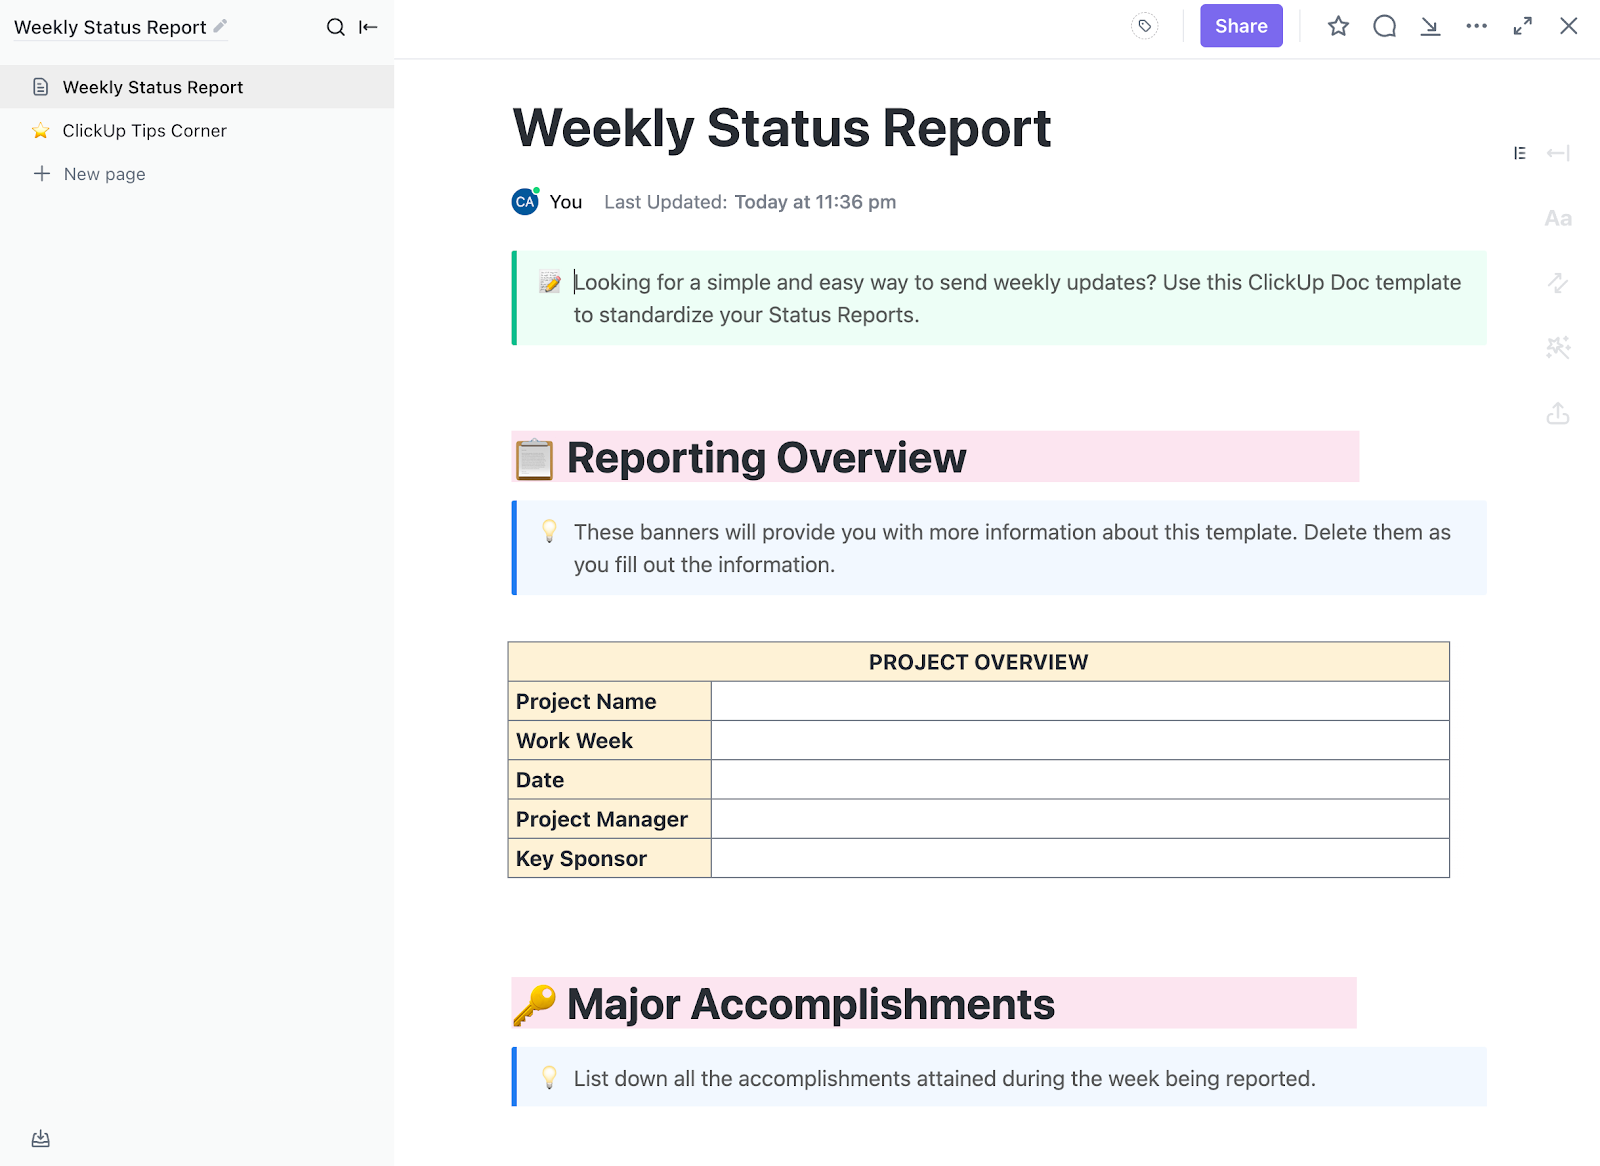
The ClickUp Weekly Status Report Template gives you pre-built sections for completed tasks, in-progress work, and blockers—so you’re not starting from scratch to give a report to your leadership. It connects directly to your actual tasks and projects, meaning progress updates pull from real data instead of relying on memory or manual updates.
Creating custom status reports manually can take 4-8 hours every week. Sometimes even more. This includes time spent gathering data from various tools, asking for updates from teams, creating visual charts, and formatting. These manual processes leave you little time for analysis and strategic thinking.
Well, managers across leading firms have automated their reporting process, and here’s why you should too:
💡 Did You Know: Nearly 95% of decision-makers at leading firms report cost reductions and time savings by automating processes using AI. This means when you automate your status reports, you’re implementing a strategy that’s already working for nearly every organization that’s tried it.
Weekly status reporting typically involves time spent in data collection, analysis, and distribution. AI streamlines these repetitive tasks by automating the core components of status reporting, without compromising on insights or accuracy.
Here’s a detailed overview of reporting aspects you can automate with AI:
| Key automation aspect | What can AI automate? |
| Data collection and integration | AI automates the process of pulling data from multiple platforms, cleans inconsistencies, and builds a structured, analysis-ready data layer (that updates in real-time) |
| Content generation and analysis | AI can analyze data and write a report summarizing insights about task progress, team updates, milestones, blockers, and performance in easy-to-understand (decision-enabling) language |
| Visual elements | AI can quickly create and update stakeholder-specific reports (with charts and graphs) based on key metrics such as task completion, project health, and key performance indicators (KPIs) |
| Distributing and scheduling | Ai can quickly create and update stakeholder-specific reports (with charts and graphs) based on key metrics such as task completion, project health, and key performance indicators (KPIs) |
📖 Read More: How to Leverage AI with Real-Time Data Insights
Let’s now understand how you can turn your manual reporting process into an automated system using AI.
Most organizations store project information across multiple platforms, which leads to siloed data. For AI to effectively automate project status reports, you first need a unified place that integrates all your data in real-time.
That’s where ClickUp comes in. It is the world’s first Converged AI Workspace, bringing together all work apps, data, and workflows.
ClickUp eliminates all forms of Work Sprawl to provide 100% context and a single place for humans and agents to work together. No more tool hopping or hunting for context across chat, work management systems, and email.
For instance, ClickUp’s Sales Software provides an extensive framework for all types of teams to centralize their project data. It makes data consolidation seamless while integrating with your existing tech stack through 1000+ integrations.
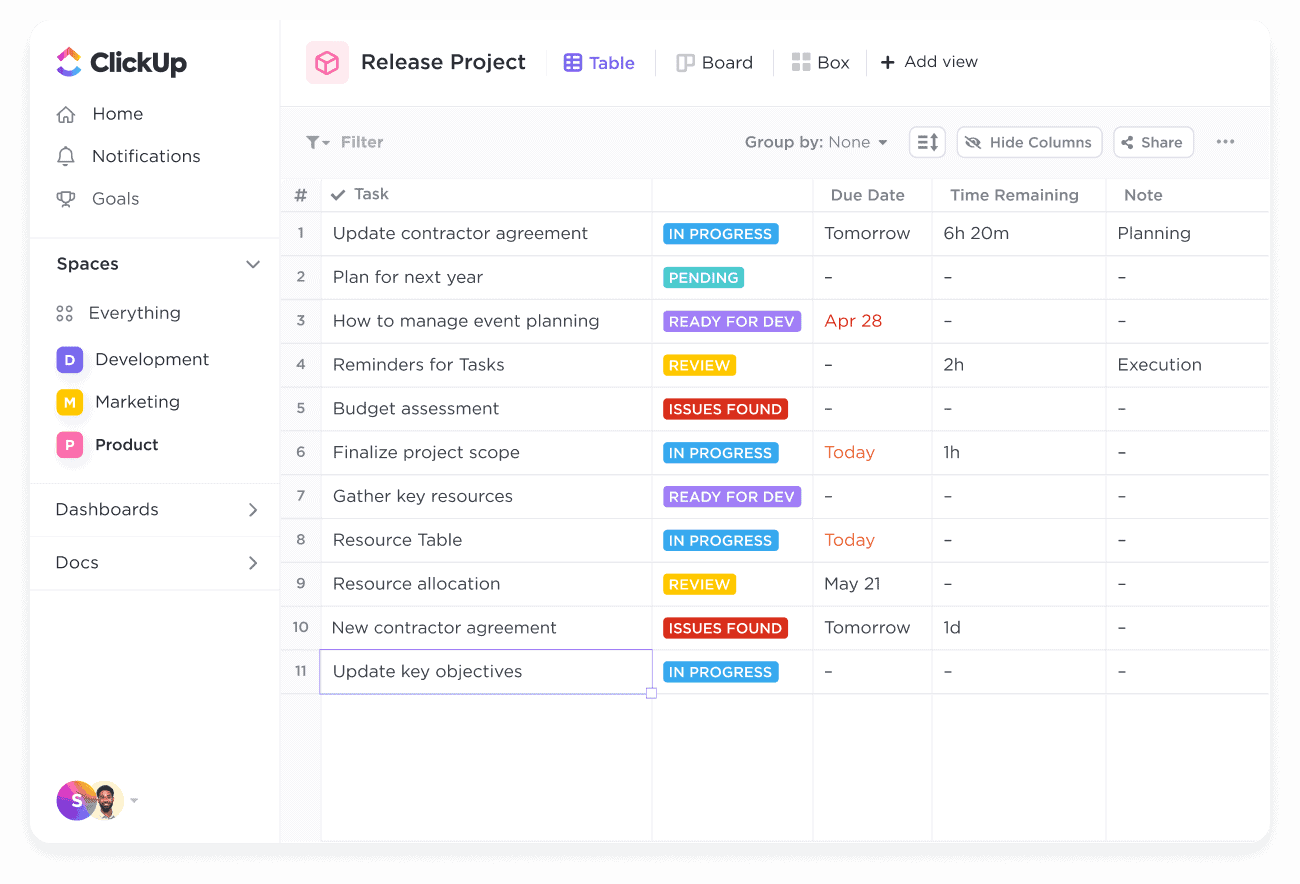
You can visualize your pipeline in 15+ Custom Views (i.e., Kanban, List, and Gantt) to efficiently track and manage the sales pipeline.
With this framework, you can also:
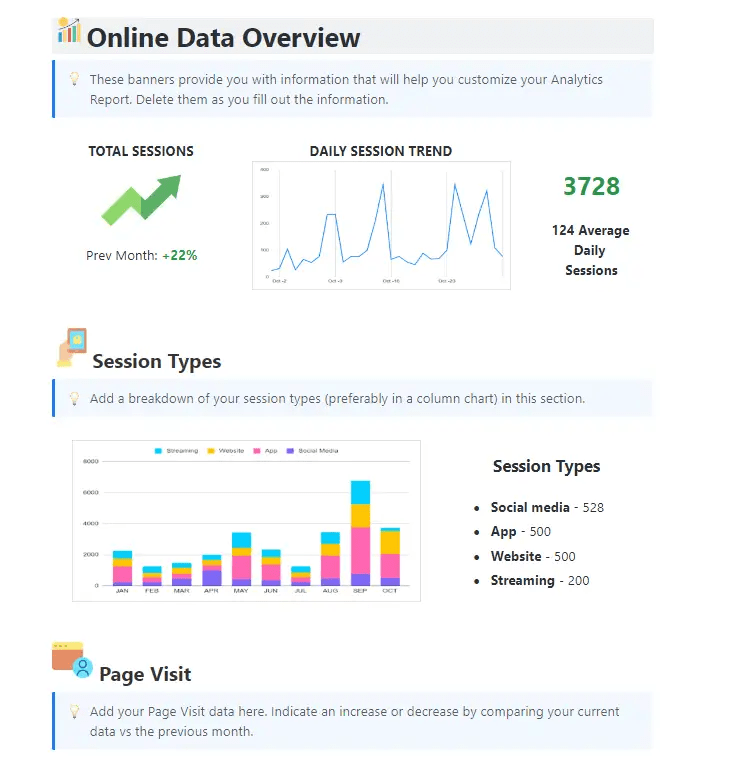
Now, standardize a structure that you would use for your weekly reports. The easiest way is to use pre-built templates, like the ClickUp Analytics Report Template.
This template comes with pre-configured custom Fields and a built-in structure that offers a blueprint of your weekly status report. The template is fully customizable, allowing you to add more data fields, integrate new data sources, and adjust the report structure to suit your team’s needs.
The analysis template includes pre-configured sections for:
🧠 Did You Know: Nearly 90% of employees (actively using AI) trust automation solutions to help them make speedy and informed decisions for driving project success.
Now, you need an AI automation tool that aligns with your reporting needs and integrates seamlessly with your existing tech stack.
Ideally, this tool should be able to analyze your heavy database with core features such as:
| Core feature | What should the Ai tool include? |
| Data integrations | The AI tool must connect (integrate) seamlessly with your data sources and delivery channels |
| Natural Language Processing (NLP) | It should be able to convert complex data into human-readable summaries and insights |
| Advanced customization | It should allow template modifications to align with brand elements |
| Real-time data processing | The AI tool must plug real-time insights from your data without requiring a manual refresh? |
| Collaboration | It should facilitate communication with team members? |
ClickUp’s native AI, ClickUp Brain is integrated perfectly with your connected works ecosystem. Meaning it has complete context of what happens inside your organization. This is a stark deviation from external AI tools that only see fragments of data and need to managed separately.
Ask Brain to create a weekly standup for the marketing team, and it will automatically pull data from your ClickUp Docs, chat discussions, task updates, and your integrated tools. You don’t need to do any of that yourself.
Then, it will write a report covering progress summaries, including details about task completions and upcoming deadlines, (and anything else you ask for), in your desired format.
See it in action here:
Here are a few more ways to use ClickUp Brain as your AI assistant for ongoing activities:
💡Pro Tip: ClickUp Brain now also allows users to choose from multiple external AI models, including GPT, Claude, and Gemini. Users can write, reason, or perform coding tasks right within their ClickUp platform, without having to juggle between different AI tools.
Once your data is configured with an AI tool, you define the rule-based automation necessary to automate the process. Automation triggers will determine when and how your AI tool will generate reports without human intervention.
Here’s how to set up your triggers and schedules effectively:
You can set up automations based on task completions, status changes, due dates, or time-based schedules with ClickUp Automations. These triggers can automatically initiate your end-to-end reporting workflows with minimal setup.
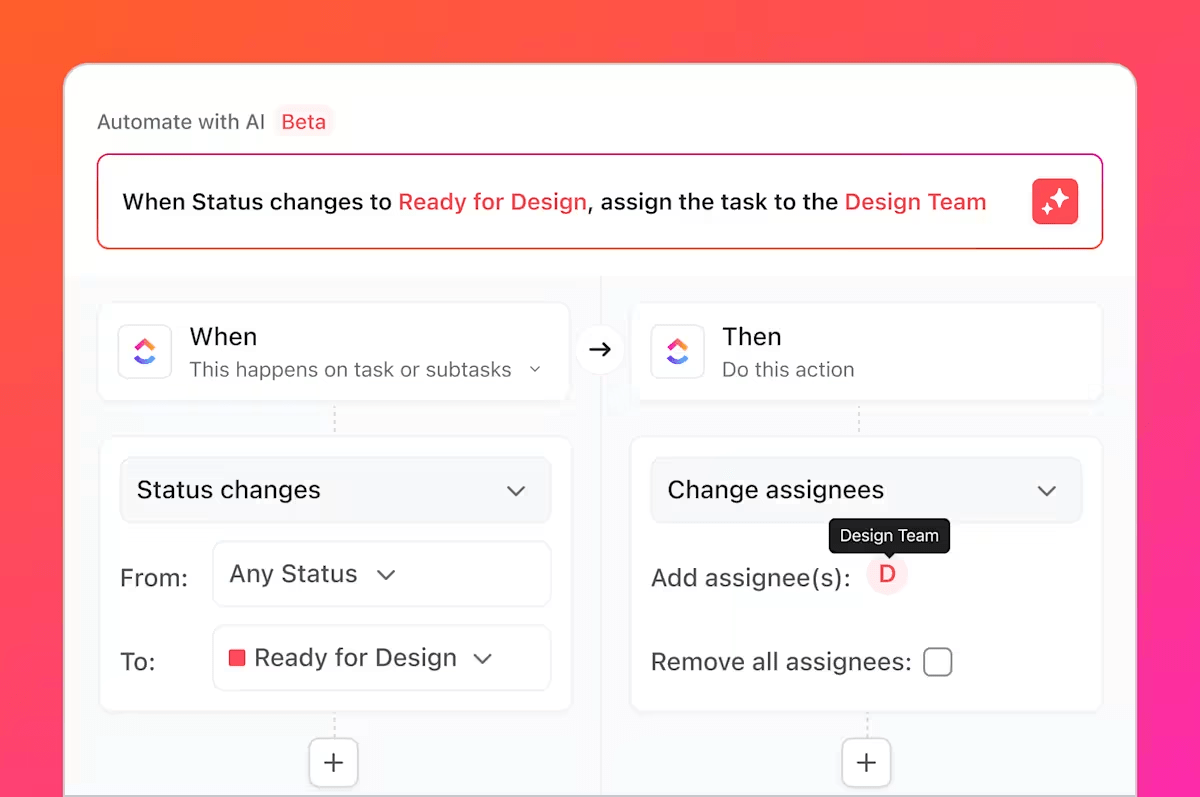
You can also ask ClickUp Brain to create an automation you need in simple English.
For instance, you could say ‘Send a weekly project summary to stakeholders every Friday at 3 PM’ or ‘Notify the team when budget utilization exceeds 80%’—and Brain will instantly configure the automation for you.
📚 Read More: How to Use AI to Automate Tasks
Put the system to the test and see if it generates a report in your desired format without data hallucination. This iterative process will outline gaps and suggest areas for improvement, so that your status reports can meet the expectations of stakeholders efficiently.
Here’s a testing checklist you can implement while testing your AI-generated weekly status reports:
After analyzing the improvement opportunities, adjust your data parameters and update the formatting to make them even more impactful.
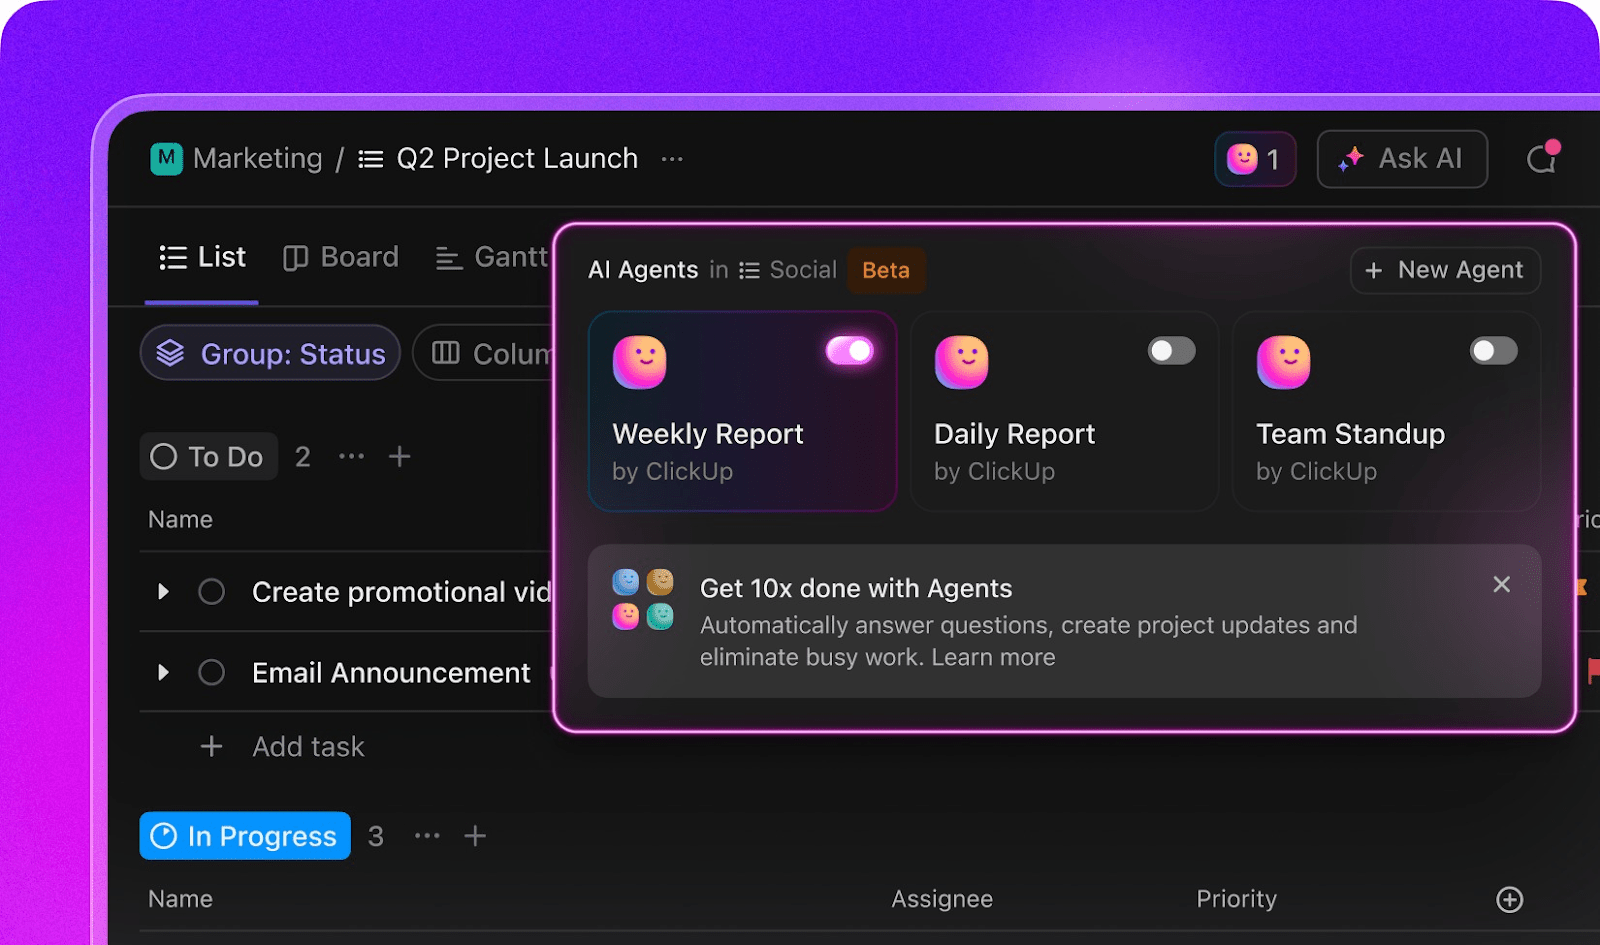
If your project data and dashboards are solid, and you want to automate report generation end-to-end without running checks, try ClickUp Agents. ClickUp Agents can provide weekly reports using Prebuilt Agents, which are easy to set up in any Space, Folder, or List.
Here’s how it works:
You can also create Custom Agents for more tailored reporting needs. Watch this video to learn more:
📚 Learn how to set up your first agent:
Set an effective distribution strategy so that your automated reports reach the right people at the right time in accessible formats.
Here’s how to manage this process effectively:
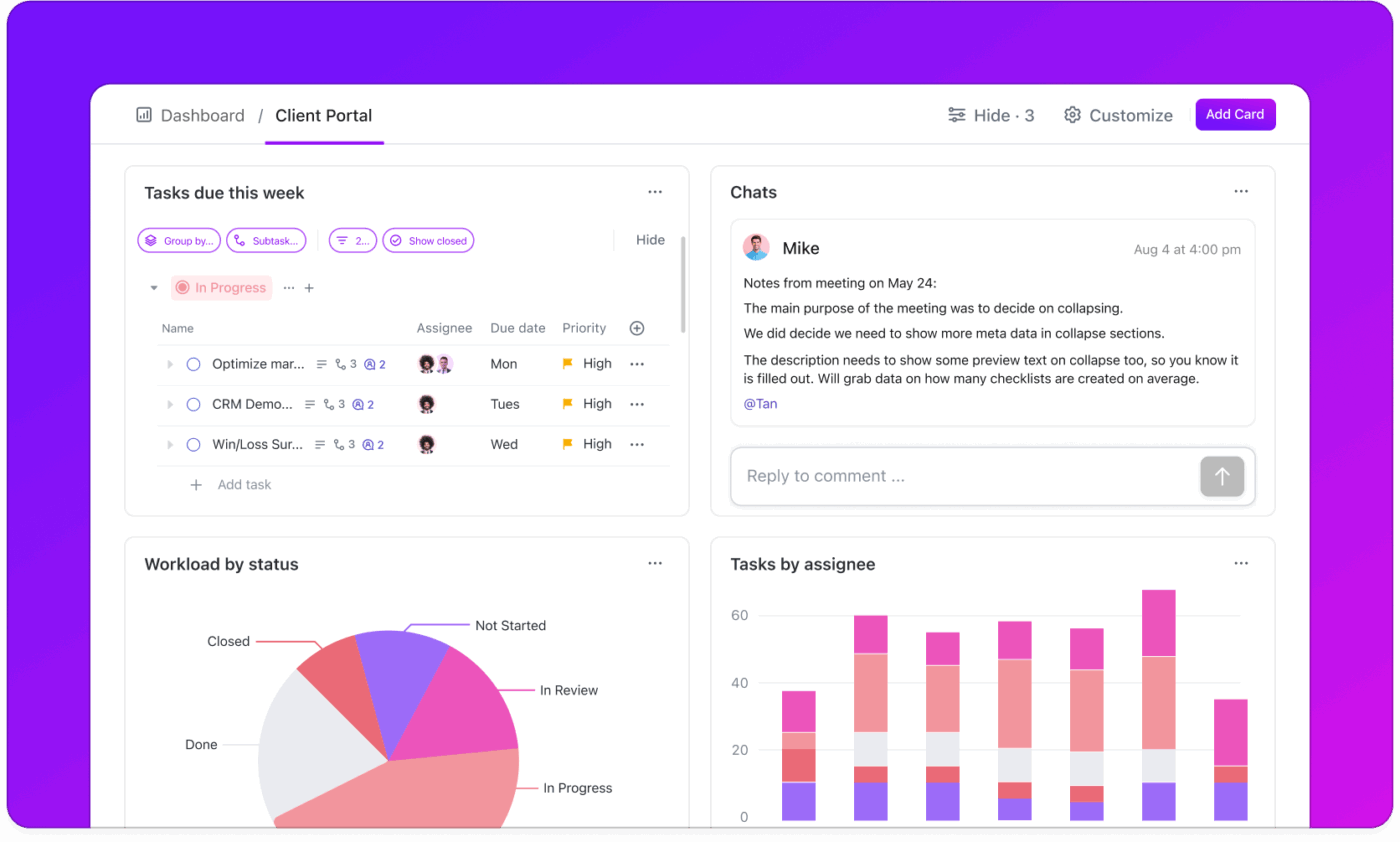
Or, you can make things even simpler by turning to ClickUp Dashboards and share it with your stakeholders using a private link. You can automate this too! These dashboards update in real-time, so stakeholders always see the most current project status.
Here’s how you can use Dashboards to streamline your weekly status reporting:
ClickUp transforms weekly status reporting from a time-consuming manual task into an automated workflow that provides timely, accurate, and comprehensive project insights.
💡 Bonus: BrainGPT, ClickUp’s AI-powered desktop companion, can help you create weekly reports quickly and efficiently. Here’s how BrainGPT can assist with weekly reports:
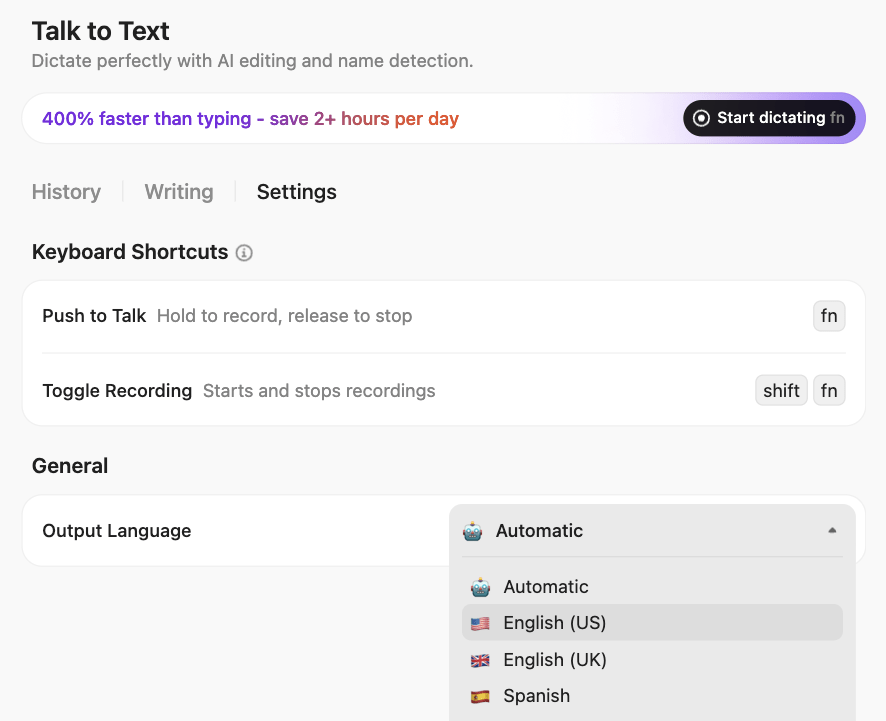
BrainGPT truly understands you, because it knows your work. So ditch the AI tool sprawl, use your voice to get work done, create documents, assign tasks to team members, and more.
Our editorial team follows a transparent, research-backed, and vendor-neutral process, so you can trust that our recommendations are based on real product value.
Here’s a detailed rundown of how we review software at ClickUp.
There are various AI-powered report generators to streamline different aspects of status reporting.
While some excel in visual design, others excel in content generation, and some of them support end-to-end report automation. Let’s walk you through our top picks:
| Tool | Category | AI Features | Best use cases |
| ClickUp | All-in-one unified workspace | ClickUp Brain, AI agents, Automations, unified search | End-to-end project reporting, team collaboration, integrated workflow automation |
| Venngage | Visual design | AI report generator, data visualization | Professional visual reports, data visualization, stakeholder presentations |
| Piktochart AI | Visual design | Design automation, chart generation | Business reports, survey results, financial summaries, data-driven presentations |
| Texta AI | Content generation | Report templates, evidence-based content, multilingual support, SEO optimization | Content-heavy status updates, multilingual reporting, research-backed documentation |
| Easy Peasy AI | Content generation | Project report generator, automated formatting | Quick report generation, standardized formats, project milestone tracking |
| Power BI | Business intelligence | Q&A natural language queries, AI insights, Copilot integration, anomaly detection | Enterprise dashboards, financial reporting, KPI tracking, executive summaries |
| Tableau | Data visualization | Ask Data, Tableau Pulse | Complex data visualization, interactive dashboards |
| Zapier+ Claude | Workflow automation | Zapier Agents, Claude integration | Cross-platform automation, custom reporting workflows, API integrations |
Even with the best AI tools, automated reporting can fail if you overlook critical implementation details.
Here are the most common pitfalls that derail weekly status report automation:
❌ Mistake: When you use multiple systems at work, there are higher chances of data inconsistencies. If you don’t comb through duplicate entries and formatting conflicts (a massive time sink!), you risk building reports on wrong, manipulative data.
✅ Solution: Set up quality checks before AI processes your data. Standardize data formats across platforms and configure rules to catch duplicate entries. Before automating, validate the flagged inconsistencies through manual review.
❌ Mistake: Building automation without involving end users makes your automation process inefficient. You may automate reports that don’t align with how stakeholders actually make decisions, or you overlook critical steps in their review process that cause delays and confusion when the automated reports arrive.
✅ Solution: Involve key stakeholders in defining the report structure during the setup. Test sample automated reports with different stakeholder groups and adjust based on their feedback before going live.
❌ Mistake: AI is great at data processing. But when it comes to insights, you can’t entirely rely on AI. Especially so if the AI doesn’t have contextual understanding of your work, communication, and business knowledge. For instance, AI may flag a report with a budget variance that might actually be normal for your industry.
✅ Solution: Get a fully context-rich tool like ClickUp and set up an Weekly Status Report Agent with strict instructions to benchmark insights to market data. In addition, add a human in the loop to review automated reports regularly to catch edge cases and data anomalies that AI might miss.
❌ Mistake: If your report automation tool doesn’t integrate with your existing tech stack, even its most brilliant features may become useless. Instead of saving time, you would be stuck manually exporting data from one system and importing it into another.
✅ Solution: Test integrations with real data before committing to any AI tool. Verify that information flows automatically between your current systems and the new automation platform.
❌ Mistake: If you plan to set automation and never revisit it, your reports will become less useful over time. Automation demands change as team structures shift and businesses’ needs change.
✅ Solution: Collect feedback on early reports and refine your automation rules and formatting based on real usage patterns
📮 ClickUp Insight: 45% of workers have thought about using automation, but haven’t taken the leap.
Factors like limited time, uncertainty about the best tools, and overwhelming choices can hold people back from taking the first step toward automation.
⚒️ With its easy-to-build AI agents and natural language-based commands, ClickUp makes it easy to get started with automations. From auto-assigning tasks to AI-generated project summaries, you can unlock powerful automation and even build custom AI agents in minutes—minus the learning curve.
💫 Real Results: QubicaAMF cut reporting time by 40% using ClickUp’s dynamic dashboards and automated charts, transforming hours of manual work into real-time insights.
AI tools have transformed the way project managers approach status reports.
What once required hours of data gathering and formatting can now be completed in minutes through automated generation.
While most AI tools operate in isolation, true reporting automation happens when your AI connects directly to live project data, team updates, and stakeholder communications.
ClickUp delivers exactly this by integrating all your work into one workspace and providing comprehensive automation capabilities with ClickUp Brain.
Sign up for free today and automate your reporting process with ClickUp.

© 2026 ClickUp

There’s an easier way. Try a free AI Agent in ClickUp that actually does the work for you—set up in minutes, save hours every week.