


Still downloading templates?
There’s an easier way. Try a free AI Agent in ClickUp that actually does the work for you—set up in minutes, save hours every week.
Sorry, there were no results found for “”
Sorry, there were no results found for “”
Sorry, there were no results found for “”


My best friend hardly reads something that doesn’t include pictures.
But why am I telling you this? Because it’s not just her. People can process an image in just 13 milliseconds, whereas words take a lot longer.
Humans understand meaning better when a combination of text and illustrations is used. So, if you’re looking for ways to capture the interest of your audience, diagram makers are a solid option.
I researched the best AI tools for mind mapping and workflow automation you can use to create online diagrams and infographics. This blog post details my findings.
Keep reading; you might find the best mind-mapping software for your business.
Consider these diagram makers to create your next flowchart, process map, network diagram, or visualize other workflows:
It’s easy to differentiate between a good online diagram maker and an average one. You just have to look for these key features:
🧠 Fun Fact: The concept of flowcharts, one of the most common types of diagrams, dates back to the early 1920s and was first used by engineers Frank and Lillian Gilbreth to improve industrial processes.
Now that we know what to look for, let’s explore the 10 best online diagram makers so that you can create stunning diagrams that catch everyone’s attention!
ClickUp is an everything app for work that helps you manage projects, communicate, and collaborate—everything in a single space.
ClickUp Whiteboards and ClickUp Mind Maps are the diagramming duo your team needs to go from ‘What if?’ to ‘Done!’ in record time. With Whiteboards, you can brainstorm freely, sketch ideas, drag and drop elements like shapes, text, connectors, etc.
The greatest advantage? You can link ideas brainstormed in a whiteboarding session directly to Tasks in ClickUp, making them much easier to execute.
Meanwhile, Mind Maps are your go-to for organizing thoughts and mapping connections, whether you’re plotting workflows for a product launch or figuring out how to survive Monday. Both tools are meant for real-time collaboration, so everyone can contribute their genius from anywhere.

With these handy solutions, customizable project management features, and AI capabilities, ClickUp has the potential to become your go-to visual project management tool.
📮ClickUp Insight: 92% of workers use inconsistent methods to track action items, which results in missed decisions and delayed execution. Whether you’re sending follow-up notes or using spreadsheets, the process is often scattered and inefficient.
ClickUp’s Task Management Solution ensures seamless conversion of conversations into tasks—so your team can act fast and stay aligned.
💡 Pro Tip: The ClickUp Relationships feature can complement your diagrams by connecting tasks, documents, or dependencies across projects. Use this to visually represent how different elements in your workflow are interlinked, enhancing clarity and organization.
ClickUp has made asynchronous alignment much simpler and more effective. By building a framework in which to outline and structure objectives and results, remote teams are able to understand expectations and provide status updates fluidly. Brainstorming with whiteboards is easy, reorganizing priorities is easy, and adding reference images, etc., is all very fluid.
Also Read: Best Digital Whiteboard Software Programs
If you’re looking for a diagram maker that helps you map concepts in a clear, organized manner without distractions, Lucidchart is a great choice. It’s known for its clean, structured interface, which makes it ideal for creating flowcharts, business process models, and IT diagrams.
The diagram tool allows real-time collaboration, so teams can collaborate, make updates instantly, and ensure everything is aligned. It’s easy to integrate with tools like Google Workspace and Microsoft Office 365, making it work for teams using those platforms.
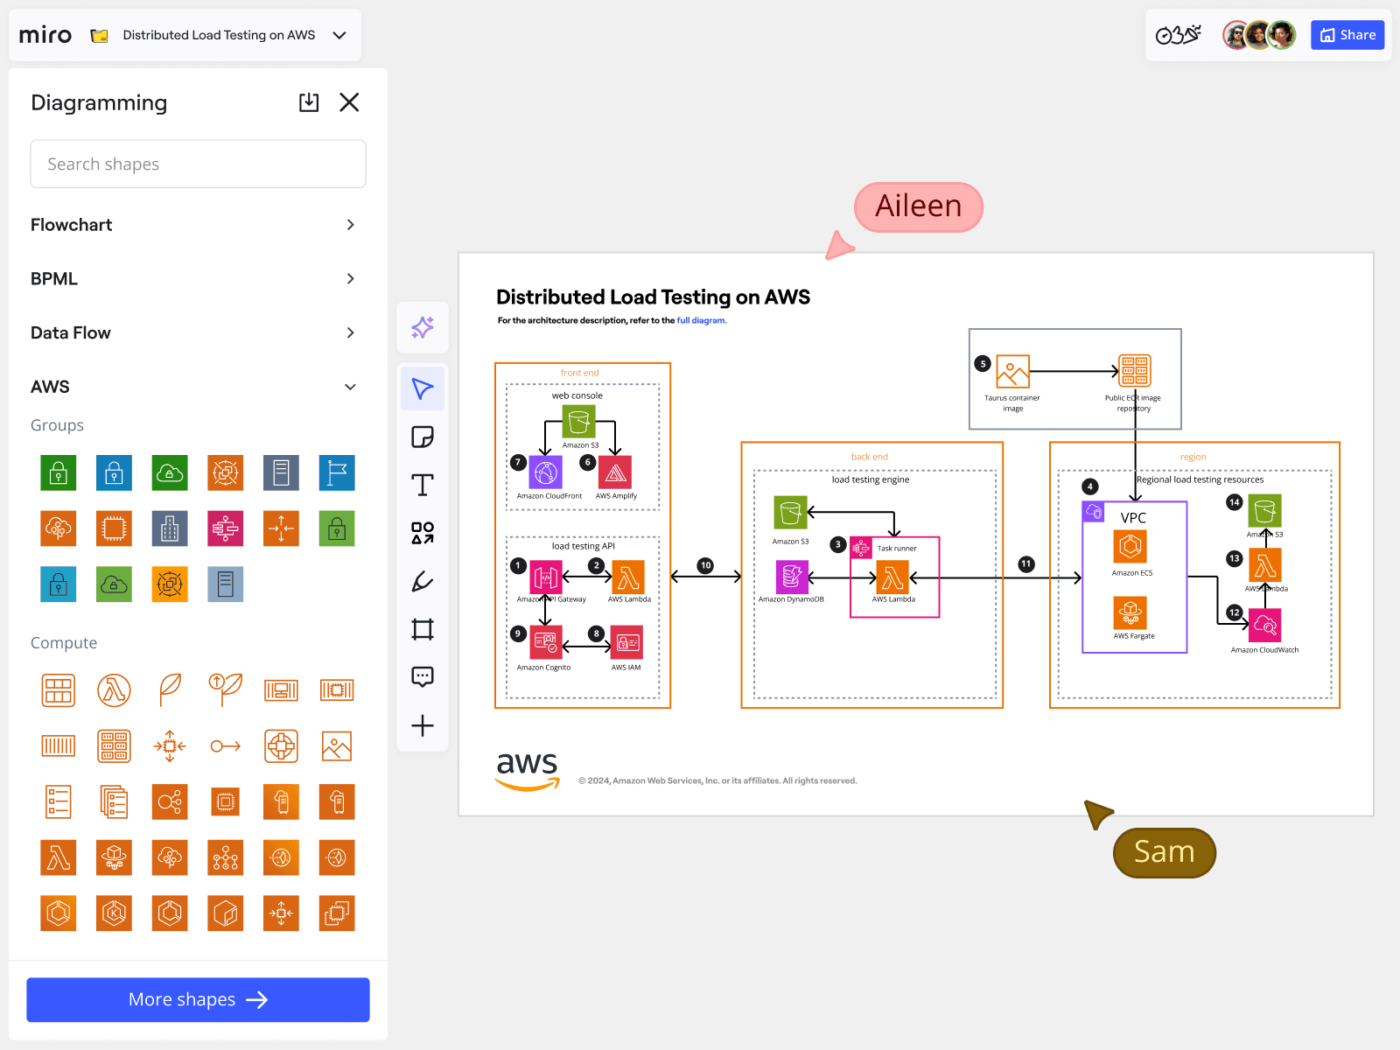
Miro embraces flexibility, allowing teams to sketch, brainstorm, and iterate on ideas easily. It is the ultimate collaboration board for teams that thrive on brainstorming and creative problem-solving. Whether you’re creating a mind map, building a customer journey, or laying out a product roadmap, Miro’s infinitely blank canvas lets you do it all.
It’s suitable for brainstorming sessions and workshops, allowing remote teams to contribute simultaneously with sticky notes, comments, and drawings.
I think Miro’s endless canvas is its strongest suit because it allows users to quickly and easily turn their thoughts into eye-catching visuals. The canvas is an enormous creative playground that may accommodate endless brainstorming sessions, mind mapping, and team projects.
Also Read: Mind-Blowing Mind Map Examples

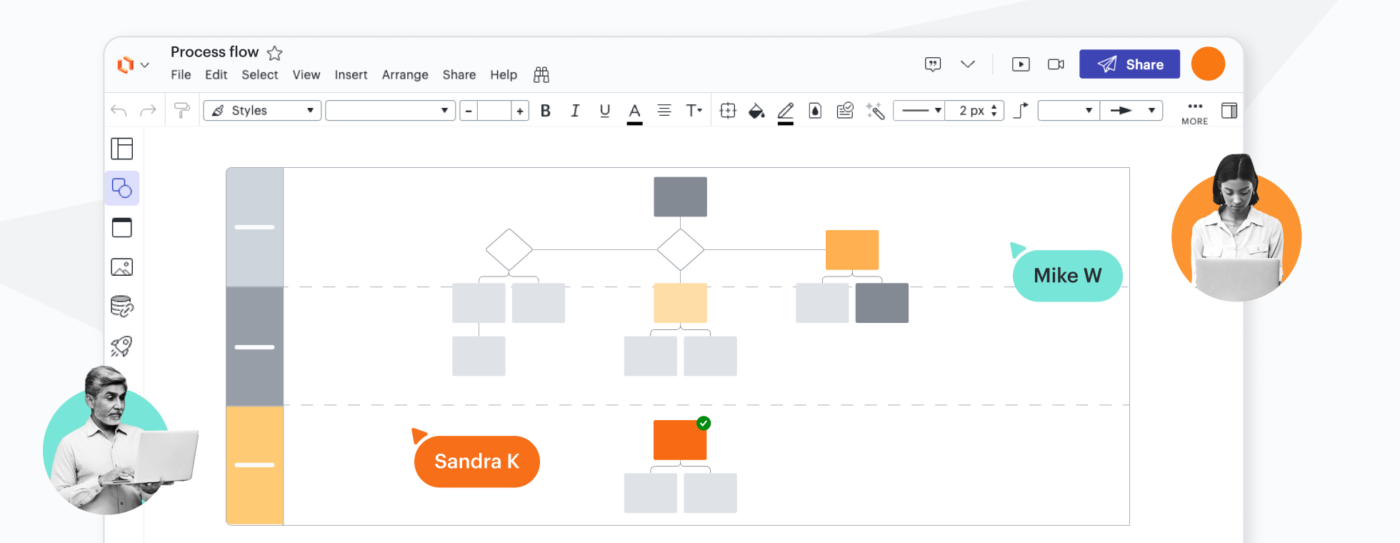
You’re kicking off a new project and need to visualize processes, but traditional diagramming tools feel clunky and time-consuming. Creately strikes the right balance between simplicity and functionality.
This diagram design tool offers a user-friendly interface with various pre-built templates to create diagrams. Its real-time collaboration and drag-and-drop features make it easy for teams to work together and iterate on projects quickly.

While known for its graphic design prowess, Canva is also a surprisingly versatile diagramming tool. Its easy-to-use drag-and-drop interface makes it perfect for creating stunning visuals, simple flowcharts, mind maps, and other different diagram types.
Canva stands out for its aesthetic appeal, offering a wide range of stylish paid and free diagram templates, colors, and fonts that make your diagrams pop. Its built-in AI features are also helpful when you’re short on time and want to finish diagramming faster.
While we have an in-house graphics team, it’s great to be able to work with their assets in a tool that doesn’t require a graphic design background. CANVA IS THAT TOOL. Marketing, customer success, and customer education teams all use Canva here – across dozens of use cases. There isn’t a single use case we haven’t been able to use Canva for.
Also Read: Top Free Concept Map Makers & Software

SmartDraw can be used as flowchart software to create network diagrams or organizational charts. Its auto-formatting feature ensures that your diagrams look professional with minimal effort.
It integrates seamlessly with Microsoft Office and Google Workspace, allowing you to import and export diagrams without skipping a beat.
💡Pro Tip: The key to creating an effective pie chart is to limit it to 5-7 slices and order them from largest to smallest, starting at the top. This ensures the data is clear, visually balanced, and easy to understand!
From wireframes to interactive prototypes, Figma empowers teams to design and visualize digital products easily.
Team members can brainstorm, design, and give feedback all within the same file, no matter where they are. Figma’s vector editing and component-based design make it ideal for creating sleek, scalable diagram types.
While it’s not built specifically for traditional business process diagrams, Figma’s ability to handle complex design systems and interactive wireframes makes it suitable for anyone working on a digital product.
We do quite literally all of our design work in Figma, and it has been a game-changer. First off, the collaboration is top-notch. Multiple team members working on the same file in real time is perfect for brainstorming and iteration. It is an intuitive interface; the tools are both very powerful and easy to use whether wireframing, prototyping, or designing the finals. Being able to share designs instantly and get feedback right there saves so much time and keeps everyone on the same page.

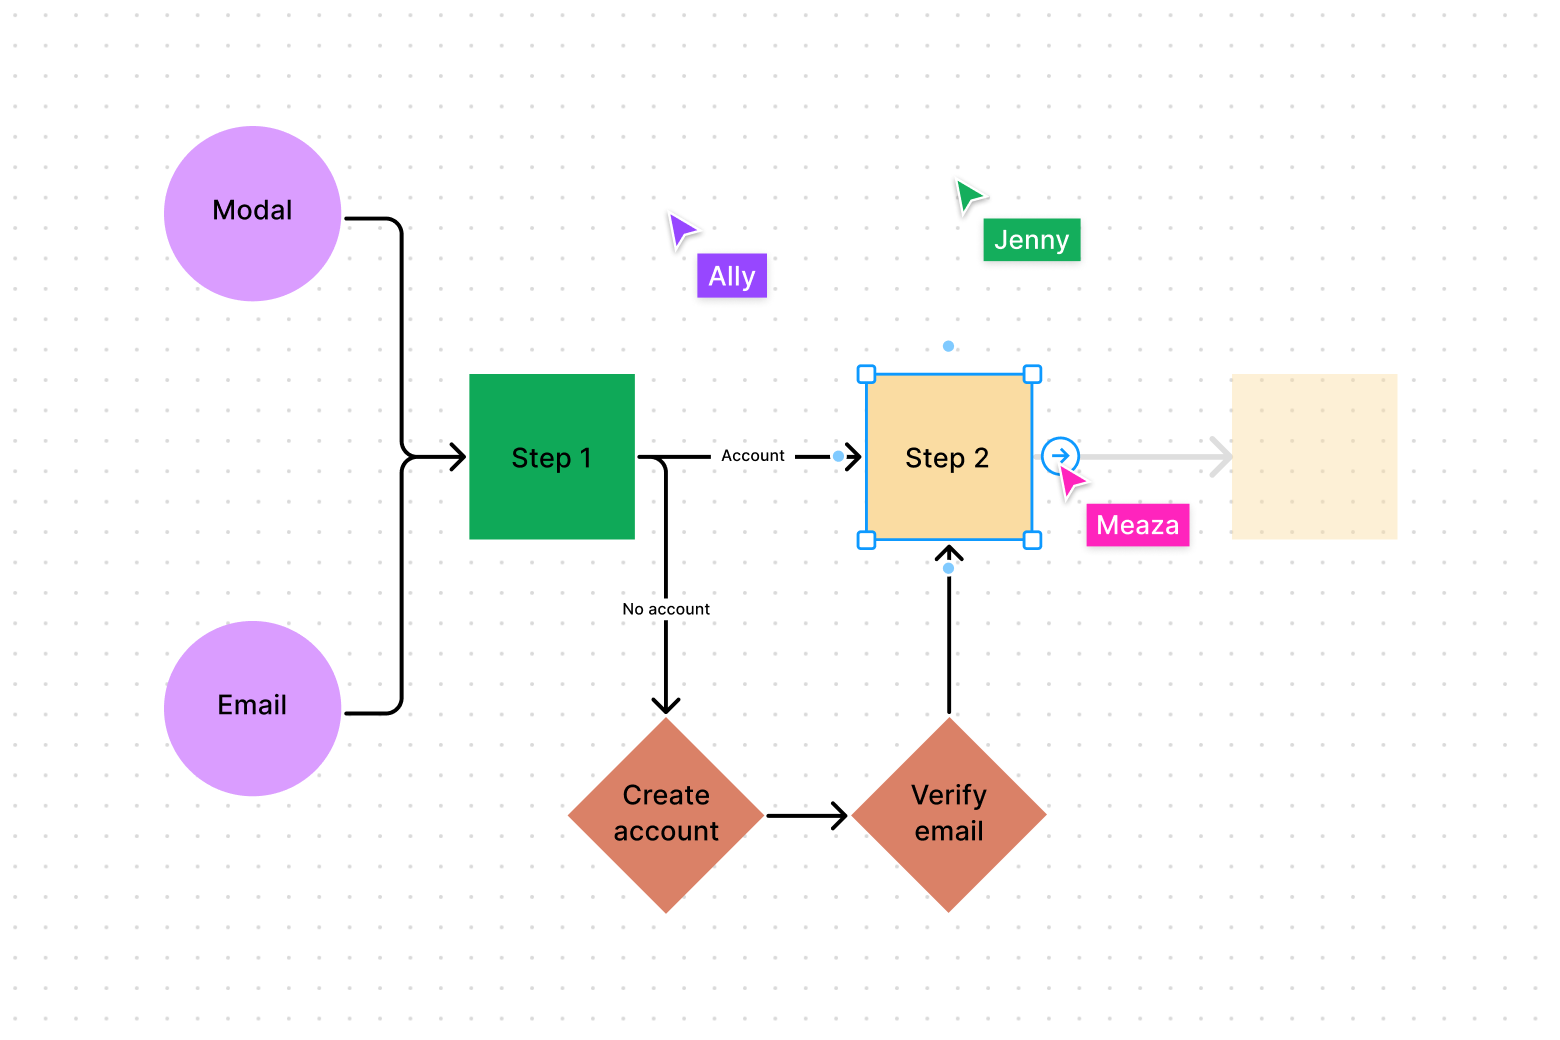
Diagrams.net (formerly known as draw.io) is a free online diagram maker that’s all about simplicity and flexibility. With its drag-and-drop interface, beginners can easily create professional diagrams.
Its cloud integration with platforms like Google Drive and OneDrive makes it easy to save and share your work, and its wide range of shapes and free templates cater to technical and business diagramming needs.
💡Pro Tip: A line graph is best for showing trends over time, like sales growth across months, while a bar graph is ideal for comparing quantities across categories, such as revenue by product type. Use the right one based on the story your data needs to tell!
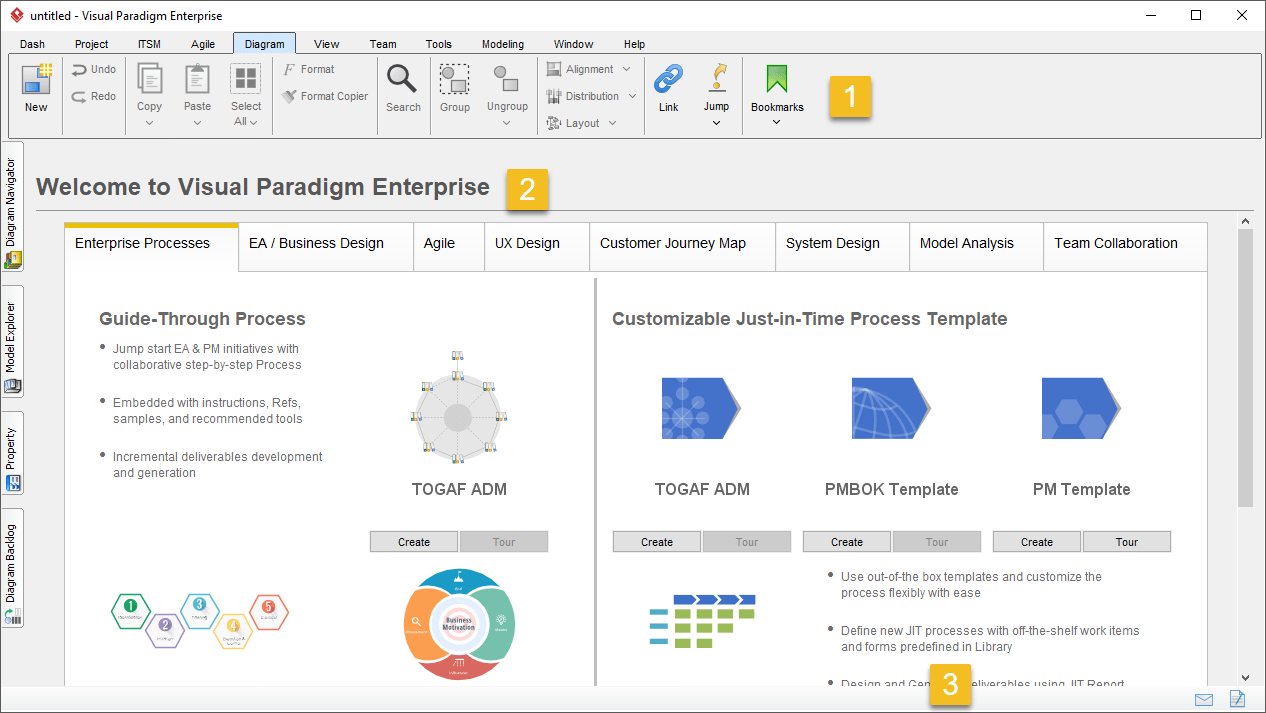
For teams tackling complex software development and business analysis challenges, Visual Paradigm offers a robust suite of modeling tools. With Visual Paradigm, you can design a UML diagram, entity relationship diagram, and business process model. It is all about advanced modeling for teams in software development and business analysis.
The tool offers various diagram templates, advanced visualizing options, and version control for team collaboration. It also supports integration with tools like Jira and Confluence, making it ideal for teams already embedded in the ecosystem.

When precision and detail are paramount in your own diagram, Microsoft Visio provides the tools and features you need. It integrates into the Microsoft 365 ecosystem, allowing teams to collaborate on diagrams directly within apps like Word, Excel, and Teams.
A Visio diagram template with automation features makes aligning shapes and connecting elements in your diagram simple.
What I liked most about MS Visio was its extensive range of templates and shapes for creating professional diagrams. It made complex visualisations, like flowcharts and network designs, easy to build and customise. We used Visio predominantly for visualising work flows for sub-teams and it was effective.
🧠 Fun Fact: The earliest version of Microsoft Visio was released in 1992 under the name Visio 1.0.
Diagram makers are essential tools for simplifying complex information and communication. They help you explain intricate concepts in clear, visual formats and share ideas.
However, many diagramming tools have limitations—some lack integration with your workflows, others struggle with real-time collaboration, and many fail to connect diagrams to actionable tasks within a project.
This fragmentation can slow down processes and hinder teams.
However, ClickUp allows you to combine diagramming capabilities with task management features. It allows teams to create, edit, and link diagrams directly to tasks, track progress, and collaborate in real time—all from one platform.
Sign up for ClickUp for free and move from brainstorming to execution 10x faster!

© 2026 ClickUp

There’s an easier way. Try a free AI Agent in ClickUp that actually does the work for you—set up in minutes, save hours every week.