What is an Affinity Diagram and When to Use Affinity Mapping (With Examples)


Sorry, there were no results found for “”
Sorry, there were no results found for “”
Sorry, there were no results found for “”
Ever been in a brainstorming session where ideas are flying everywhere, but it feels impossible to connect the dots?
This is where an affinity diagram becomes your best friend!
By organizing scattered thoughts into meaningful groups, affinity diagrams help teams identify patterns, prioritize ideas, and streamline workflows—all on a single page.
Whether you’re tackling a complex project or just trying to make sense of diverse ideas, learning to use affinity diagrams can transform your approach to ideation and workflow management.
We will walk you through the essentials of affinity diagrams, from the basics and benefits to best practices. You’ll learn each step to create one and see how ClickUp, a project management expert, makes the process easier.
Organize ideas, feedback, and research insights faster with our free Affinity Diagram Tool.
An affinity diagram is a visual tool for organizing tasks, ideas, or research findings into meaningful clusters. It’s especially useful during brainstorming sessions or project planning, as it helps make sense of complex information by highlighting patterns and themes that might not be obvious at first glance.

Whether you’re a designer, project manager, researcher, or business decision-maker, affinity diagrams would be a time-saving addition to your workflow.
While the idea of data grouping isn’t new, there was no standardized terminology or method for it a few decades ago.
The term ‘affinity diagram’ (also known as the KJ Method) was first introduced by Jiro Kawakita, a Japanese anthropologist, in the 1960s. He developed this method to synthesize the vast ethnographic data collected during his explorations in the Himalayas.
Affinity mapping eventually made its way into the corporate world, helping organizations collect and analyze information systematically and approach problem-solving collaboratively. It quickly gained traction, particularly in the fields of UX design and project planning.
Over time, it has become a staple in various management practices, including Total Quality Management (TQM) and Six Sigma.
Affinity mapping is the process of creating an affinity diagram. It involves jotting down individual ideas or pieces of information on separate notes or cards and then sorting these into groups based on their similarities.
By doing this, you can visually organize information and spot relationships between different pieces of data. It’s a great way to make a big, unwieldy set of information more manageable and insightful.
Also Read: 10 Diagram Examples for Any Type of Project
With a clear picture of how affinity diagrams can sharpen focus and prioritize actions, let’s dive into the key components that make them effective.
Affinity diagrams are powerful only when used at the right time. Ill-timed affinity mapping may result in wasted resources, misaligned strategies, or missed opportunities. To stay on the right track, here’s when to use the affinity diagram:
📝Note: Affinity diagrams begin after brainstorming and data collection, focusing on organizing the collected information rather than creating new ideas.
ClickUp offers multiple ready-to-use affinity diagram templates that instantly create customized visualizations for your team.
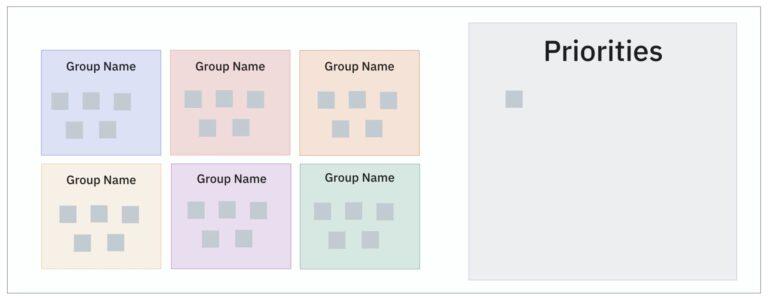
ClickUp Affinity Diagram Template is an all-purpose Whiteboard template for organizing and visualizing information. It includes a topic sheet for context, a grouping board, and space to store your ideas.
It offers six customizable supergroups with drag-and-drop sticky notes for easy organization. Custom Fields and Statuses allow you to track progress and add attributes to manage projects with easy-to-follow visual data.
ClickUp allows you to create and assign tasks directly from this affinity diagram template. With due dates mapped, its Calendar and Gantt view are great for enhancing project management.
📖 Read More: Explore the 10 Free Context Diagram Templates if you want to focus on solutions that help map projects.
Affinity diagrams simplify complex information and improve team collaboration. Here are five of its key benefits:
Now, let’s dive into the most practical part: using affinity diagrams to analyze and understand information from clients or project briefs.
Here are some diagram examples, each featuring a scenario, an affinity diagram, and a quick analysis.
| Category | Ideas from brainstorming |
|---|---|
| Public relations | Press releases, media outreach, influencer partnerships, launch event |
| Digital marketing | Social media campaigns, online advertising, email marketing, website updates |
| Content marketing | Blog posts, articles, videos, and infographics |
| Sales promotion | Discounts, coupons, contests, giveaways |
| Offline marketing | Print ads, billboards, flyers, in-store displays |
| Categories | Custom feedback data |
|---|---|
| Usability | Confusing navigation, difficult-to-find features, unclear instructions |
| Performance | App crashes frequently, slow loading times, battery drain |
| Features | Requests for new features, suggestions for improvement, missing functionality |
| Bugs | Specific errors encountered, steps to reproduce, screenshots |
| Design | Unattractive interface, inconsistent styling, accessibility issues |
| Theme | Complaints |
|---|---|
| Product quality | Defective products, damaged goods, missing parts |
| Shipping | Late deliveries, lost packages, incorrect shipping address |
| Customer service | Long wait times, unhelpful representatives, difficulty reaching support |
| Returns and refunds | Complicated return process, slow refunds, unclear policies |
| Billing | Incorrect charges, payment issues, confusing invoices |
When developing a new software product, teams use affinity diagrams to group customer feedback into feature categories like usability, performance, and design. This helps prioritize features based on recurring customer needs and facilitates the design thinking process.
In hospitals, affinity diagrams help medical teams categorize causes of errors (e.g., communication, equipment, or procedural issues) from incident reports. This allows them to focus on the most common categories and implement targeted solutions.
Marketing teams can gather customer demographics, user research, and preferences and then create affinity diagrams to group these factors. This segmentation helps tailor campaigns to specific audience clusters, improving engagement and ROI.
📖 Read More: 11 Brainstorming Templates to facilitate ideation sessions before arriving at affinity diagrams.
Aside from the steps we’ve covered, here are a few best practices for an effective affinity diagram:
⚡Bonus Tip: Use ClickUp Brain as your AI Project Manager. Once your affinity diagram is ready, Brain will generate insights and summaries for you to act on.
Both affinity diagrams and mind maps are tools for organizing information, but they work in slightly different ways. Basically, an affinity diagram groups similar items based on their natural relationships.
On the other hand, mind mapping starts with a central idea and branches out with related thoughts. It’s best suited for brainstorming and exploring different facets of a single topic.
Let’s understand the differences between affinity diagrams and mind maps with an example:
Affinity diagram: Suppose your content marketing team is brainstorming topics for a new blog series on ‘Effective Social Media Strategies.’ You gather various ideas, such as:
You write these ideas on sticky notes and then group them based on similarities.
In this process, you find that ‘Case studies of successful campaigns’ and ‘Strategies for increasing engagement’ fit into the ‘Success Stories’ category, while ‘Tips for using analytics’ and ‘Social media tools reviews’ fall under the ‘Practical Tips’ category.
And that’s it—you have the main themes for your blog series.
Mind map: Now, let’s say you’re creating a content strategy for the same blog series. So you start with ‘Social Media Strategies’ in the center of your mind map. From there, you create branches for key elements like ‘Content Types, ‘Distribution Channels,’ ‘Target Audience,’ and ‘Success Metrics’.
Under ‘Content Types,’ you branch out into ‘How-to Guides,’ ‘Infographics,’ and ‘Video Tutorials.’
Under ‘Distribution Channels,’ you can have branches for ‘Meta,’ ‘LinkedIn,’ and ‘Instagram.’
And there you go—you have a visual map to see the topics and subtopics of the primary idea.
Before diving into the “how-to,” let’s clear up a common misconception. Project teams sometimes confuse an affinity map with a fishbone diagram.
While the mix-up is understandable, it’s important to remember that these tools are quite different. Knowing these differences is crucial for using them effectively.
Here’s a quick table to highlight the key nuances:
| Aspect | Affinity diagram | Fishbone diagram |
|---|---|---|
| Purpose | Organizes and groups related ideas to identify patterns and insights | Identifies the root causes of a specific problem or issue |
| Structure | Clusters ideas into natural categories or themes | Visually represents causes and sub-causes leading to a problem |
| Usage | Used during brainstorming or when dealing with scattered information | Used for problem-solving by analyzing cause-and-effect relationships |
| Focus | Focuses on organizing data and revealing connections | Focuses on understanding why a problem is occurring |
| Output | Grouped ideas with common themes for better decision-making | A diagram showing the hierarchy of causes contributing to a problem |
| Visual appearance | Non-linear clusters of ideas or sticky notes | A fishbone-like structure with branches representing causes |
Affinity diagrams make it easy to spot connections and organize ideas, helping you drive improvements that truly matter.
With ClickUp, turning ideas into actionable plans becomes effortless.
By combining the power of affinity diagrams with ClickUp’s intuitive task management, visual tools, and automation, you can streamline ideation and execution—helping your team stay aligned, focused, and productive.
Whether you’re brainstorming or taking action, ClickUp ensures your ideas move forward with speed and precision.
Sign up with ClickUp today!

Manasi Nair
Max 25min read

Praburam Srinivasan
Max 18min read
Praburam Srinivasan
Max 18min read

© 2026 ClickUp


