

As industries expand and new competitors enter the market, it’s becoming increasingly challenging to meet customer demands. This heightened competition can lead to customer churn, with small-to-medium businesses (SMBs) reporting rates of up to 15%.
Whether you’re a customer success manager or a lifecycle marketing professional, churn prediction models can revolutionize how you identify and address customer attrition. But, the effective implementation of this tech-packed solution demands a deep understanding of CRM applications and data analytics.
This in-depth guide will cover everything you need to know about building an effective churn prediction model.
A Comprehensive Guide to Building a Churn Prediction Model
What Is the Churn Prediction Model?
A churn prediction model is a statistical or machine learning model that analyzes customer data. It aims to generate insights to predict the likelihood of a customer discontinuing their relationship with a business.
Here are the types of churn:
- Contractual churn: This is when a customer ends their relationship with a business at the end of a contract or subscription period
- Voluntary churn: This happens when a customer chooses to leave a business before the end of their contract
Both these types are based mainly on dissatisfaction or finding a better alternative.
Here are a few reasons why anticipating customer churn is crucial for businesses:
- Focuses retention strategies: By identifying at-risk customers, businesses can tailor their retention efforts to address their specific needs and prevent churn
- Improves customer experience: Churn prediction helps businesses understand the reasons behind customer departures. This opens up the potential for improving products, services, and customer support
- Reduces revenue loss: Customer acquisition costs are five times more than retention. Predicting churn and acting on this significantly reduces revenue loss and improves profitability
- Optimizes marketing efforts: Churn prediction models can help businesses allocate marketing resources more effectively by focusing on retaining high-value customers
- Improves data-driven decisions: The model reveals insights into customer behavior like how often customers interact with the product or service (e.g., usage frequency, logins). This aspect plays a vital role in making better, data-driven decisions about customer management
Understanding What Powers Churn Prediction
Data science is at the core of churn prediction. It helps businesses use scientific methods, processes, algorithms, and systems to analyze and solve retention-related complexities.
While this paints a picture of how it drives churn prediction, let’s add some color. Here’s how data science drives churn prediction:
- Acquiring data: Gathers relevant customer data from diverse sources and ensures its accuracy and reliability, providing a solid foundation for analysis
- Discovering patterns: Uncovers hidden patterns, trends, and correlations that signal potential customer churn by meticulously examining data
- Engineering features: Enhances the predictive power of churn models by creating or transforming features. Data science also captures the nuances of customer behavior by tailoring data and features toward the application
Data preprocessing: Foundation of quality and accuracy
Information is constantly flooding the digital universe each second. Businesses need quality data for the most relevant insights.
Data preprocessing is the element of data science that collects and filters high volumes of churn prediction data. Here are two key elements of data preprocessing in churn prediction.
Data collection is the first step. It involves gathering customer information, billing records, survey responses, and market data.
Data cleaning follows, ensuring data accuracy by identifying and correcting errors and inconsistencies. For instance, you may pull data from your CRM, but the data cleaning phase will help you spot any duplicate entries or missing information within the datasets.
Data analytics: The driver of churn prediction models
Data analytics is all about reviewing the collected data and converting it into actionable insights for your business. This data science element informs your stakeholders, steers customer retention strategies, and influences critical decisions.
Here’s how data analytics drives churn prediction:
- Identifies patterns, trends, and relationships to reveal insights into customer behavior. It also sheds light on how your business strategies are progressing
- Communicates insights through visual representations to keep intricate data easy to understand. Making use of charts, graphs, and dashboards also ensures the insights are actionable
- Reveals the relationship between factors influencing customer churn with the help of statistical analysis
Machine learning: The pillar of predictive power
Machine learning focuses on developing algorithms to learn from data and improve their performance over time. Here is how machine learning plays a role in accurate churn prediction:
- Improves prediction accuracy by continuously learning from new data. This helps refine churn prediction models to stay accurate despite changes in customer needs
- Optimizes resource allocation by identifying customers at high risk of churn and focusing retention efforts on those individuals
- Detects subtle changes in customer behavior that may indicate an increased churn risk. This bolsters a churn prediction model’s ability to facilitate proactive steps to address the issue
With this impact in mind, here are the two popular forms of machine learning:
- Logistic regression: This algorithm reviews data from several variables using a statistical analysis approach. It then assesses whether customers will likely churn and returns results in a yes or no format. It is quite effective for businesses dealing with products and services such as telecommunications, banking, and retail
- Decision tree learning: This model constructs a visual representation of decisions and their potential outcomes to categorize customers into more granular segments. Decision trees enable businesses to tailor strategies to individual customers or specific groups. A related algorithm, Random Forests, employs multiple decision trees to enhance accuracy and handle complex datasets effectively
How to Build a Churn Prediction Model: A Step-by-Step Breakdown
Here is a step-by-step breakdown of building a churn prediction model.
Step 1: Gathering and reviewing data
The first step is to gather quality data, a two-part process.
Identify relevant data sources
Determine which sources contain information related to customer churn, such as customer demographics, historical customer data, purchase history, usage patterns, and customer support interactions.
Here are the most effective data sources to focus on:
- CRM systems: Leverage these systems that store a wealth of customer information, like historical data, demographics, purchase history, and support interactions
- Customer surveys: Use direct feedback from customers to get insights into their satisfaction and reasons for churn
- Website and app analytics: Track user behavior to identify trends and potential issues that may lead to churn
- Social media monitoring: Analyze online conversations to gauge customer sentiment and identify potential problems
- Customer support logs: Review past customer interactions and support tickets to understand their concerns and identify common pain points
Collect and clean data
Gather the necessary data from the selected sources and ensure its quality by cleaning and preprocessing it to remove inconsistencies, missing values, and outliers.
Here are a few examples of churn-related data:
- Customer demographics: Age, gender, location, etc.
- Purchase history: Frequency, recency, and monetary value of purchases
- Engagement metrics: Website visits, app usage, customer support interactions
- Churn status: Whether the customer has stopped using your services
Processing data is a crucial yet extensive step in developing an effective churn prediction model. With the pressure of accuracy and structure, the right tool can reduce processing times and resources.
ClickUp’s versatile features are the perfect fit here. While primarily designed for task management and project collaboration, it instantly enhances your churn prediction project’s data collection, analysis, and modeling phases.
With ready-to-use templates and solutions, ClickUp helps your team streamline all operational tasks. For instance, ClickUp CRM seamlessly manages all customer transactions, from storing contact information to tracking purchase history.

Here are a few key features of ClickUp CRM that strengthen the quality of your churn-related data and customer retention efforts:
- Stay updated on the latest customer feedback and product usage with real-time data updating. This improves the accuracy of your churn prediction
- Store a wide range of customer data, including contact information, purchase history, support interactions, and feedback using ClickUp’s 15+ views. This provides a comprehensive view of customer engagement, making it easier to identify potential churn indicators
- Customize your data collection process with ClickUp API. This also allows you to build business-specific automation to reduce the burden of manual data collection
- Integrate over 1,000+ tools to ensure a consistent view of customer interactions on all platforms. Also, integrate several predictive modeling software to enhance the reliability of your churn predictions
- Use ClickUp’s Custom Fields and statuses to visualize the churn probability. For instance, you can add a pre-designed data field called ‘Customer Health,’ which can range from excellent to at-churn risk
In addition to ClickUp CRM, another effective data source feature for customer support data on this platform is ClickUp Customer Service.

ClickUp Customer Service helps build rapport, visualize feedback, and drive customer delight. It is also the ideal data source to gauge how your customer feedback and make customer data collection effortless.
Here are three features of this software to shed light on its potential:
- Collect and organize feedback from various channels, including surveys, built-in support ticket logs, and, with the right integrations, even social media interactions
- Analyze customer feedback data and identify trends, patterns, and correlations with an extensive range of visualizations
- Integrate the platform with your churn prediction model for seamless data transfer
- Address your customer service tasks efficiently with ClickUp Task Priorities
Apart from these, ClickUp also offers custom templates to help build processes to track and organize customer insights for your churn prediction model.
ClickUp Customer Satisfaction Survey Template

Satisfaction is a deciding factor in churn, and the ClickUp Customer Satisfaction Survey Template is your go-to assessment framework for visualizing it.
Here are a few top features that make it a must-have when gathering data for your churn prediction model:
- Streamline the survey creation process with the template’s extensive and engaging pre-filled data fields
- Customize data fields to include more specific questions, such as churn status and suggestions
- Collect and organize all your responses in one space with the platform’s built-in Hierarchy view
- Visualize customer satisfaction levels and areas for improvement effortlessly with ClickUp’s Custom Views like Board, List, Calendar, and more. These are easily customized to reflect what data you wish to collect for your churn prediction model
💡 Pro Tip: Use ClickUp Custom Fields to categorize customers based on various criteria, such as demographics, purchase behavior, or product usage.
ClickUp Customer Needs Analysis Template
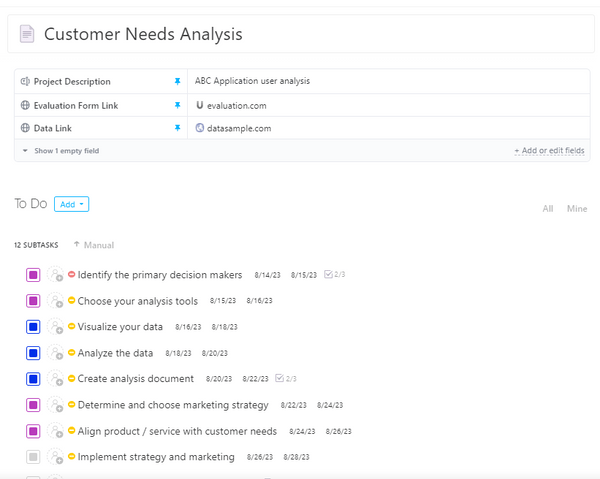
ClickUp Customer Needs Analysis Template is the perfect pre-designed framework for gathering, organizing, and analyzing customer feedback.
Here are this template’s key features that make it ideal for identifying customer data that influences churn:
- Group customers based on relevant factors to identify patterns associated with churn
- Map customer interactions with your product or service to identify pain points or areas of friction
- Pinpoint stages in the customer journey where churn is more likely to occur
With these templates and ClickUp’s comprehensive CRM systems, gathering the necessary customer data and processing it becomes seamless.
Step 2: Understanding oversampling and undersampling in data analysis
The second step is to remove bias in your predictive model.
Datasets are often imbalanced, with more non-churned customers than churned ones. This leads to inaccurate insights into real-time customer satisfaction and the likelihood of upcoming churn rates.
To remove the bias that comes from this, data scientists and analysts must normalize the dataset. Here are two ways of doing so:
Oversampling
We can increase the number of churned customer instances to balance the classes. There are two primary methods for oversampling:
- Random oversampling: This involves randomly duplicating existing churned customer data points
- Synthetic minority oversampling: This method creates new, synthetic churned customer data points based on existing ones to avoid repeated duplication
Undersampling
Undersampling focuses on balancing the number of instances in non-churned customers. Since this risks losing valuable data, it is incompatible with smaller customer data pools.
Here are three methods of undersampling:
- Random undersampling: Randomly removes instances from the majority class
- Tomek links: This involves identifying and removing similar instances
- Cluster-based undersampling: Here, you group non-churned customers based on their similarity and remove customers from the most common groups. This maintains a diverse set of non-churned customers while reducing their overall number
With the bias removed, we begin encoding the variables.
Step 3: Encoding categorical variables
Most machine learning algorithms work with numerical data. However, many real-world dataset variables are in the form of text or labels. These are termed categorical variables.
Since text and labels are incompatible with algorithms, we must encode them in numerical formats.
Here are the two methods of encoding:
1. One-hot encoding
Here are the steps for one-hot encoding:
- Create a new binary column for each category within a categorical variable
- Each row will have a 1 in the column corresponding to its category and 0s in the others
Example:
- Data field: “SubscriptionType”
- Categories: “Basic”, “Standard”, and “Premium”
Result:
The encoded results are three new columns:
- SubscriptionType_Basic
- SubscriptionType_Standard
- SubscriptionType_Premium
Based on the customer data, these columns will be assigned a 1 or 0.
2. Label encoding
This technique involves assigning a unique numerical value to each category within a categorical variable. It is best suited for categories with a natural order, like “Low,” “Medium,” and “High.”
Example:
- Data field: Customer Satisfaction
- Categories: ‘Very Dissatisfied,’ ‘Dissatisfied,’ ‘Neutral,’ ‘Satisfied,’ and ‘Very Satisfied’
Result:
Label encoding will assign the values 1, 2, 3, 4, and 5 to each category.
Churn prediction glossary
Overfitting in churn prediction occurs when a model learns the training data too well, memorizing the noise and quirks rather than capturing the underlying patterns. This leads to a model that performs exceptionally well on the training data but struggles to generalize to new, unseen data. In churn prediction, this means the model may accurately predict churn for customers in the training set but fail to correctly identify customers who are likely to churn in the future.
Regularization is a technique that discourages the churn model from assigning excessive weights to individual features, which can lead to overfitting. In essence, regularization helps the model to generalize better to new, unseen data by focusing on the most important features and avoiding over-reliance on any single feature.
Step 4: Building the prediction model
We train a machine learning algorithm on your prepared data to create a model to predict customer churn at this stage.
Here are the four parts of building your prediction model:
Choosing the right algorithm
The nature of your data and the problem determine the algorithm you select. In the previous sections, we covered a few machine-learning algorithms best suited for churn prediction.
Training the model
Once you’ve chosen an algorithm, you’ll train it using your prepared dataset. This involves feeding the model the features (independent variables) and the corresponding target variable (churn status). The model learns to identify patterns and relationships in the data that can predict churn.
Model tuning
While you may have trained the model, you must also ensure it’s ready to deliver. The best approach for model tuning is experimentation.
To optimize the model’s performance, you may need to experiment with different settings within the algorithm. This process is known as a hyperparameter or model tuning.
Here are a few examples of these settings in predictive churn models:
- Regularization: Controls the complexity of the model to prevent overfitting
- L1 regularization: Identifies the most essential features
- L2 regularization: Reduces the magnitude of coefficients, preventing overfitting
- Learning rate: Determines the step size taken during the training process
- Number of trees: Controls the number of decision trees in a random forest or gradient-boosting ensemble
Here are a few algorithms and techniques to find the best combination:
- Grid search: Tries all combinations of hyperparameters within a specified grid
- Bayesian optimization: Uses a probabilistic machine learning model to explore the algorithm settings
Visualization
Once your model is trained and tuned, you must visualize its performance and insights.
An integrated dashboard can provide an interactive overview of the model’s predictions, key metrics, and feature importance. This enables stakeholders to understand the model’s behavior and identify areas for improvement. It also plays a vital role in making informed decisions based on predictions.

ClickUp Dashboards accelerates and simplifies how a business derives actionable insights and communicates its findings.
Here’s what you can do with ClickUp Dashboards:
- Track churn rates, customer lifecycle, and other relevant indicators with the tool’s user-friendly interface
- Keep track of the latest prediction models with ClickUp Dashboards’ real-time updates
- Customize your visualizations with pie charts, predictive trend graphs, and striking text boxes to reflect your business’s growth. This is easily adapted to reflect the latest list of retained customers or even the ratio of customers based on category, relationship health, and demographics
- Convert and delegate any insight into tasks with built-in task management. This is perfect for creating and executing projects to improve client retention and reduce churn
Step 5: Evaluating the customer churn prediction model
Here are a few evaluation methods ideal for the churn prediction model:
- Holdout method: This approach divides the dataset into training and testing batches. Train the model on the training set and evaluate its performance on the testing set
- K-fold cross-validation: Divide the dataset into k equal folds. Train the model k times, using k-1 folds for training and one for testing. This helps to reduce overfitting
- Stratified cross-validation: Ensures each fold contains a representative proportion of churned and non-churned customers, which is significant for imbalanced datasets
As you evaluate your churn prediction model, you should also track its progress. Here are a few key metrics to keep in mind:
- Accuracy: How many correct predictions were made?
- Precision: How many positive predictions resulted in positive results?
- Recall: How many positive results were accurately predicted?
- F1-score: The harmonic mean of precision and recall, providing a balanced metric
Considering that step will continue as a routine activity to keep the model relevant and error-free, automating it is crucial to save time and resources.

Transform how you build and develop your churn prediction model with ClickUp Brain—a powerful AI tool that saves time and your efforts. It is designed to streamline anything you need, from insights to automation.
Here are a few features to showcase Brain drives productivity and efficiency:
- Generate progress reports instantly with AI-powered project summaries. ClickUp Brain analyzes your project data and creates comprehensive reports in just a few clicks
- Automate data preparation tasks with Brain’s advanced algorithms and techniques. This will accelerate your data preprocessing tasks from collection to cleaning without compromising quality
- Integrate it with your predictive model to automate predictions. ClickUp Brain also comes with ClickUp CRM and Dashboards to simplify data collection and visualization
💡 Pro Tip: Integrate your knowledge base with ClickUp Brain, enabling your customer support team to provide quick and accurate answers to customer questions, streamlining your customer communication processes.
Curbing Churn Rate and Securing Loyalty with ClickUp
Having a heads-up on which customers are unsatisfied or likely to stop using your services is a distinct advantage. That said, a churn prediction model doesn’t just fix potential issues like losing customers; it also helps you improve customer service.
That translates to business continuity and customer delight.
With the comprehensive steps and practices we have equipped you with, you are one step away from your churn prediction model. All that’s left is to leverage the power of AI and data science ClickUp delivers with its CRM, customer service, templates, and more.
So, sign up for ClickUp today to curb your churn rate and build lasting customer relationships!

Everything you need to stay organized and get work done.
