How to Create an Org Chart in Excel 2026
Sorry, there were no results found for “”
Sorry, there were no results found for “”
Sorry, there were no results found for “”

You can tell us: Creating an organizational chart soaks up hours of your day.
Not only are you chasing information from all 47 team members to fill the org chart (Is it Senior or Sr? Do you go by your middle name?), but you also struggle with formatting every box and line in Excel.
The org chart is an invaluable resource for every employee, especially for cross-collaboration projects and managing communication. Fast-tracking the org chart build process in Excel leaves more time and energy to make fast and efficient decisions to move the workforce closer to organizational goals.
This article will cover the differences between a traditional and modern org chart, how to make an org chart in Excel, and Excel tips to avoid duplicate work!
An org chart helps visualize team structure, making collaboration and decision-making easier. Excel provides a simple way to create one, though formatting and updates can take time.
While Excel works well for basic org charts, keeping them updated and accessible can be a challenge.
A smarter alternative: ClickUp
With Whiteboards, Forms, and an Employee Directory, ClickUp makes it easy to create, update, and collaborate on org charts in real time.
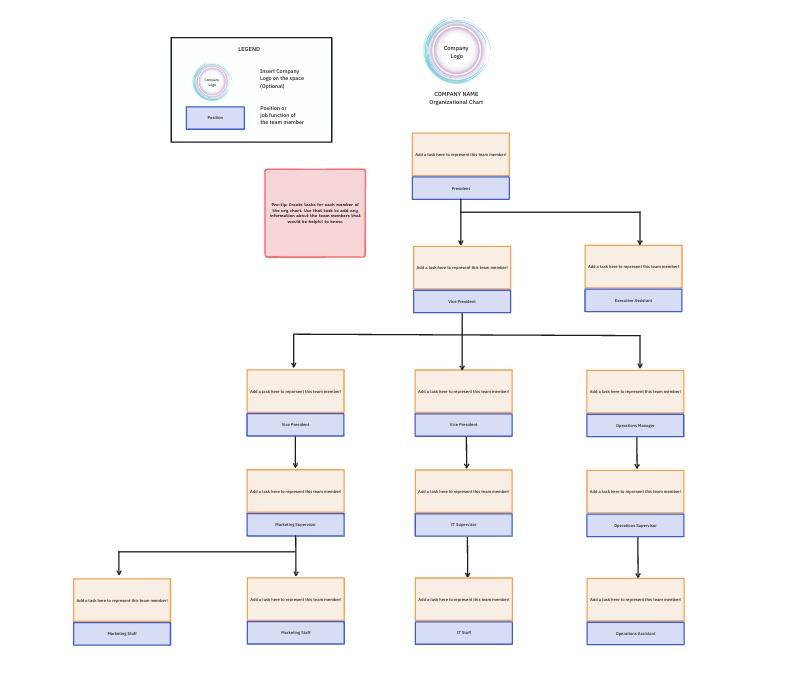
For a more flexible and efficient approach, try ClickUp’s Org Chart Template.
An organizational chart or org chart is a diagram showing a business’s internal reporting and relationship structure. Traditional org charts have a top-down structure shaped like a pyramid.
The company’s chief management positions are listed at the top level. The rest of the organization’s employees are at the second, third, and following levels. Lines on the org chart show the reporting path by connecting employees.
Suppose you’re looking for a deeper understanding of team interdependencies or need to evaluate functions of different positions. In these cases, a traditional org chart in Excel falls short in its design and capabilities.
Using modern org chart software gives far more benefits, empowering businesses to stay agile and proactive during organizational restructures, leadership changes, and staff expansions.
In what ways do modern org charts outperform traditional org charts? Beyond providing an at-a-glance visual, modern org charts help teams:
No need to wrestle with shapes and cells trying to make an org chart from scratch. ClickUp’s free Organizational Chart Template gives you a clear, editable structure right away—perfect before you even think about opening Excel.
In this org chart tutorial, we use Microsoft Word for Mac Version 16.54. The steps and features may look different if you’re on another platform or version.
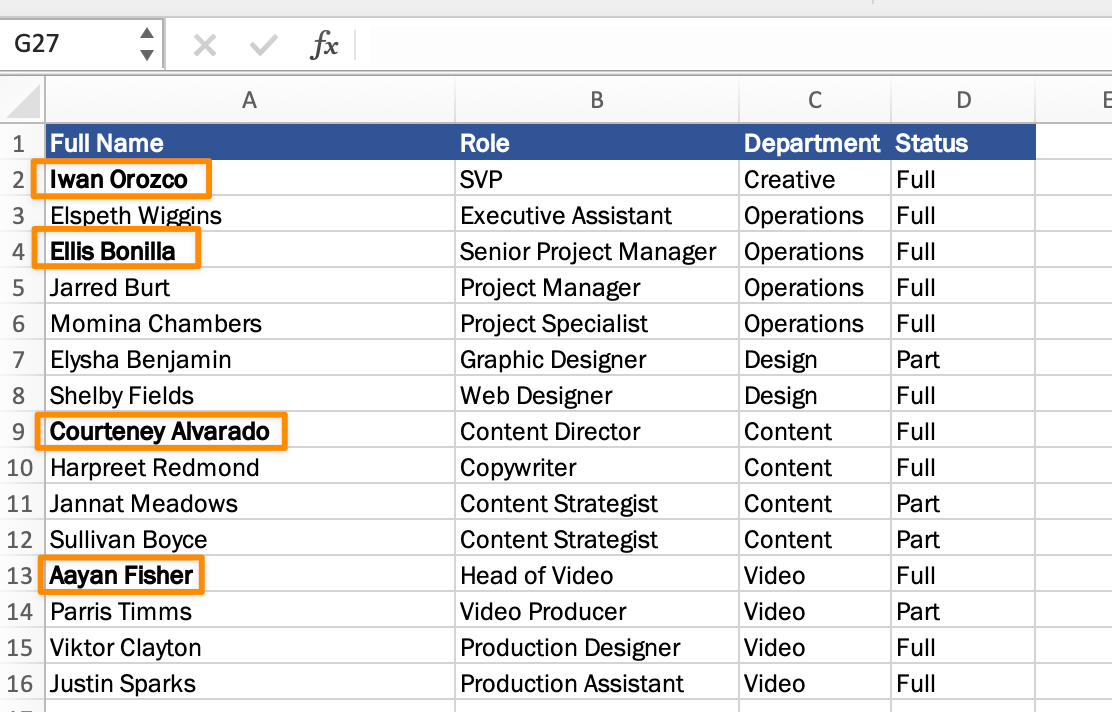
The org chart should include the employee’s first and last name, role, and department, depending on your use case. Organize this data into the spreadsheet with other details as necessary.
In our example, a team leader wants to see the creative division’s full-time and part-time status to make a case for increasing the department headcount.
Tip: Bold every manager’s name and list their direct reports underneath so when you’re editing the org chart, you won’t have to recall from memory! Alternatively, you can add a symbol before their name, such as *, and delete later using the Find and Replace function.
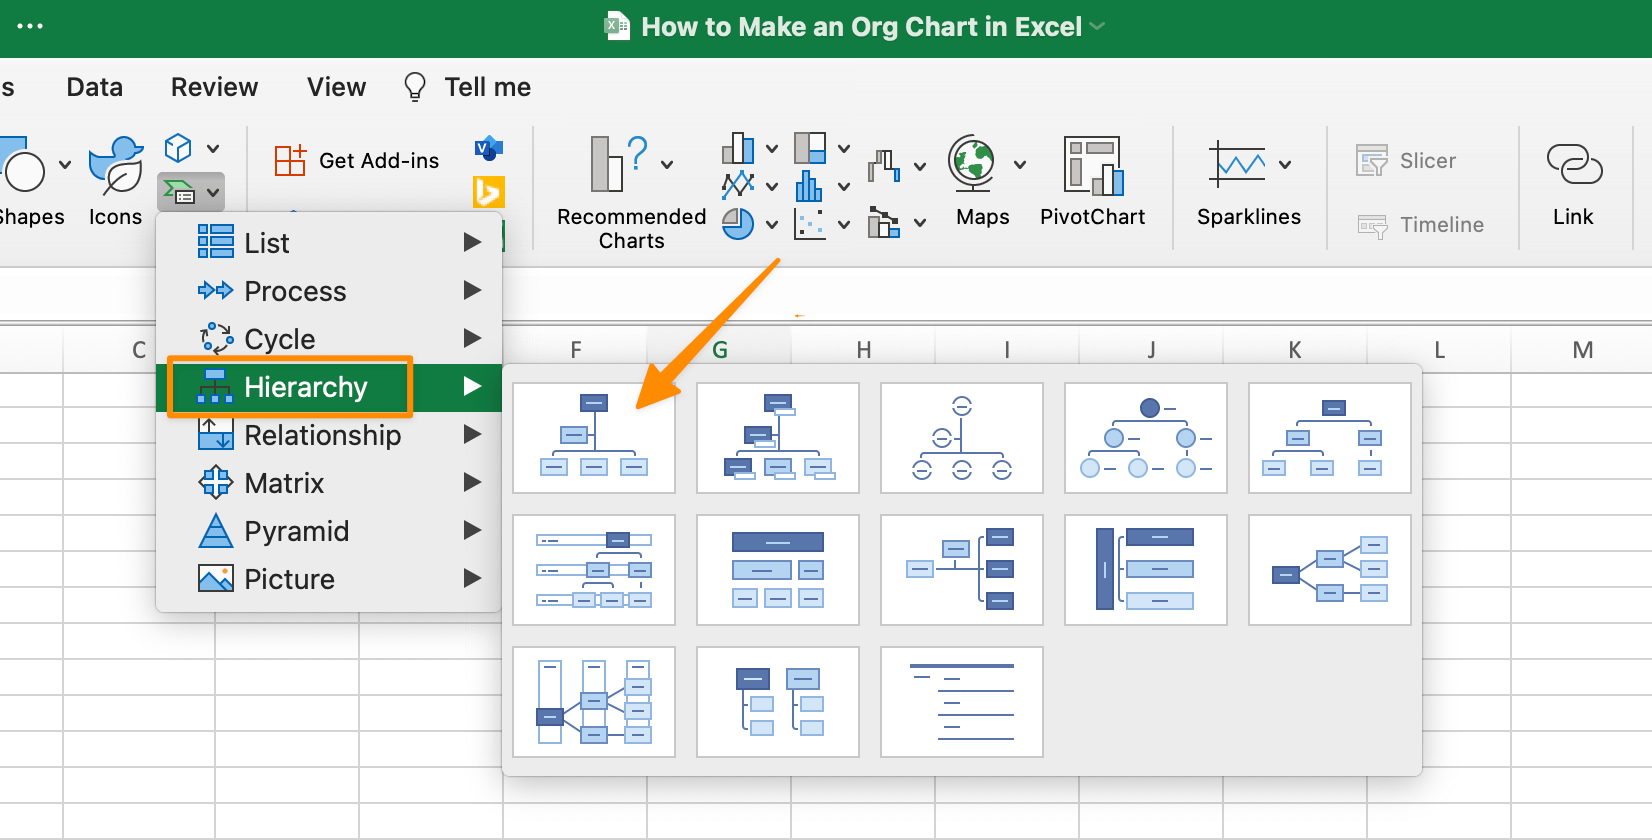
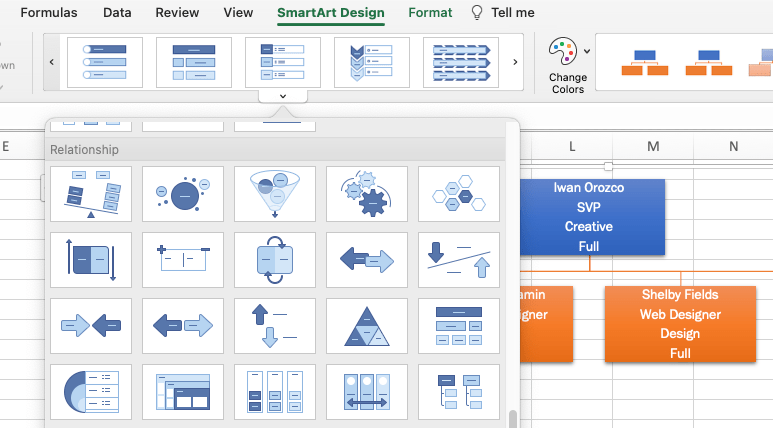
What you’ll use the org chart for will influence the type of diagram. Excel has a standard Organization chart, Circle Picture chart, Hierarchy chart, and more. Whichever SmartArt graphic you choose, you can easily switch to another anytime!
To add a Smart Art graphic, go to the Insert tab > SmartArt icon> choose Hierarchy from the drop-down menu > select Organization Chart.
First, highlight and copy all employee information, then paste the text into the SmartArt window. The org chart will look small and hard to read, but we’ll fix this when we organize the employees into their appropriate reporting structure.
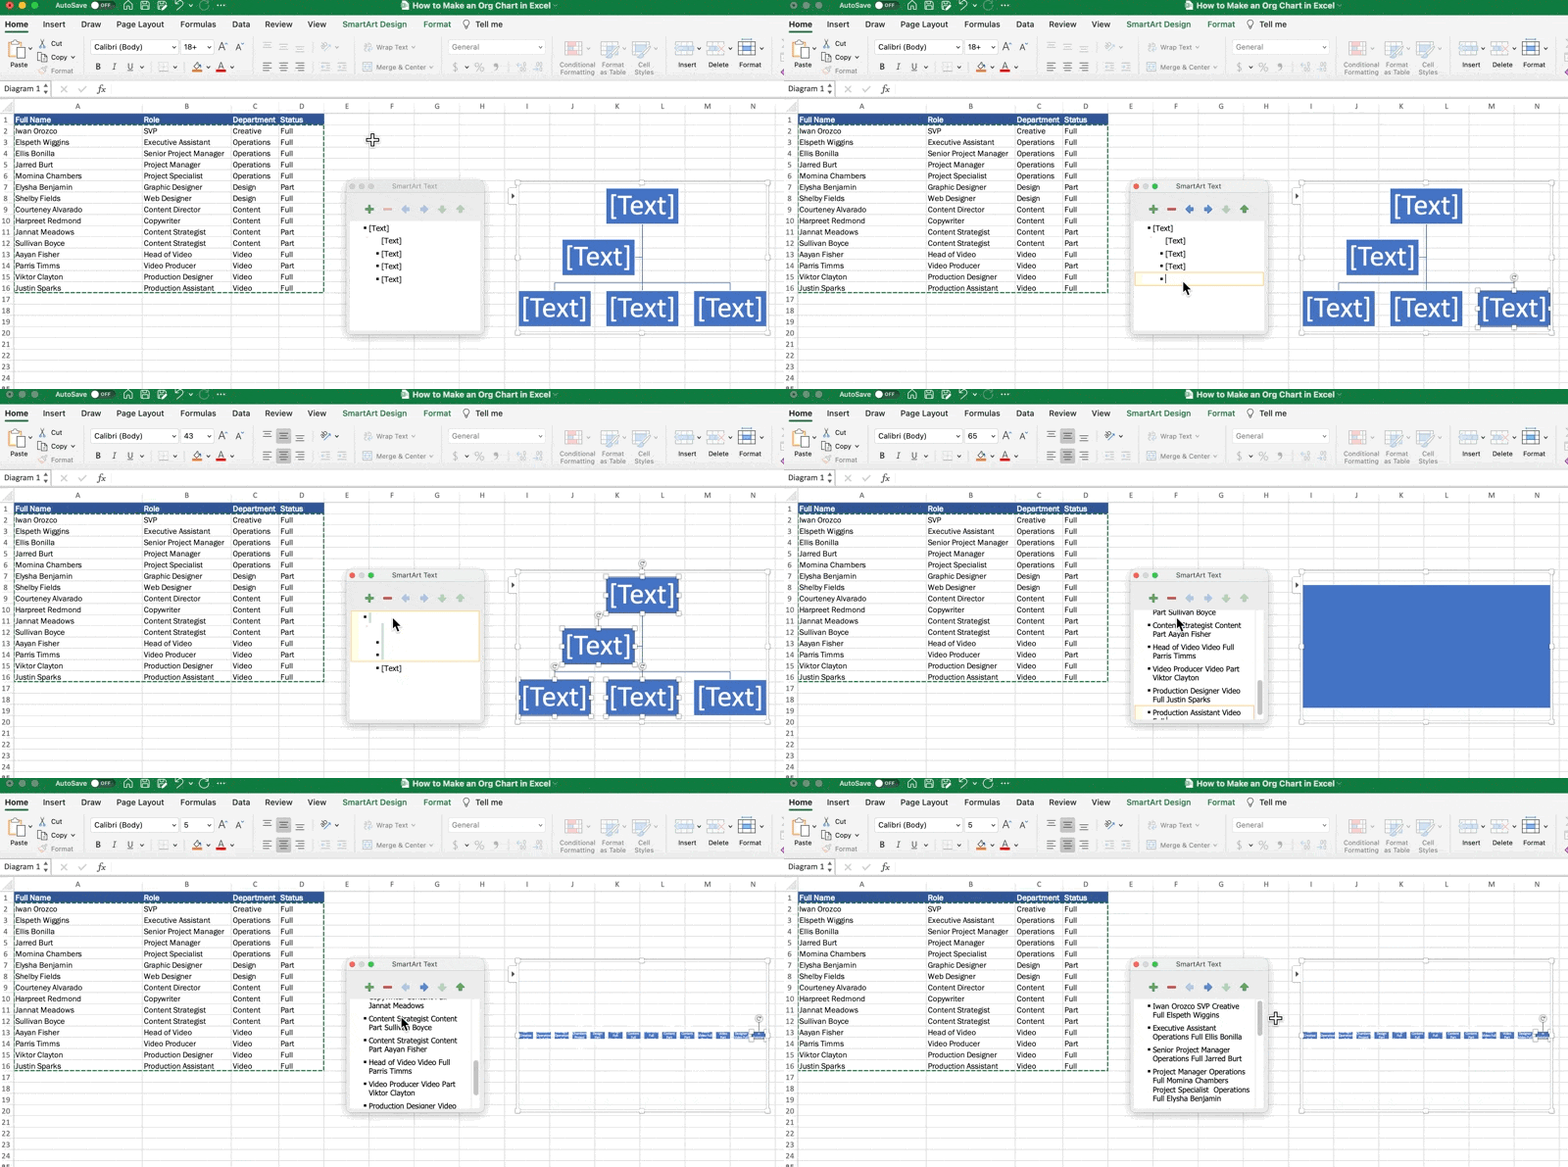
Tip: If you don’t see the Text Pane window, make sure you’ve selected the org chart, and from the Menu Toolbar, open the SmartArt Design tab and click Text Pane.
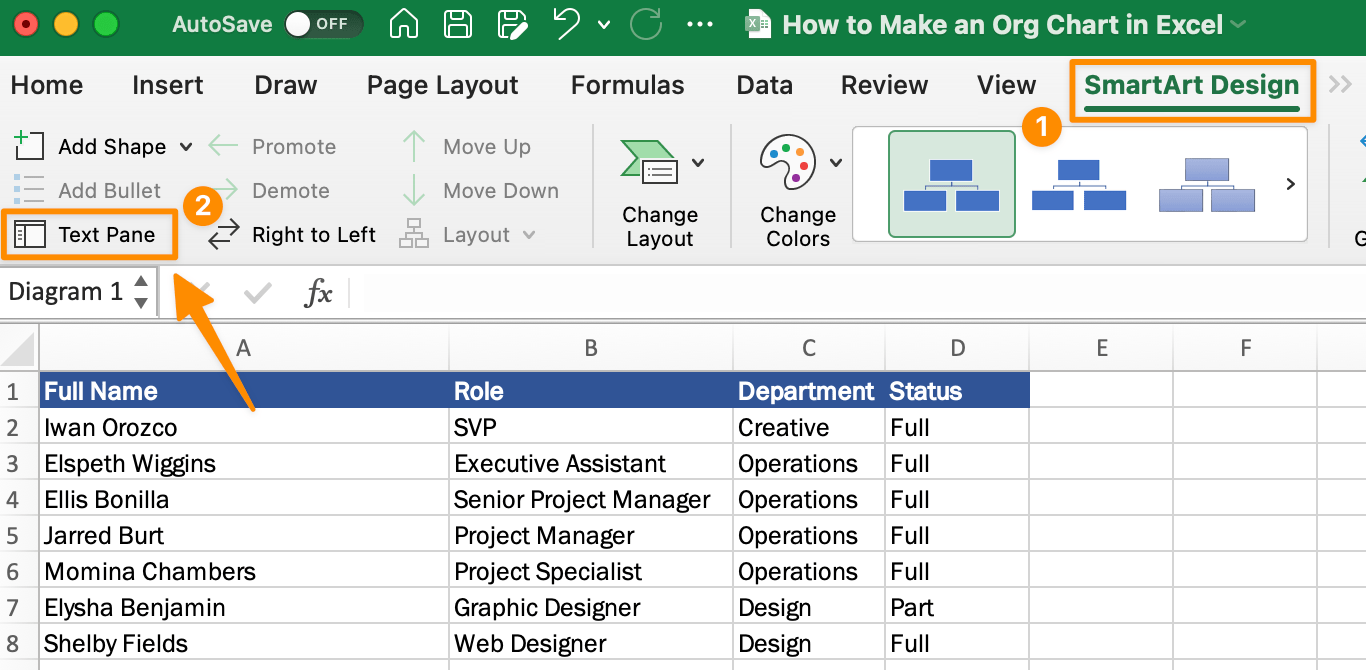
Now let’s arrange the reporting structure from the Text Pane window! The symbols at the top of the pane help perform specific actions:
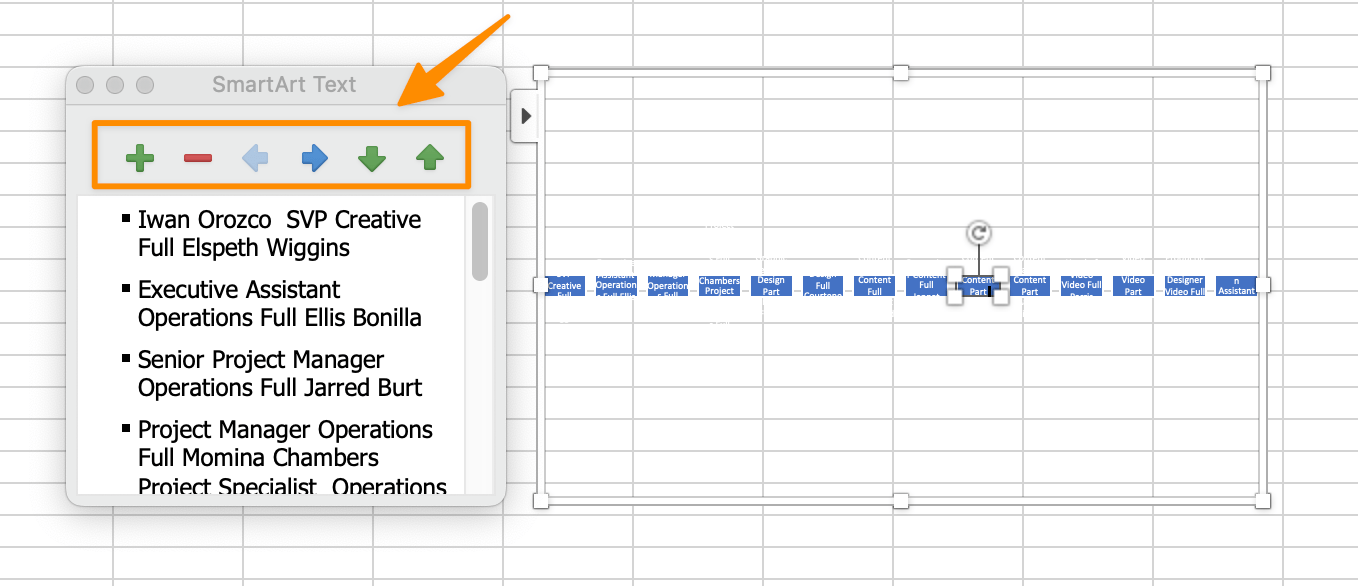
Tip: The tab and delete keys on your keyboard will also move boxes left or right (and save you clicks)!
Go through every employee’s name to position them within the hierarchy. As you move the boxes, you’ll see your org chart begin to form.
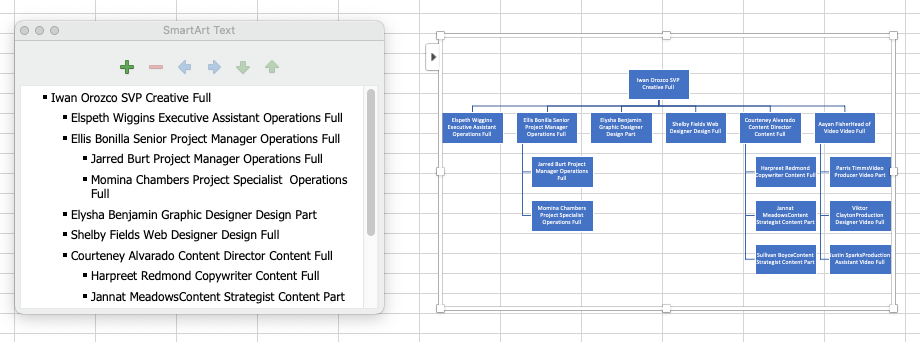
Then, click on the org chart and use Enter on your keyboard to give each detail (Name, Role, Department, and Status) its own line.
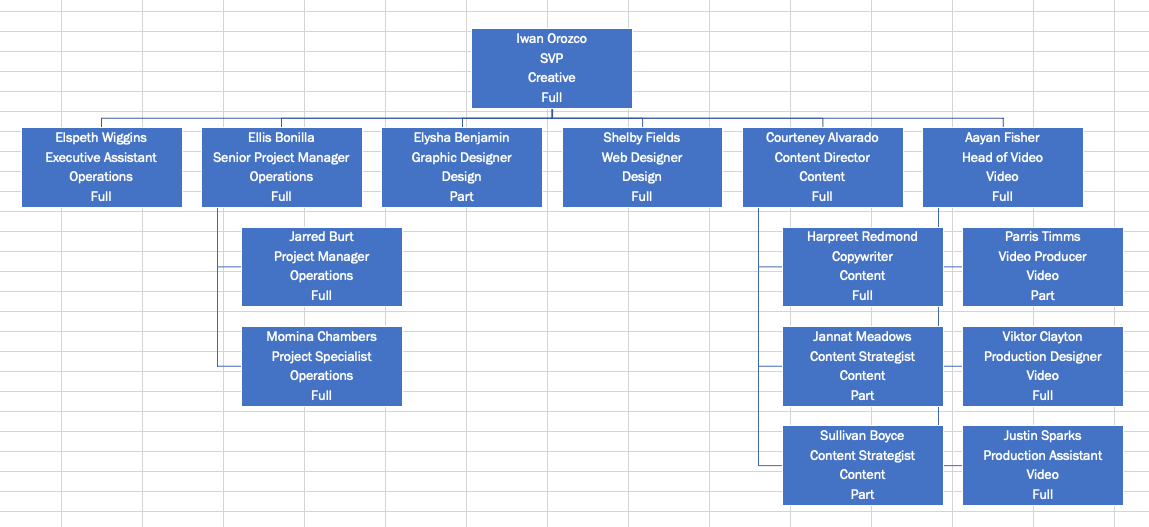
Tip: If you want to change the colors or overall style of the org chart, go to the Menu Toolbar, and under the SmartArt Design tab, choose your preferred customizations.
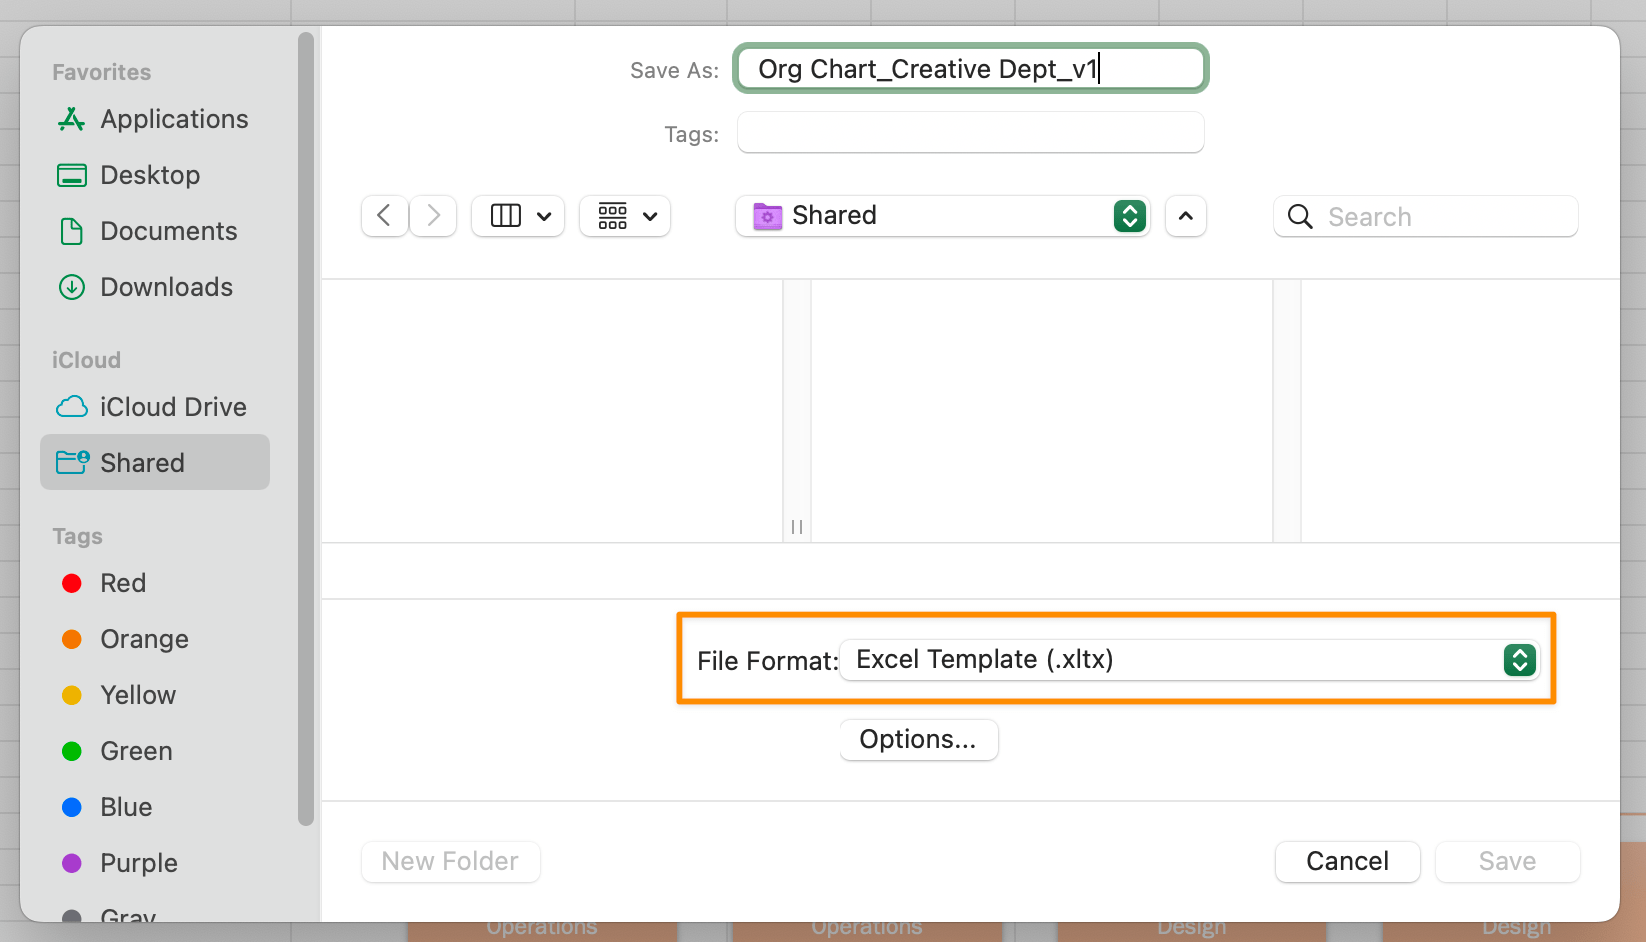
Satisified with your org chart? Great! Let’s save it as a template for future revisions. Go to the Menu Toolbar > File > Save as Template.
Related: Family tree templates 🌲

Related Resources:
The biggest downside to using an org chart in Excel is you can’t learn anything else besides the minimal information provided about each department or employee. Names, titles, and faces don’t give them a direct path to contact their team members.
Earlier, we learned about the benefits of modern org chart software. If you’re looking for a solution to replace Excel as a productivity tool or are curious about ClickUp, here are three reasons to make the switch!
Teams separated by time zones need an intuitive org chart to schedule meetings, projects, and work trips at any given time. When everyone’s contact information is in one org chart, they no longer drown in the nonessential back-and-forth emails.
Plan to spend than save more time in an Excel org chart.
If you prefer real-time collaboration—and employees responsible for updating their Out of Offices and contact information—use Whiteboards and Mind Maps!
ClickUp’s visualization tools empower teams to add more content and media to their org chart, so everyone stays connected to people and resources. Here are a few ways to customize ClickUp Whiteboards:
📮ClickUp Insight: 92% of knowledge workers risk losing important decisions scattered across chat, email, and spreadsheets. Without a unified system for capturing and tracking decisions, critical business insights get lost in the digital noise.
With ClickUp’s Task Management capabilities, you never have to worry about this. Create tasks from chat, task comments, docs, and emails with a single click!
With Excel, you’re pulling information from multiple resources like emails, Slack, and PDFs. Then, copy, paste, and format every employee box in the org chart. There’s a faster way to simplify the process. And all it begins with a Form!
Here’s how it works: You send a ClickUp Form link with all the questions a person needs to complete for their profile (headshot, title, time zone, preferred communication channel, etc.) After the person completes the Form, their submission routes to the List of your choice.
After you’ve collected all the responses, you can group, sort, and filter the tasks to build a real-time directory List for all employees to interact with at any time and anywhere!

A traditional org chart in Excel misses important context about cross-functional teams working together. For example, an executive assistant reports to the chief creative officer and SVP of marketing on paper. But informally, they also support the design department as a team coordinator.
Or perhaps you’re putting together a cross-functional team for a company-wide employer brand campaign and need contributors from Marketing, Legal, Creative, and Human Resources. This campaign will require people to be located at the office headquarters for on-site filming. A native org chart in collaborative software would be a valuable resource to quickly find and connect with these specific individuals.
Are you in an organization of tens, hundreds, or thousands? Keeping up with personnel updates and transitions is easier with powerful ClickUp Lists.
ClickUp’s all-in-one employee database template includes pre-built views, Custom Fields, and custom statuses to easily create a staff directory hub and evolve with your organization!
We’ve illustrated how Excel can be utilized to construct an org chart but there are simpler, more collaborative alternatives out there. ClickUp makes creating org charts a breeze! ClickUp’s Org Chart Template presents a unique way to organize your team’s structure in an intuitive and visual manner. No more fumbling with Excel boxes or struggling with formatting – get started with ClickUp’s Org Chart Template!
Free resources are available 24/7 with live support, on-demand webinars, and online learning. If operational efficiencies are top of mind at your organization, try ClickUp to bring your workforce closer to productivity goals! 🧑💻
© 2026 ClickUp