


Still downloading templates?
There’s an easier way. Try a free AI Agent in ClickUp that actually does the work for you—set up in minutes, save hours every week.
Sorry, there were no results found for “”
Sorry, there were no results found for “”
Sorry, there were no results found for “”

You know that moment when leadership asks, ‘Why did margins drop this quarter?’ and your first instinct is to open five spreadsheets, scroll through last month’s deck, and message someone for context?
Microsoft Copilot can help you move faster inside those tools, pulling variance tables together, drafting explanations, and surfacing patterns you’d otherwise have to hunt for manually. But the value you get from Copilot depends heavily on where you use it in the workflow.
In this article, we’ll explore how to use Copilot for financial analysis. Additionally, we’ll look at how ClickUp is a more connected alternative for running end-to-end financial analysis.
So, let’s get started!
Copilot isn’t a replacement for financial management. However, in many areas, it acts like a high-speed first-pass analyst and report generator, handling grunt work and freeing you up for judgment-heavy tasks. Here’s what it does reliably well today:
🧠 Fun Fact: Financial analysis existed long before modern finance. Merchants in Renaissance Italy used double-entry bookkeeping to analyze profits, losses, and risk across voyages. These early balance sheets helped determine whether future expeditions were worth funding, making them among the earliest decision-making tools.
The impact of AI for finances depends less on the tool itself and more on where you place it in the finance workflow. Below are seven ways teams are applying Copilot to real financial analysis work.
Reconciliation work is still one of the biggest time sinks in finance. Matching bank statements to GL entries and tying subledgers back to the general ledger is already time-consuming. Explaining why actuals deviated from the budget then adds another layer of work, often requiring lookup formulas, heavy filtering, and manual pattern scanning.
📌 Here’s what you can do with Copilot:
Drop your bank statement export and GL extract into SharePoint or OneDrive and open them in Excel. Copilot can reconcile transactions by date and amount and surface only the mismatches.
It produces a focused exception list showing transactions that appear on one side but not the other, flags unusually large gaps, and groups repeat mismatches by vendor or account.
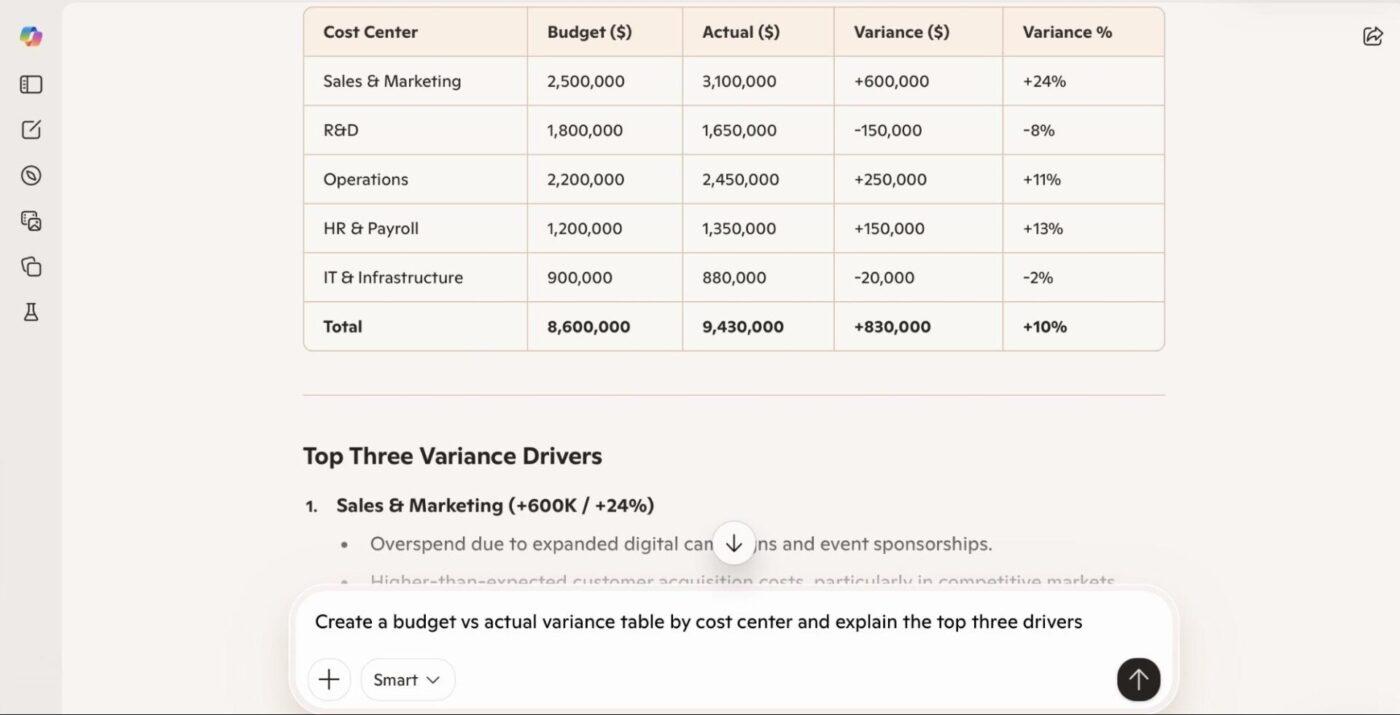
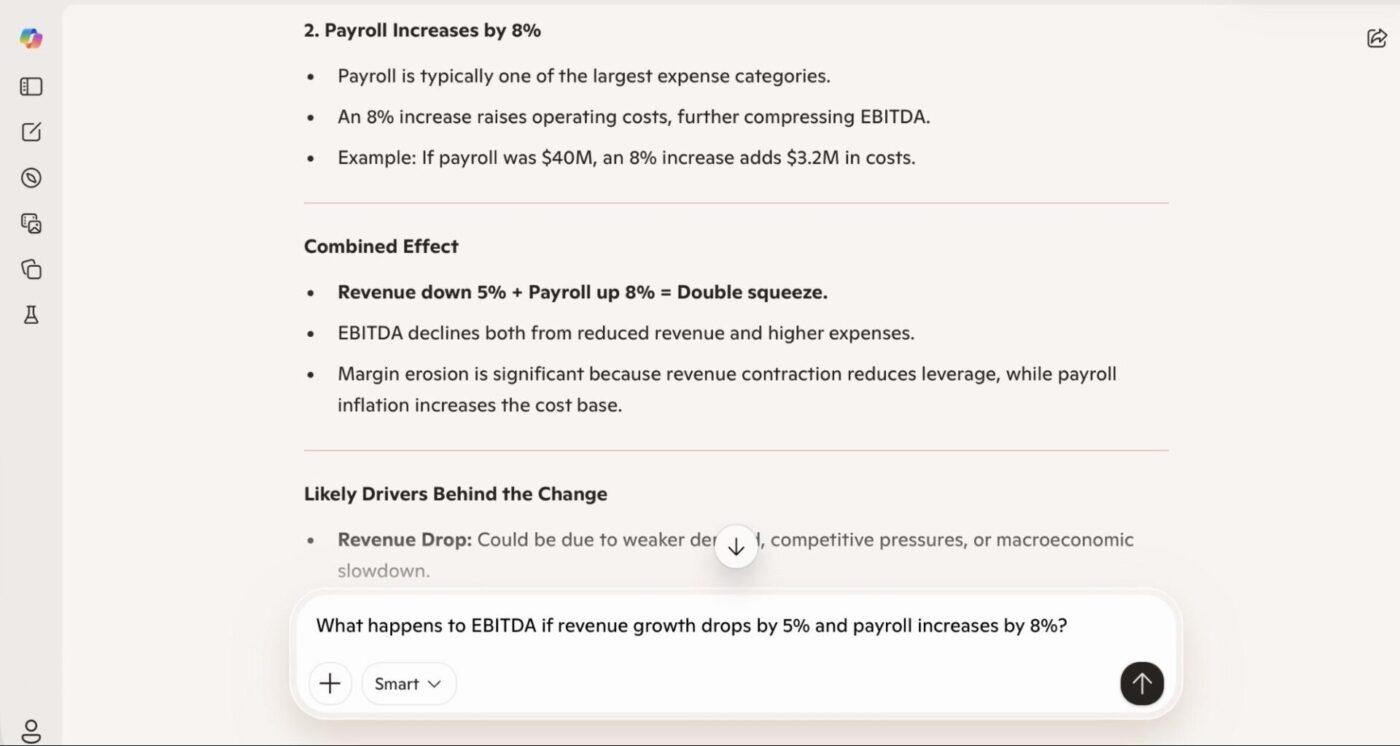
For budget vs. actuals, Copilot can also build a variance table by department or cost category and draft an explanation that points to likely drivers, such as timing differences, one-off spend, or volume changes.
📎 Try these prompts:
FP&A and finance professionals lose a surprising amount of time just getting data into a usable format. Pulling exports from ERPs, combining multiple CSVs, aligning column names, and fixing date formats happen every forecast cycle and every close. This ETL work delays analysis and introduces errors before any insight work even begins.
📌 Here’s what you can do with Copilot:
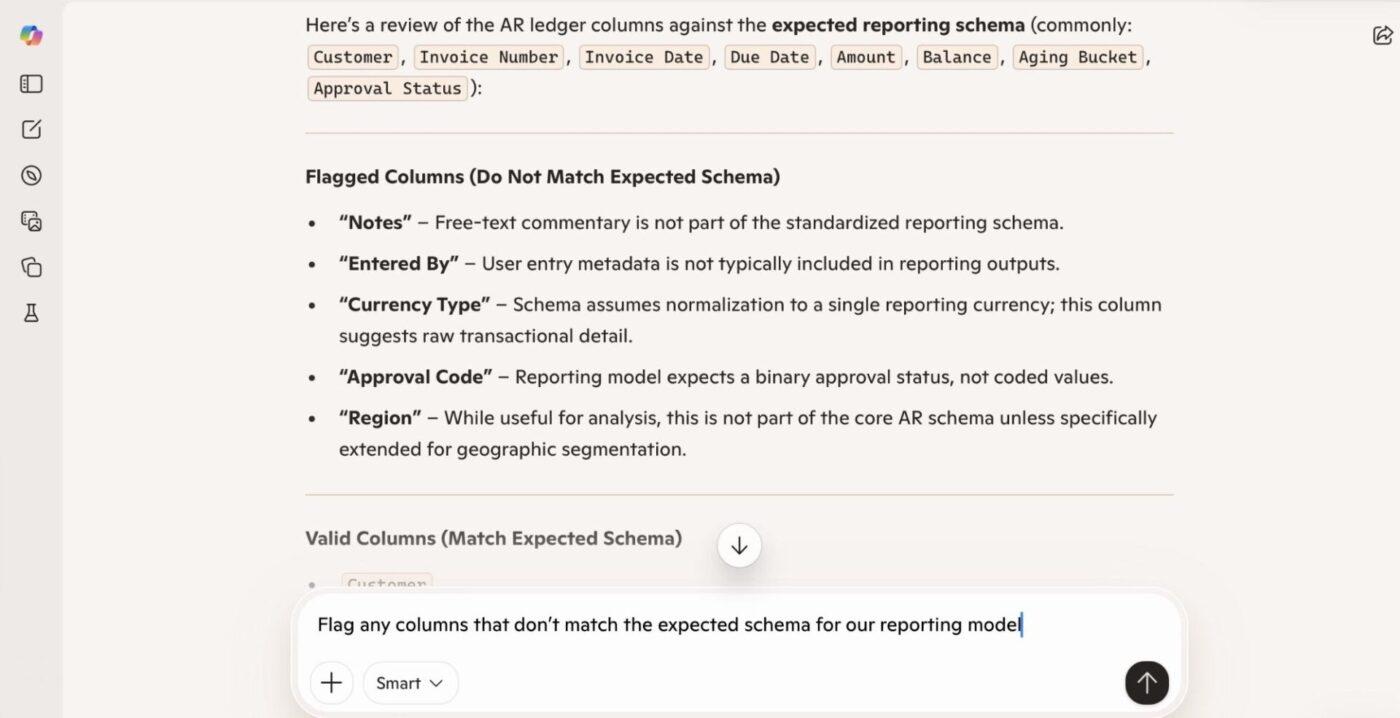
Pull multiple extracts (AR, AP, GL, revenue) into a single workbook and let Copilot standardize column headers, normalize date formats, and combine everything into one analysis-ready sheet. Copilot reshapes the data so totals align, flags missing values, and highlights columns that don’t match expected structures.
📎 Try these prompts:
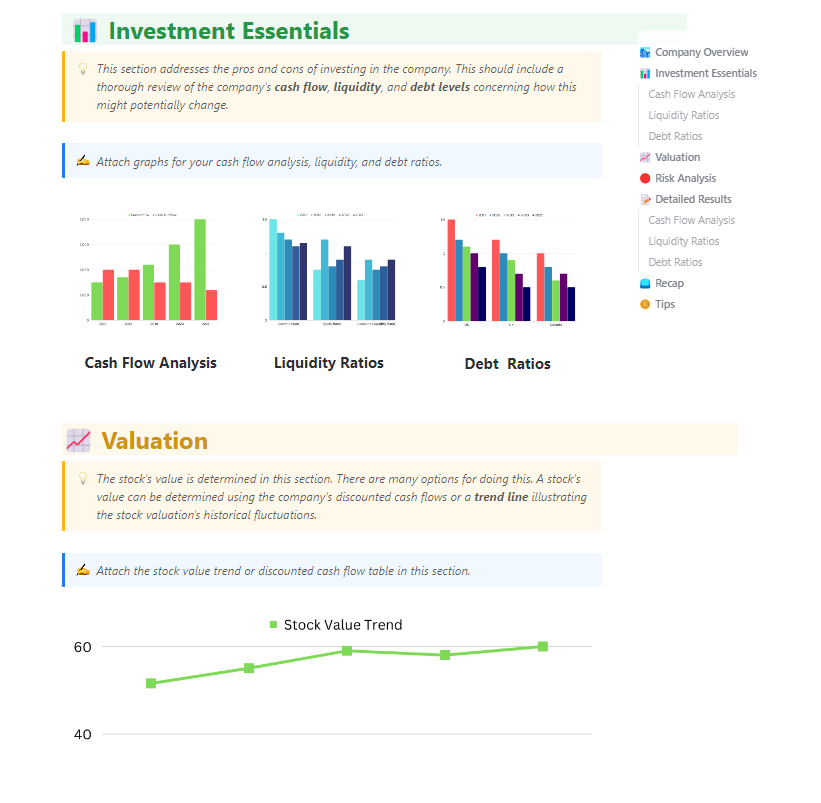
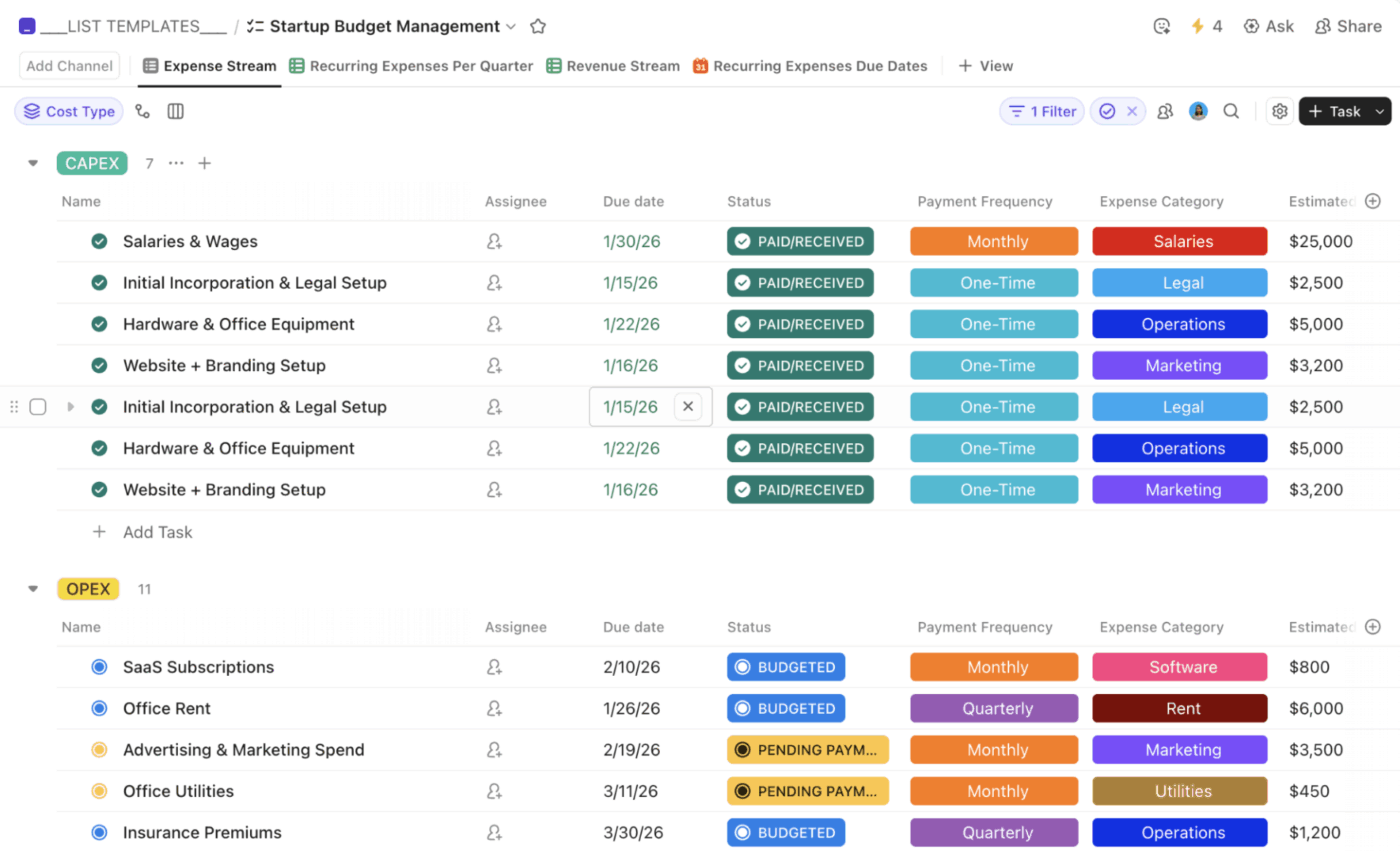
⚡️Template Archive: Opening a financial report shouldn’t feel like decoding a puzzle. The numbers might be right, but the story behind them is usually spread across your workspace.
The ClickUp Financial Analysis Report Template helps you pull all of that into one place and make sense of it. Instead of rebuilding reports from scratch every cycle, you get a ready-made structure where you can identify key financial indicators that shape budgeting and investment decisions.
You can use it to:
Managing project budgets and forecasting focus on iterations: baseline, downside, upside, headcount changes, pricing changes, and cost inflation. Building and rebuilding models manually make planning cycles slow and brittle, especially when leadership wants quick scenario views.
📌 Here’s what you can do with Copilot:
Generate a cost management plan using historical actuals, broken down by department or cost type.
Microsoft Copilot creates projection tables and applies basic forecasting logic. When assumptions change, Copilot can model the impact of increased marketing spend, slower collections, or headcount growth and show how that affects cash runway, margins, or EBITDA.
📎 Try these prompts:
📖 Also Read: Best Small Business Budgeting Software
Monthly and quarterly reporting involves explaining what changed and why. Finance teams spend hours copying figures into decks, writing commentary, and reformatting content for leadership and boards.
📌 Here’s what you can do with Copilot:
With Excel models open, Copilot can draft an executive summary highlighting key movements, trends, and outliers. It puts numbers into context, provides explanations for major variances, and structures the narrative in management-ready language.
The same insights can be turned into PowerPoint slides or a Word summary with tables and charts. The result is a well-structured first draft that reflects the underlying data.
📎 Try these prompts:
Cash forecasting and collections outreach are time-intensive and often based on stale data. AR teams juggle aging reports, customer follow-ups, and cash forecasting across multiple financial planning software.
Prioritizing what to chase and keeping communication consistent is manual and reactive, which hurts cash flow visibility.
📌 Here’s what you can do with Copilot:
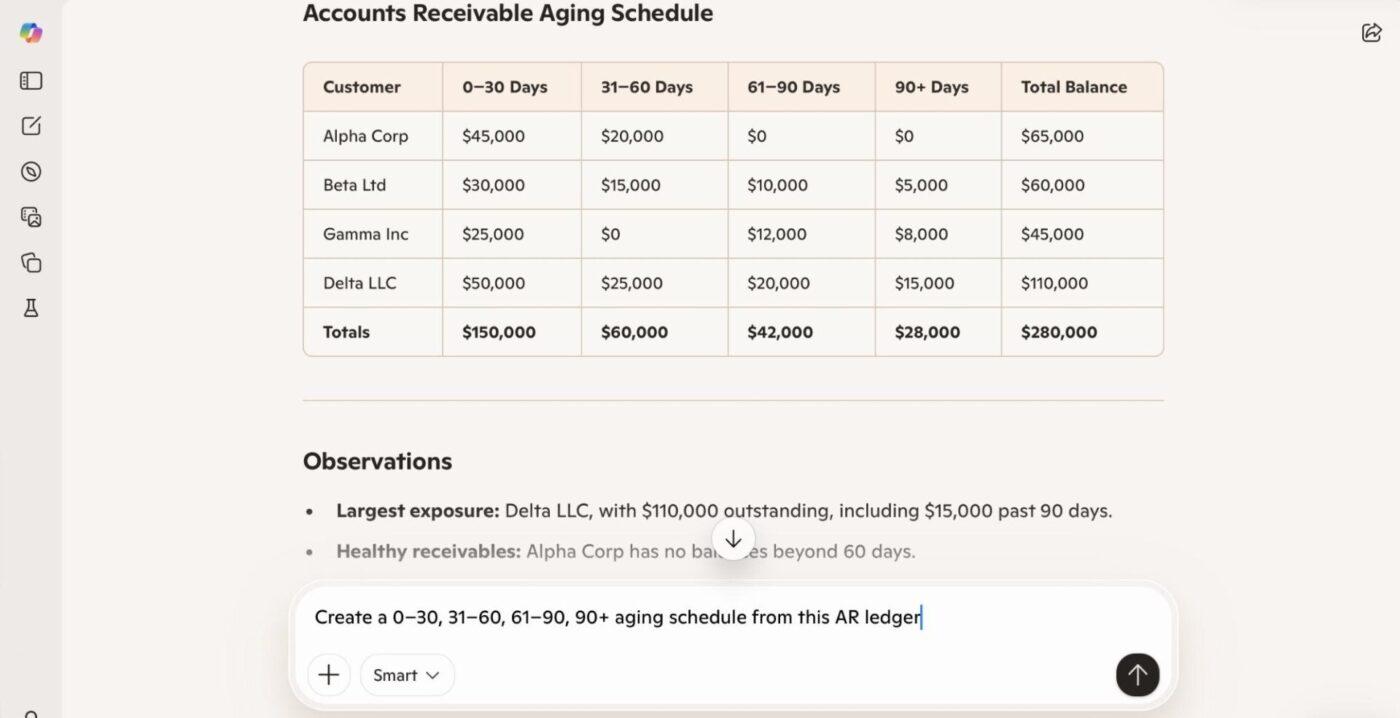
Turn the AR ledger into an aging schedule, rank customers by overdue risk based on historical payment behavior, and summarize exposure by aging bucket. Copilot highlights concentration risk, such as a small number of customers driving most overdue balances.
It can also draft personalized reminder emails that reference exact overdue amounts and due dates, helping standardize follow-ups while keeping them contextual.
📎 Try these prompts:
Control reviews and audit prep require scanning large transaction sets for unusual items: large manual journals, missing approvals, or transactions outside policy. Doing this manually is slow and inconsistent.
📌 Here’s what you can do with Copilot:
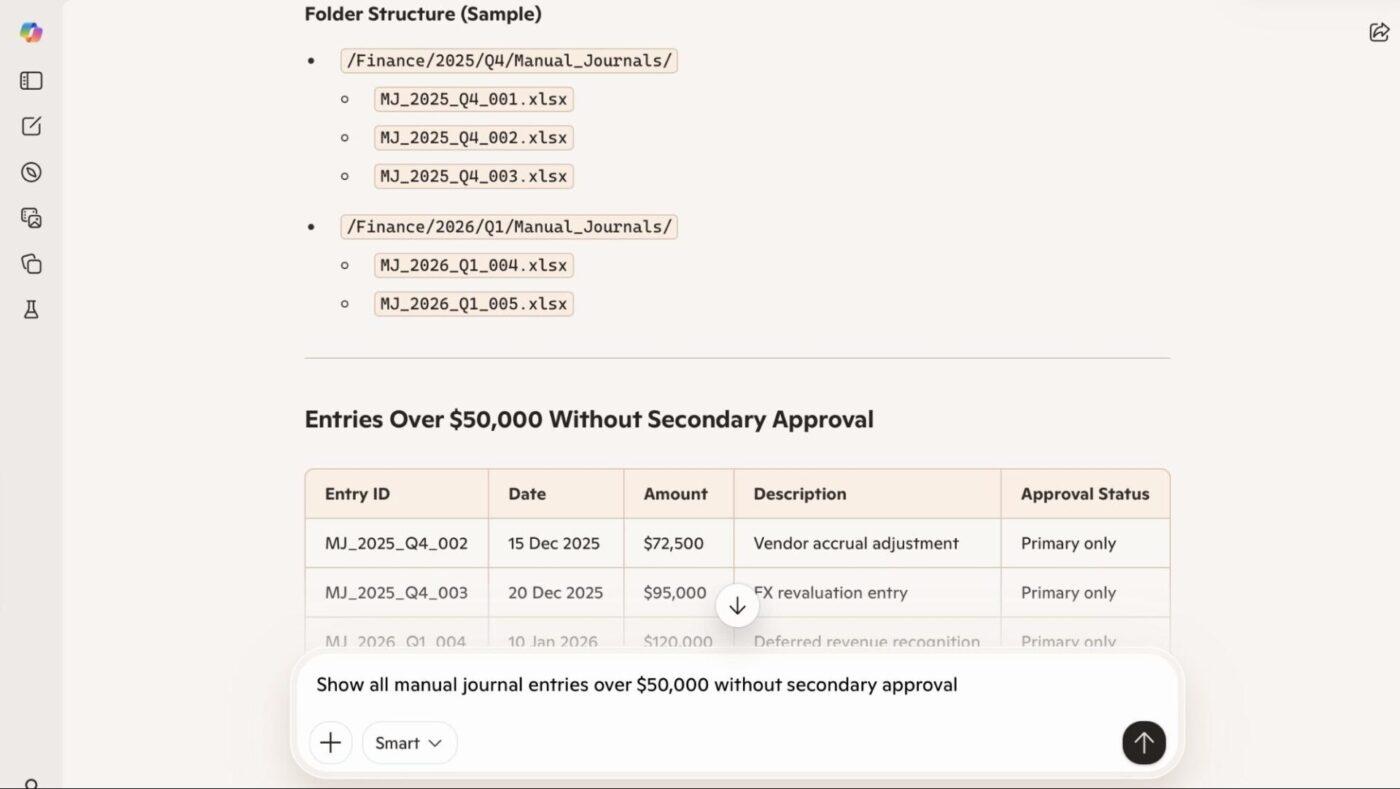
Scan GL transactions to surface entries that exceed defined thresholds, are missing approvals, or exhibit patterns that are anomalous compared to historical norms. Copilot returns an exception list ranked by potential risk, with findings grouped by business unit or owner.
It also lets you summarize patterns, such as recurring high-value manual journals in a specific cost center, to help reviewers prioritize follow-ups.
📎 Try these prompts:
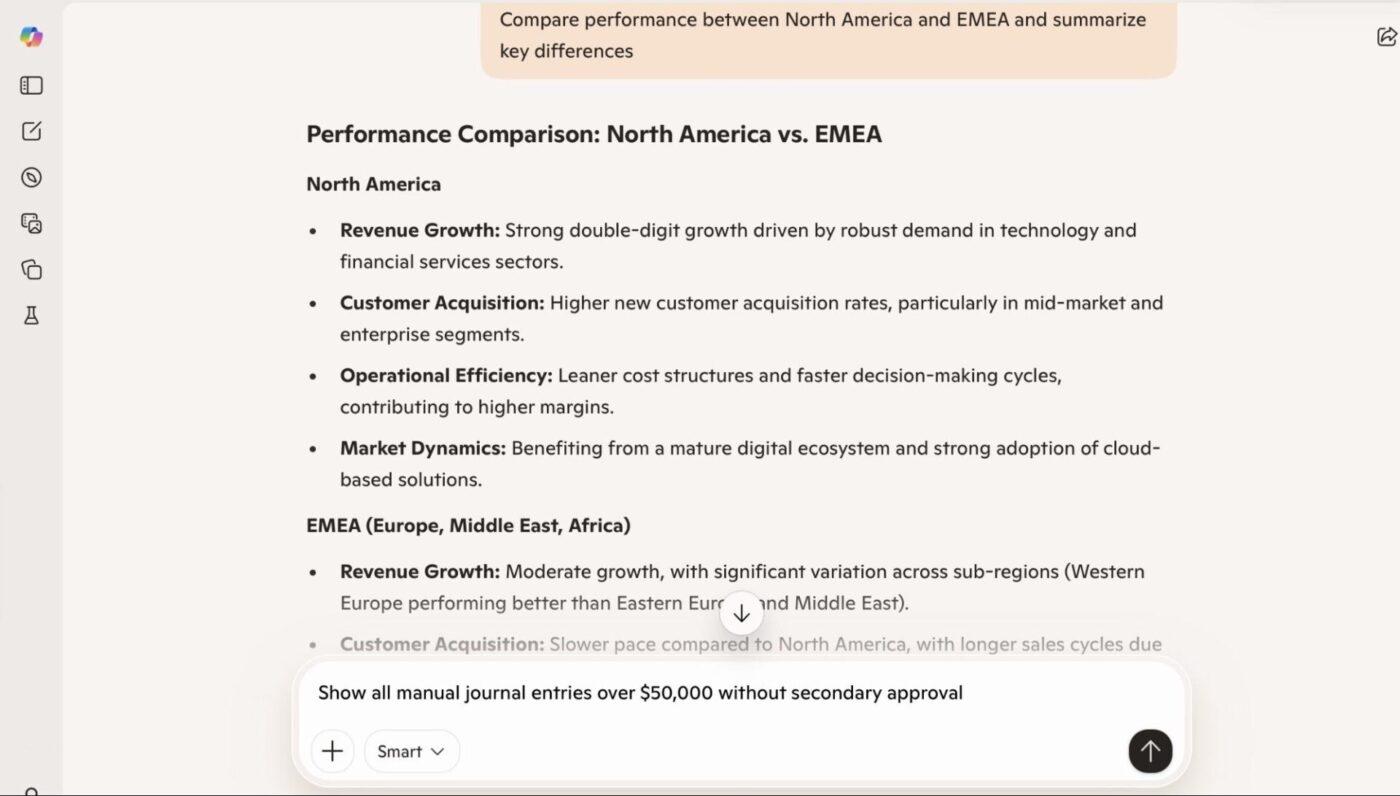
FP&A teams are constantly asked for fast insights—margin trends, cost creep, and regional performance. Building these views manually across periods and dimensions slows strategic conversations.
📌 Here’s what you can do with Copilot:
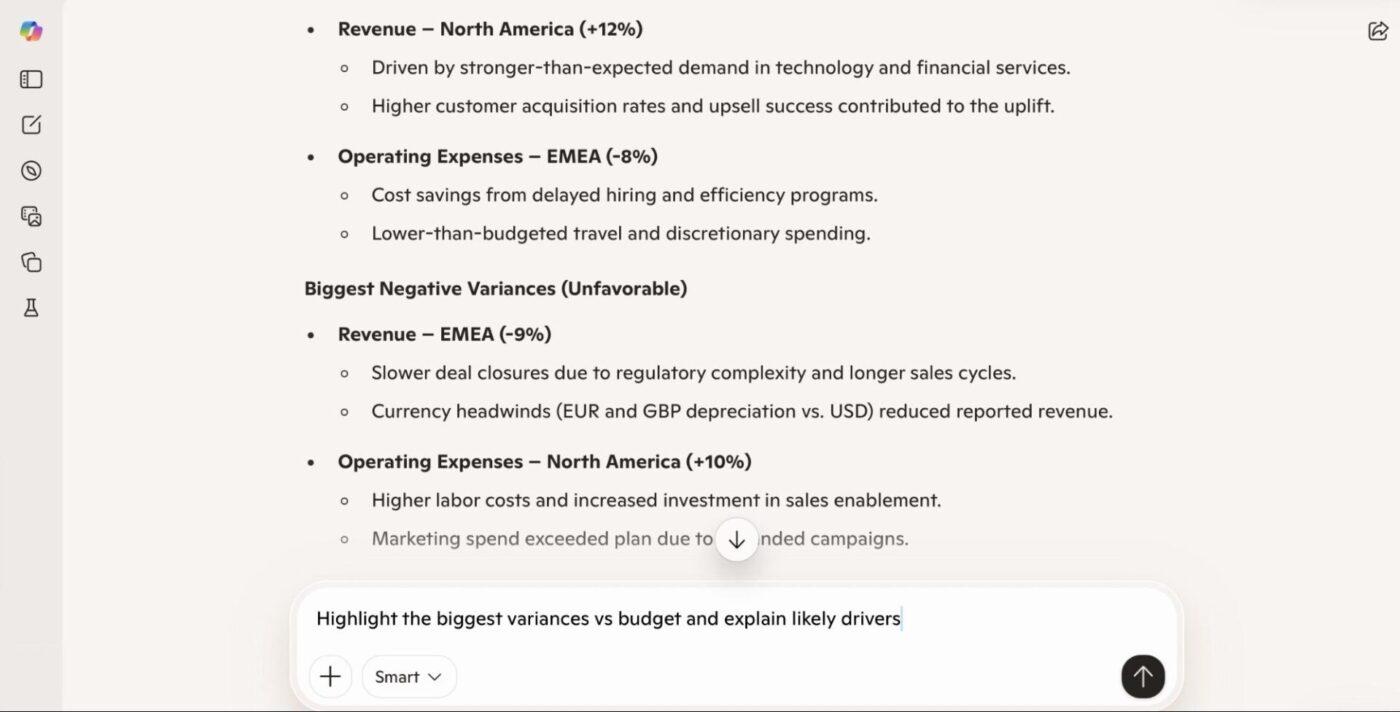
Identify the top drivers of margin changes, highlight multi-quarter trends in revenue or spend, and compare performance across regions or business units. MS Copilot returns ranked trends, growth rates, and short explanations of what likely drove the movement.
This gives leadership a quick snapshot of what’s moving the business before deeper analysis is complete.
📎 Try these prompts:
🚀 ClickUp Advantage: Finance teams lose hours toggling between spreadsheets, documents, chat threads, and disconnected AI tools. ClickUp for Finance Teams delivers a Converged AI Workspace, where planning, tracking, reporting, and intelligent automation unite in a single platform.
Stop context-switching and start closing faster, deciding smarter, and elevating your team’s strategic impact—all while maintaining audit-ready compliance without the last-minute scramble.
💡 Pro Tip: Eliminate confirmation bias by asking the AI to act as two different personas: a Bull Case Analyst and a Short Seller. Have them debate a specific ticker or financial strategy based on an uploaded 10-K, then ask a third Neutral Arbitrator persona to summarize the most objective risks and opportunities.
Effective prompts for project accounting explicitly define scope, data location, output format, and decision intent. Copilot knows your organization’s context only if it’s referenced directly in the prompt, so specificity is key.
Here are some techniques that would help:
🔍 Did You Know? Analysis isn’t foolproof. Sir Isaac Newton, one of the smartest humans ever, lost the modern equivalent of $3 million in the South Sea Bubble of 1720. His famous quote afterward, “I can calculate the motion of heavenly bodies, but not the madness of people.”
Using AI for work can speed up financial analysis, but only if it’s used with intent. The way you structure data, frame prompts, and validate outputs within Copilot directly affects the quality of insights you get. Here are some best practices to follow:
🧠 Fun Fact: Coined by Leonard Lauder (Chairman of Estée Lauder), the ‘Lipstick Indicator’ theory suggests that when the economy is in a recession, lipstick sales go up. Why? Because when people can’t afford big luxuries like cars or designer handbags, they treat themselves to small ‘affordable luxuries’ like a new shade of lipstick.
Here’s a quick breakdown of where Copilot usage often goes wrong in finance, and how to fix each issue.
| Mistake | Solution |
| Asking for insights without defining the output format | Specify whether you want a table, narrative, chart, or summary at the outset to avoid ambiguous results |
| Assuming Copilot generates perfect forecasts | Treat forecasts as starting points, then validate assumptions and numbers |
| Not verifying security/permission scope | Confirm users have access to the underlying data Copilot will reference to avoid permission errors or incomplete answers |
| Skipping output review | Always cross-check Copilot’s summaries against source data before acting on insights |
| Using Copilot for high-stakes judgment without oversight | Reserve Copilot for draft insights, not final compliance or audited reporting |
📮 ClickUp Insight: 22% of our respondents still have their guard up when it comes to using AI at work. Out of the 22%, half worry about their data privacy, while the other half just aren’t sure they can trust what AI tells them.
ClickUp tackles both concerns head-on with robust security measures and by generating detailed links to tasks and sources with each answer.
This means even the most cautious teams can start enjoying the productivity boost without losing sleep over whether their information is protected or if they’re getting reliable results.
Microsoft Copilot can accelerate analysis and surface patterns quickly, but it isn’t a substitute for finance governance, controls, or judgment. Understanding where Copilot’s capabilities end is critical to using it safely in your workflows:
🔍 Did You Know? The Economist uses the price of a McDonald’s Big Mac in different countries as a serious tool for financial analysis. It’s called Purchasing Power Parity (PPP). If a Big Mac costs $5.69 in the US but only $2.50 in another country, it suggests that country’s currency is ‘undervalued.’
Keeping financial analysis confined to isolated spreadsheets, presentations, and disconnected files creates friction and silos that impede insight and speed. When data lives in files without integrated context, like approvals, commentary, audit trails, or linked financial models, Copilot and similar assistants can’t reliably connect dots across sources.
This fragmentation forces analysts back into manual assembly, duplicate work, and error-prone reconciliation instead of forward-looking analysis. Connected, referenceable data enables Copilot to draw consistent, context-aware conclusions; static files do not.
📖 Also Read: Best Project Budgeting Software to Stay on Track
ClickUp Brain is an AI assistant built directly into the ClickUp platform, giving finance teams a single, intelligent workspace for planning, analysis, and reporting.
Below is how ClickUp Brain supports real financial workflows, with specific features and practical examples.
Finance teams constantly work with reports, plans, commentary, assumptions, and approvals scattered across spreadsheets, docs, and chat threads.
This creates Tool Sprawl, where critical financial context is fragmented across systems, and no single place reflects the full picture of what’s happening. ClickUp Brain’s Contextual AI eliminates that by pulling financial knowledge into one workspace context.
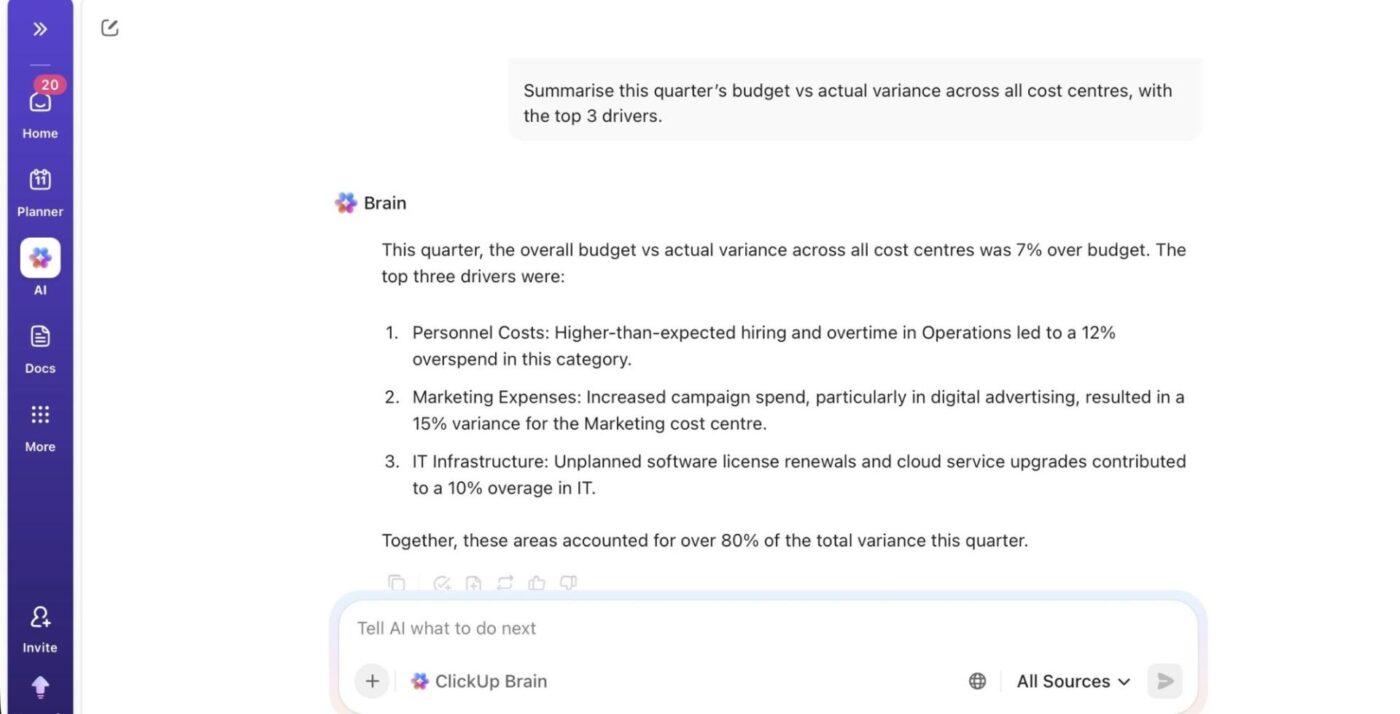
You can ask, ‘Summarize this quarter’s budget vs. actual variance across all cost centers’ or ‘Show me all open tasks blocking vendor invoice approvals,’ and get up-to-date answers grounded in the same system where finance work is already tracked.
🔍 Did You Know? In a Stanford study, researchers built an AI analyst and fed it 30 years of financial data. The AI outperformed 93% of human fund managers. While humans generated about $2.8 million in ‘alpha’ (extra profit) per quarter, the AI generated $17.1 million.
ClickUp Dashboards are where finance leaders track KPIs, burn rates, variances, and cash positions across programmes or departments. You can embed AI Cards on dashboards that automatically generate written insights from that data.
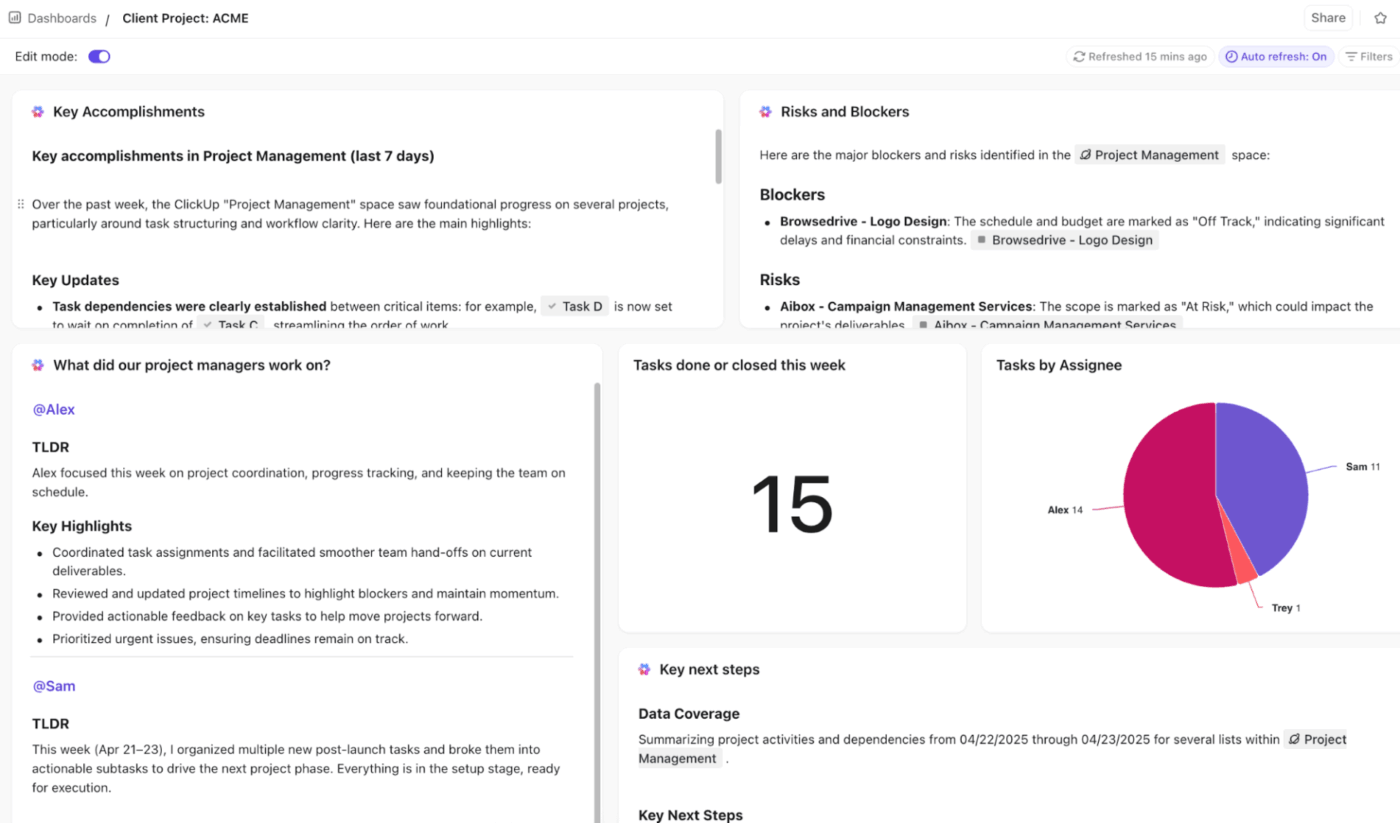
For example, an AI Executive Summary card can automatically generate a high-level overview of budget-to-actual performance across cost centers. Plus, an AI Project Update card placed next to cash flow or expense cards helps summarize recent changes and highlight emerging trends or risks without manual interpretation.
💡 Pro Tip: Upload your budget and ask the AI to ‘Simulate a 15% increase in raw material costs alongside a 5% drop in volume.’ The AI can use Python to recalculate your entire P&L instantly, showing you exactly where your break-even point sits, and which cost levers are most sensitive to market volatility.
Apart from analysis, financial workflows also include approvals, reminders, escalations, reconciliations, and follow-ups. ClickUp Automations let you define if/then rules that keep work moving without constant manual coordination.
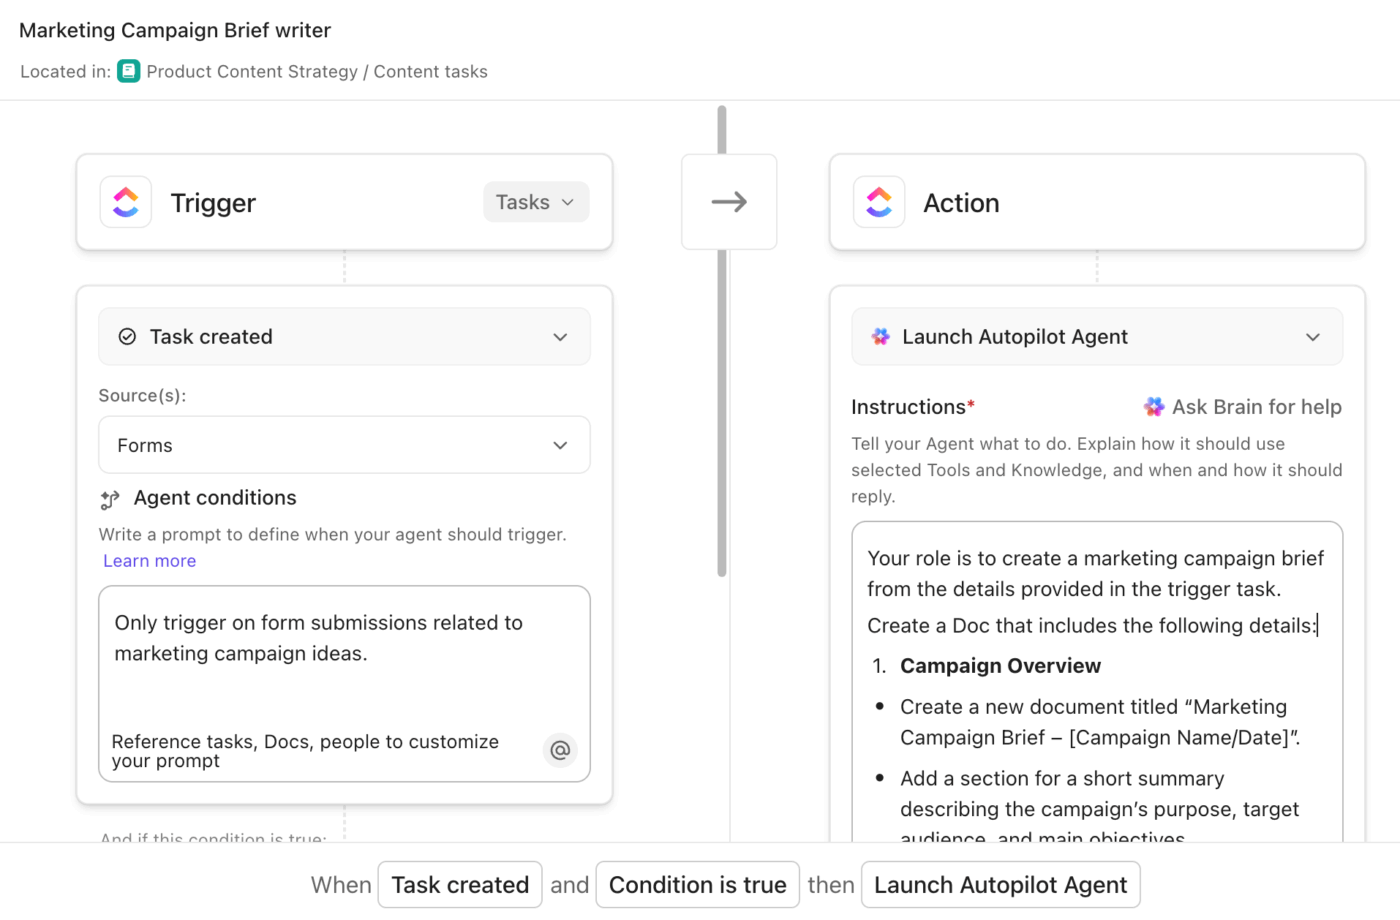
For example, you can:
Pairing Automations with ClickUp Brain lets you combine workflow triggers with AI-generated context and summaries, so actions come with built-in clarity.
For instance, when a financial report is uploaded, an Automation can assign a review task and use ClickUp Brain to summarize the report for the reviewer. After an audit checklist is completed, another Automation can trigger ClickUp Brain to generate a summary and create a ClickUp Doc for compliance records.
ClickUp Super Agents are AI-powered teammates that run inside your workspace and operate on triggers and rules. Instead of responding only when someone prompts Brain, Super Agents continuously monitor financial workflows, analyse activity, and take action when conditions are met.
Here are a few examples of Super Agents finance teams can set up:
🚀 ClickUp Advantage: If your finance work already lives across tasks, Docs, spreadsheets, and shared drives, then ClickUp Brain MAX is what you need. It’s an AI desktop companion that adds an AI layer to your context.
This is how it becomes useful in your financial workflows:
🔍 Did You Know? Because almost everything you buy is shipped in a cardboard box, analysts track the production of corrugated fiberboard. If cardboard box production drops, it’s a leading indicator that manufacturing and consumer spending are about to crash—often months before the official data shows it.
When Copilot launched in 2023, it felt like a real shift in how quickly finance teams could get answers from their spreadsheets and reports. It removed a lot of the grunt work around analysis, summaries, and first-pass insights.
However, it still tends to stall at the stage where real progress is needed—approvals, follow-ups, fixes, and clear ownership. Valuable insights quietly lose their momentum here.
ClickUp is a stronger alternative because it brings your financial context, decisions, tasks, approvals, reporting, and AI into one workspace. While ClickUp Brain answers questions using live budgets and variance notes, ClickUp Dashboards turn metrics into decision-ready views, and Automations push insights into action.
If you’re serious about moving your financial workflows forward without losing context, sign up for ClickUp for free today.
No. Copilot is a productivity assistant, not a replacement for human financial analysts. It can automate repetitive tasks, suggest formulas, surface patterns, and draft commentary, but it doesn’t replace professional judgment.
Copilot respects existing enterprise security models and role-based access controls, meaning it only sees data that users are permitted to access within Microsoft 365.
Copilot can effectively summarize data, generate formulas, and highlight patterns, but its outputs aren’t guaranteed to be accurate or reproducible on their own.
Yes. Copilot outputs should be audited before use in decisions or reporting. Treat AI-generated analysis and commentary as working notes that must be validated against source data and business rules.
Effective governance combines clear usage guidelines, role-based access controls, and review checkpoints. Teams typically define what Copilot can be used for, train users on prompt quality, and require peer or manager sign-offs on critical outputs.

© 2026 ClickUp

There’s an easier way. Try a free AI Agent in ClickUp that actually does the work for you—set up in minutes, save hours every week.