Category archives: Gantt Charts
Gantt charts are a common visualization used to show project plan and schedule. It's a handy method to see how everything fits together and identify where any potential roadblocks may occur.
![A [year] Guide to Gantt Chart Milestones](https://clickup.com/blog/wp-content/uploads/2020/11/what-are-gantt-chart-milestones-1-768x576.png)
Project Management
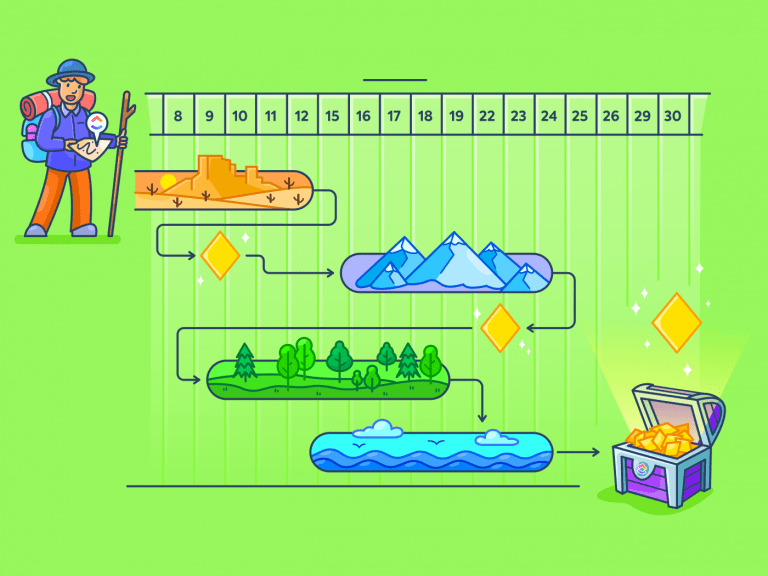
A 2026 Guide to Gantt Chart Milestones


Gantt Charts
Gantt Chart vs. Timeline: What Is the Difference?
Gantt Charts
How to Create a Gantt Chart in Microsoft Word
Gantt Charts
Microsoft Project Gantt Chart vs. ClickUp Gantt Chart: Which One Is Right for You?


Software
Jira Gantt Chart vs. ClickUp Gantt Chart: Which Is Better for Project Planning?
Software
10 Best Free Gantt Chart Maker Software in 2026


Gantt Charts
Canva vs. Google Sheets for Gantt Charts: Which One Should You Use?
Templates
15 Free Gantt Chart Templates in Excel & ClickUp


Software
11 Best Free Gantt Chart Software for Mac in 2026

Microsoft Excel
How to Display a Work Breakdown Structure in Excel

Software
How to Create a Gantt Chart in Microsoft Planner
