


Still downloading templates?
There’s an easier way. Try a free AI Agent in ClickUp that actually does the work for you—set up in minutes, save hours every week.
Sorry, there were no results found for “”
Sorry, there were no results found for “”
Sorry, there were no results found for “”
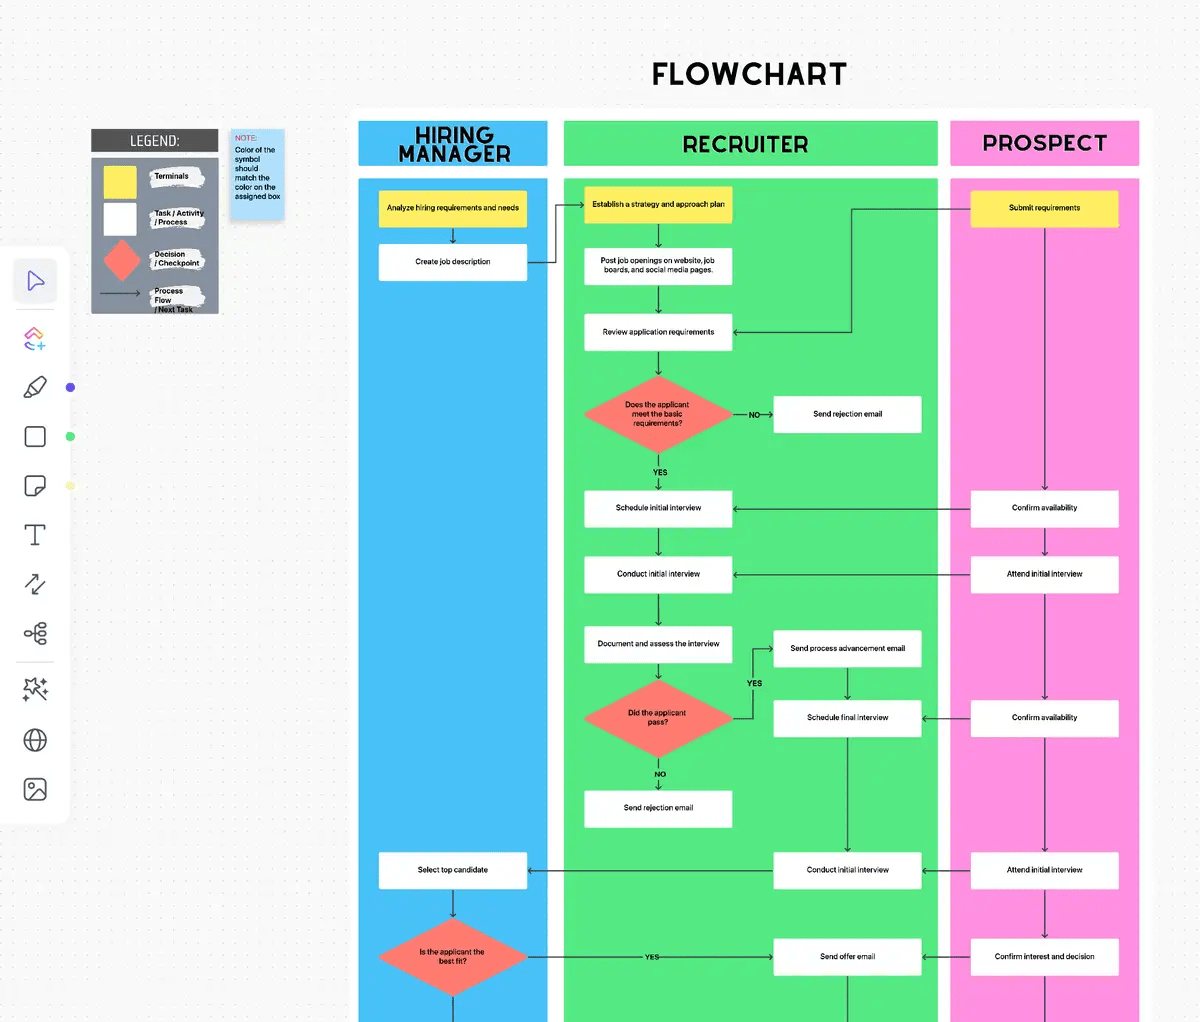
You lead the marketing team at a digital agency, and you’ve just rolled out a new onboarding process for eCommerce clients. It’s detailed and involves multiple steps, from initial contact to final approval, with key decision points along the way.
Instead of overwhelming your team with a long explanation or a bullet-point list, you decide to illustrate the process with a flowchart in PowerPoint.
Your process flow diagram is immaculate. The entire process is clearly laid out in neatly labeled steps, and your team members find it simple and easy to understand and implement.
This is the true power of PowerPoint—going beyond slides to create visuals that communicate complex ideas simply.
Did you know that 37.15% of people use PowerPoint for work or personal projects? Its versatility makes it the ideal tool for creating engaging visuals like flowcharts.
In this guide, we’ll show you how to create effective flowcharts in PowerPoint, helping you turn a complex process into a clear, easy-to-follow diagram.
Let’s start making better flowcharts.
PowerPoint offers you two main ways to create flowcharts: using a SmartArt Flowchart or working with the PowerPoint Shape Library.
We’ll walk you through both methods so you can choose the one that works best for you.
SmartArt flowchart is a pre-made collection of shapes that serve as basic, fixed diagram templates. It’s ideal for creating a quick and simple diagram but may not be suitable for more complex flowchart options.
Step 1: Open PowerPoint and navigate to the slide where you want to add your diagram

Step 2: Click the Insert tab in the top menu

Step 3: Click SmartArt from the options

Step 4: Hover over Process in the dropdown list to see various flowchart options

Step 5: Click your preferred PowerPoint flowchart template style to insert it into your slide

Pros
Cons
While this method requires more manual work, it offers greater flexibility and lets you create standard flowcharts with process and decision boxes.
Here’s how it works:
Step 1: Go to the Insert tab and click Shapes

Step 2: Scroll down to the Flowchart section in the dropdown menu

Step 3: Select the shape you need (e.g., process box, decision diamond, oval shape)
Step 4: Click and drag on your slide to draw the shape

Step 5: Repeat this process to add all the necessary shapes to your flowchart

💡 Pro Tip: To save time when creating flowcharts in PowerPoint, add a shape that you’ll use multiple times, then copy-paste it as needed.
Before you can complete your flowchart, you’ll need to connect the shapes to show the flow of steps or decisions.
Step 1: Return to the Insert tab and click on Shapes

Step 2: In the Lines section, choose the line type you prefer

Step 3: Click and drag from one shape to another to draw a connecting line

Step 4: Repeat this process to connect all your shapes in the proper sequence

Pros
Cons
Now that you know how to create a flowchart in PowerPoint, here are some expert tips for you to design effective flowcharts:
While PowerPoint is a versatile tool for creating flowcharts, it does have some limitations:
While PowerPoint remains popular for designing flowcharts, modern workplace productivity tools offer more robust and flexible solutions. These tools are part of a broader trend toward visual project management, which can significantly enhance team collaboration and project clarity.
ClickUp, an all-in-one productivity and project management tool, has some incredibly effective flowchart tools, starting with ClickUp Whiteboards.
ClickUp’s Whiteboards provide a dynamic, collaborative space for creating flowcharts and other visual diagrams. It bridges the gap between ideation and execution by offering a space for teams to visualize concepts and turn them into coordinated actions within the ClickUp platform. Here’s how:

Here are some top features of this tool:
Also Read: 10 Free Data Flow Diagram Templates
Here’s how to use ClickUp Whiteboards to create superlative flowcharts:
Step 1: Click the + View button at the top of your desired location in ClickUp

Step 2: Select Whiteboards from the options

Step 3: Choose the pre-designed Flow Chart Template or Start from Scratch

Step 4: And there you have it, your whiteboard is ready!

Check out the handy tutorial below for all you need to know about ClickUp Whiteboards.
For quicker, more informal diagram creation, ClickUp Mind Maps offers an intuitive solution. It allows you to visually represent tasks and concepts, making it easier to brainstorm (alone or with a team) and manage and organize information.
Its key functionalities include:
Overall, ClickUp’s Mind Maps enhance productivity by making project management more intuitive and visually engaging.
Step 1: Select any space, folder, or a list of tasks you want to visualize

Step 2: Click Add View and select Mind Maps

Step 3: Your work is instantly mapped into a beautiful mind map that you can expand, collapse, or build upon

This feature allows you to transform existing task structures into visual flowcharts with minimal effort, saving time and ensuring consistency across your project documentation.
If you’re new to mind mapping or want to explore different mind mapping software options, ClickUp is a great place to start. Check out these mind map examples for various use cases. And watch the video below to see ClickUp’s Mind Maps in action.
If you don’t want to start from scratch, try out process map templates. They’re a great starting point that you can customize to fit your specific needs.
ClickUp’s Process Flow Chart Template is an excellent option here.
Here are this template’s key features:
You can also try ClickUp’s Data Flow Diagram Template to simplify the creation of flowcharts.
You can create tasks with Custom Statuses like Open and Complete to track the progress of each step in the data flow process, making it easier to visualize where each element stands.
The template supports multiple views, including List, Gantt, Workload, and Calendar, enabling you to visualize your data flow in a way that best suits your needs
Using this template, you can simplify the creation of a flowchart by:
Deciding between PowerPoint and ClickUp for flowcharts depends on your specific needs and the features each tool offers. Here’s a quick guide on when to use each:
Use PowerPoint when:
Use ClickUp when:
Feel free to experiment with both to see what works best for you and your team.
The steps and tips in this guide will help you create an effective PowerPoint flowchart that breaks down complex processes, enhances communication, and streamlines decision-making. However, for those seeking more robust, collaborative, and customizable solutions, ClickUp’s Whiteboards and Mind Maps, along with its other advanced features, can enhance your flowchart creation experience.
Remember, the key to a successful flowchart lies not just in the tool you use but also in your ability to distill complex information into clear, visually appealing diagrams.
Whether you choose Microsoft PowerPoint or a more specialized platform, focus on clarity, consistency, and user-friendliness to create flowcharts that do justice to your ideas and processes.
The best flowchart for PowerPoint depends on your specific needs. However, we recommend using SmartArt for flowcharts due to its ease of use and variety of styles.
Yes, PowerPoint offers built-in flowchart templates. You can find them under the SmartArt graphics in the Process category. You might want to explore other options for a wider variety of customizable flowchart templates.
Yes, PowerPoint includes workflow templates. You can find various workflow templates in the SmartArt graphics and download additional templates from online resources.
Yes, Microsoft offers workflow templates across various products. In addition to PowerPoint’s options, you can find workflow templates in Microsoft Visio, which is specifically designed for creating diagrams and flowcharts. However, if you’re looking for more modern and versatile workflow templates, you might want to explore options beyond Microsoft’s offerings.
Most users find that creating a flowchart is generally easier in PowerPoint due to its intuitive interface and the availability of SmartArt graphics specifically designed for flowcharts. Word and Excel also support flowchart creation but may require more manual adjustments.

© 2026 ClickUp

There’s an easier way. Try a free AI Agent in ClickUp that actually does the work for you—set up in minutes, save hours every week.