


Still downloading templates?
There’s an easier way. Try a free AI Agent in ClickUp that actually does the work for you—set up in minutes, save hours every week.
Sorry, there were no results found for “”
Sorry, there were no results found for “”
Sorry, there were no results found for “”

Microsoft Excel offers many advanced shortcuts, formulas, and functions to learn and apply.
Whether you are an Excel beginner or possess moderate Excel tips, here are Excel hacks to evolve your knowledge and amp up your Excel game.
Microsoft Excel is a data analysis, visualization, and data validation spreadsheet software that helps business professionals store data and track critical business datasets with simple to advanced formulas.
Excel uses spreadsheets to optimize businesses’ data operations without affecting your data integrity.
Regardless of the type of industry, all departments, including sales, marketing, finance, operations, technology, and human resources use Excel.
While the use cases differ for each business department, knowing practical Excel hacks and tricks to generate your chosen report, dashboard, and statements will help.
If you are reading this, you must be aware of the Excel basics, like:
Since most people know how to carry out these functions, we won’t bore you with that. Let’s discuss the advanced Excel hacks to take your skills to the next level.
We have segregated the Excel hacks and tricks into three categories:
Below are the Excel keyboard shortcuts every enthusiast must know:
In situations where you want to feature numbers in a readable format, use this shortcut—add an apostrophe (‘) before the number.
When dealing with a huge dataset, if you want to select a particular portion of the data:
Want to open multiple Excel files in one go? Here’s how to do so:
Tired of right-clicking every time and clicking on ‘Paste Special’ to add missing information?
Excel sheet fills in missing information in a data series. Suppose you make a series of even numbers and fill in the first three numbers in an entire column.

Suppose a long column filled with large datasets confuses you. A great way to simplify your view is to convert these columns into rows (and vice versa). This will help you organize your entire worksheet and establish straightforward visibility.
Why go for the same old route of using ‘Paste Special’ to create the rows manually when the Transpose feature does the job?
Creating simple marketing and sales dashboards is easy with Microsoft Excel. An Excel sheet allows you to create simple bar charts, line graphs, and pie charts for selected datasets. Add a table within Excel or copy the datasets and ‘Paste Special’ to create charts.
The ‘Save as a Template’ feature lets you save chart templates for future use instead of creating them from scratch each time.

If users want to view a particular row or column, Excel allows them to filter out the remaining data from the spreadsheet.
To do this:

Want to select multiple cells from different columns or rows instead of double-clicking ‘Paste Special’ over and over?
Click on the ‘Ctrl’ key and select the specific cells.
Another great Excel hack is to format cells by:
The ‘Format Cells’ feature improves the clarity and readability of data presentation.
If you are a dedicated Excel user and open Excel files daily, customize your Excel ribbon so you don’t have to look for shortcuts every time.
📚Pro tip: Consider using pivot tables to summarize entire data quickly.
To create pivot tables, select any one of the blank cells, click on ‘Insert,’ and then Click on ‘Pivot Table.’
A pivot table and a personalized shortcut menu will help you get a detailed understanding of a complicated dataset. Adding a pivot table to Excel reports is common for sales and marketing professionals.
Bonus: AI Excel Tools!
Here is a quick glimpse into the five most useful Excel functions and how to use them:
Syntax – IF(logical_test, value_if_true, [value_if_false])
Syntax – INDEX(array, row_num, [column_num])
VLOOKUP Function Syntax -VLOOKUP(lookup value, table array, column number, Approximate match (TRUE) or Exact match (FALSE))
HLOOKUP Syntax – VLOOKUP(lookup value, table array, row number, Approximate match (TRUE) or Exact match (FALSE))
Syntax – MATCH(lookup value, lookup array, [match type])
Syntax – COUNTIF(range, criteria).
Long-range datasets tend to have duplication. For example, if you are trying to organize all datasets related to newsletter subscribers within an Excel sheet and the same person subscribes twice, there will be the same email address twice.
To identify duplicate datasets, follow these Excel tips:
Bonus: Convert Word Documents to Excel!
Business teams often deal with more than one long table array of datasets highlighting the same items. By merging these arrays into one data range, you will save time, and segmenting large volumes of datasets will be more straightforward.
One of the Excel tips to merge cells is to use the CONCATENATE function.
Syntax – CONCATENATE(text1, [text2], …)
Microsoft Excel splits datasets to focus on their exactness. For instance, it will not save the full name of an employee in one cell. It will store the name as first name in one cell and last name in the other.
Combine two similar columns by using the ‘&’ formula in Excel.
Here is the formula: =A2&” ”&B2

📚Pro tip: Remember to add the space between “ and “ to add the space between name and surname.
When searching for a particular item(s) within large datasets, opting for ‘Ctrl+F’ is not the best option. That’s because you don’t always remember the specific item name but may remember only parts of it. Manual search is also not an option, as we discuss 500+ datasets here.
In such situations, opt for the wildcard Excel characters like – Question mark(?)”, “Asterik(*)”, and “Tilda(~).
If you are a productivity addict, Excel has much in store for you. Make sure to use these simple Excel tips to level up your productivity.
Are you using Microsoft Excel as your in-house project management tool? Then, you need to learn how to add drop-down menus to your Excel sheets.
A simple drop-down list will help you to:
To add drop-down menus:

The texts will change based on the purpose of your drop-down menu. For example, if you add a drop-down menu to add assignees for each task, the text content will be the team members’ names.
When you have many datasets on your worksheet, manually scrolling from row 1 to row 1000 is not easy. To simplify your job, let us introduce you to an Excel formula that helps you reach your destination data without scrolling.
Productivity enthusiasts love colors, and what they love even more is organizing datasets with the help of different colors. Spreadsheets let you group your datasets of various sizes with relevant colors.
One of the Excel tips for color-coding your datasets is conditional formatting.
Productivity enthusiasts love creating to-do lists. Striking off the tasks we have completed is the best thing to do after a hectic workday.
And here is an underrated Excel hack to convert your spreadsheet into a to-do list tracker – by adding checkboxes.
📚Pro tip: Can’t find the ‘Developer’ data tab? Do this:
Make the most of your Excel spreadsheets with the following Excel tips:
Microsoft Excel Add-ins are often unused and end up slowing down your spreadsheets. It is a good idea to disable unused add-ins to optimize the performance of your entire sheet.
Plan your Excel formulas so they don’t refer too much to backward and forward referencing. Frequent forward and backward referencing will result in deferred calculations in situations with complicated calculations and too many formulas.
Links between your Excel spreadsheet or selected cells are often broken.
With multiple workbooks and a large dataset, they are challenging to find and fix. Minimize the number of links and practice opening all links before starting your Excel operations to stay on track.
Instead of pasting an unstructured table that doesn’t represent the dependent and independent variables, keep the tables as structured as possible. This will result in fewer performance disadvantages and more accurate outputs.
VLOOKUP might be easy, but INDEX and MATCH functions do the same calculations with greater flexibility. Once you use the MATCH function, it stores the results in a blank cell and lets you reuse it multiple times in INDEX statements.
However, this feature is not available with VLOOKUP.
Unstable formulas like NOW and OFFSET recalculate the entire calculation for the slightest change in the Excel sheet.
If you try to pull data from newer sources, these formulas tend to crash the overall formula and might display an error message. This will help you keep your data security intact.
Sometimes, we keep unused formulas within a spreadsheet. These formulas slow down the Excel application and result in delayed outputs. Consider auditing your entire sheet occasionally and replacing unused formulas with static values.
Now that you know Excel’s advanced shortcuts, formulas, and functions, let me tell you a bitter truth you have probably realized already—working on Excel is not always the best feeling.
Excel has a lot of limitations, and here are a few:
📮 ClickUp Insight: Nearly 42% of knowledge workers prefer email for team communication. But it comes at a cost. Since most emails only reach select teammates, knowledge stays fragmented, hampering collaboration and quick decisions. To improve visibility and accelerate collaboration, leverage an everything app for work like ClickUp, which turns your emails into actionable tasks within seconds!
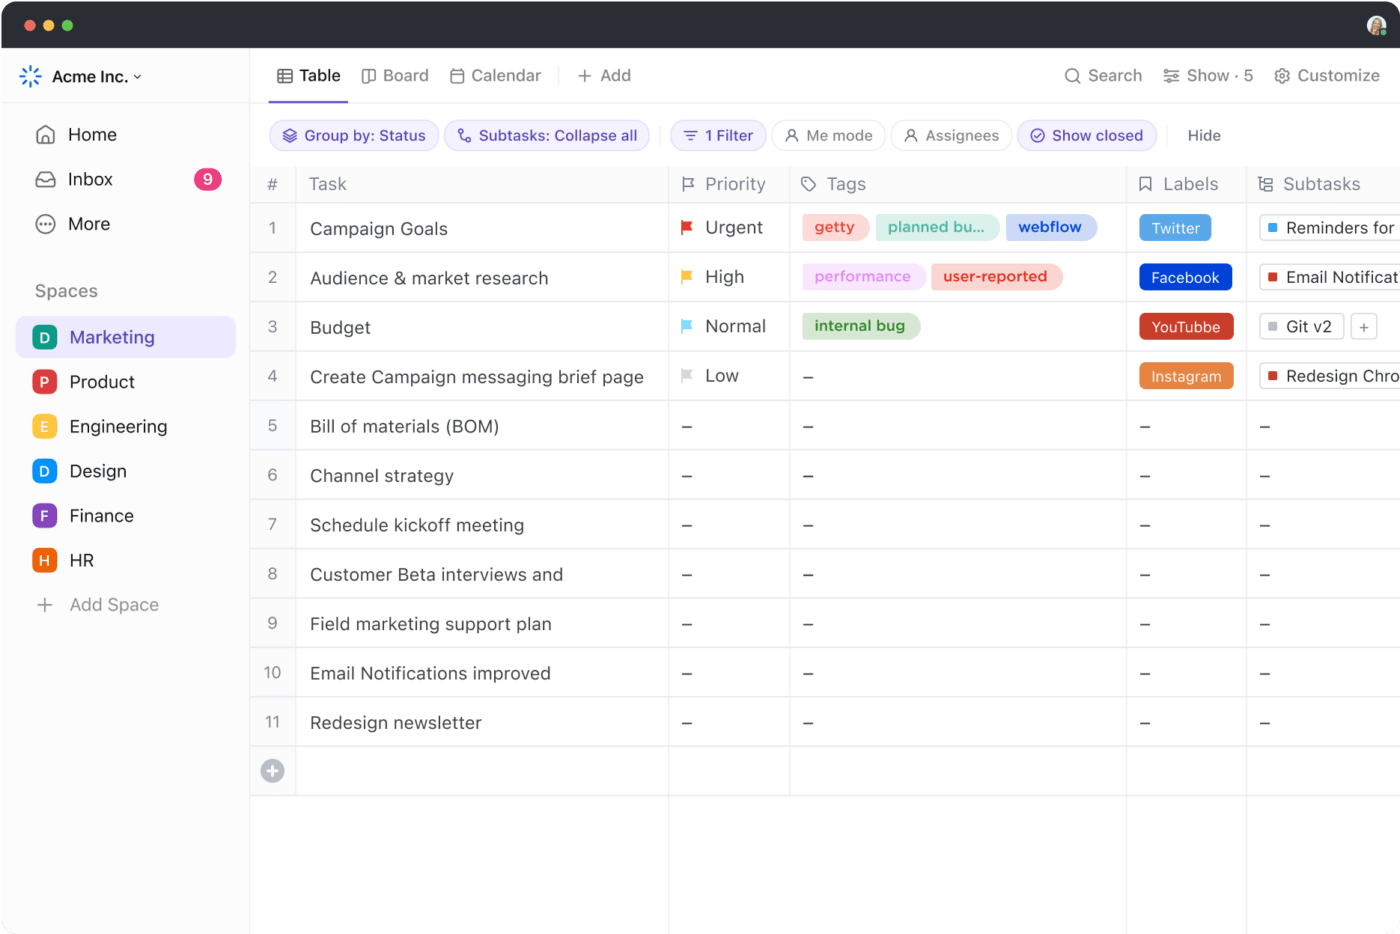
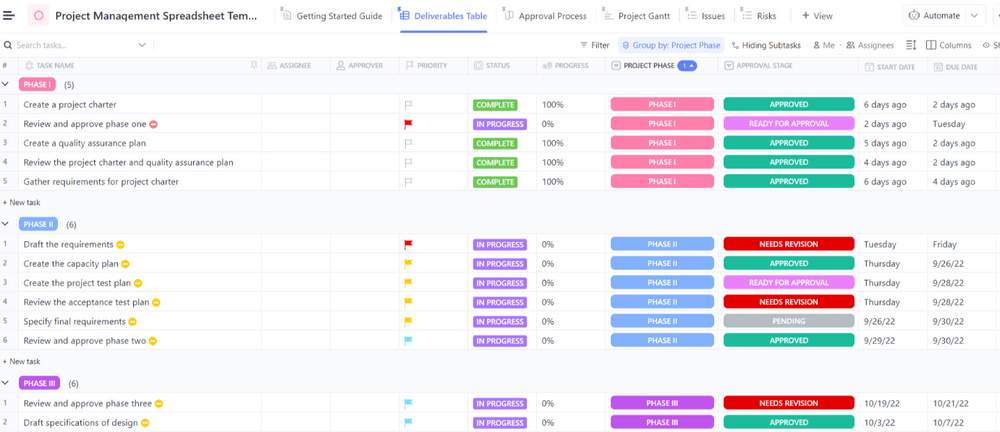
If Excel is not working for you, it is time to select an Excel alternative, and we have the best recommendation for you—ClickUp.
Here are some features ClickUp users love:

Looking for an Excel alternative to make your job easier?

© 2026 ClickUp

There’s an easier way. Try a free AI Agent in ClickUp that actually does the work for you—set up in minutes, save hours every week.