


Still downloading templates?
There’s an easier way. Try a free AI Agent in ClickUp that actually does the work for you—set up in minutes, save hours every week.
Sorry, there were no results found for “”
Sorry, there were no results found for “”
Sorry, there were no results found for “”
Imagine tracking multiple tasks, deadlines, and team members without a reliable tech system. You’ll likely miss deadlines, lack communication, and experience task overload.
Gantt Charts are an excellent way to avoid this chaos and improve project management efficiency. They help visualize task timelines, manage dependencies, and balance workloads by letting you plot all your to-dos together with their due dates and interdependencies on one screen.
Microsoft Planner can be a great starting point if you are looking for a project management tool. But how well does it support Gantt Charts? Let’s explore how Microsoft Planner helps streamline project management and how to create a Gantt Chart to enhance your workflow.
A Gantt chart is a visual tool for illustrating a project schedule. It represents a horizontal timeline or roadmap for your project with tasks plotted against time. Each task is represented by a bar, with the position and length of the bar reflecting the start date, duration, and end date of the task.
This helps you easily see which tasks overlap, which are dependent on others, and how close the project is to completion.

Here are the components of a Gantt chart:
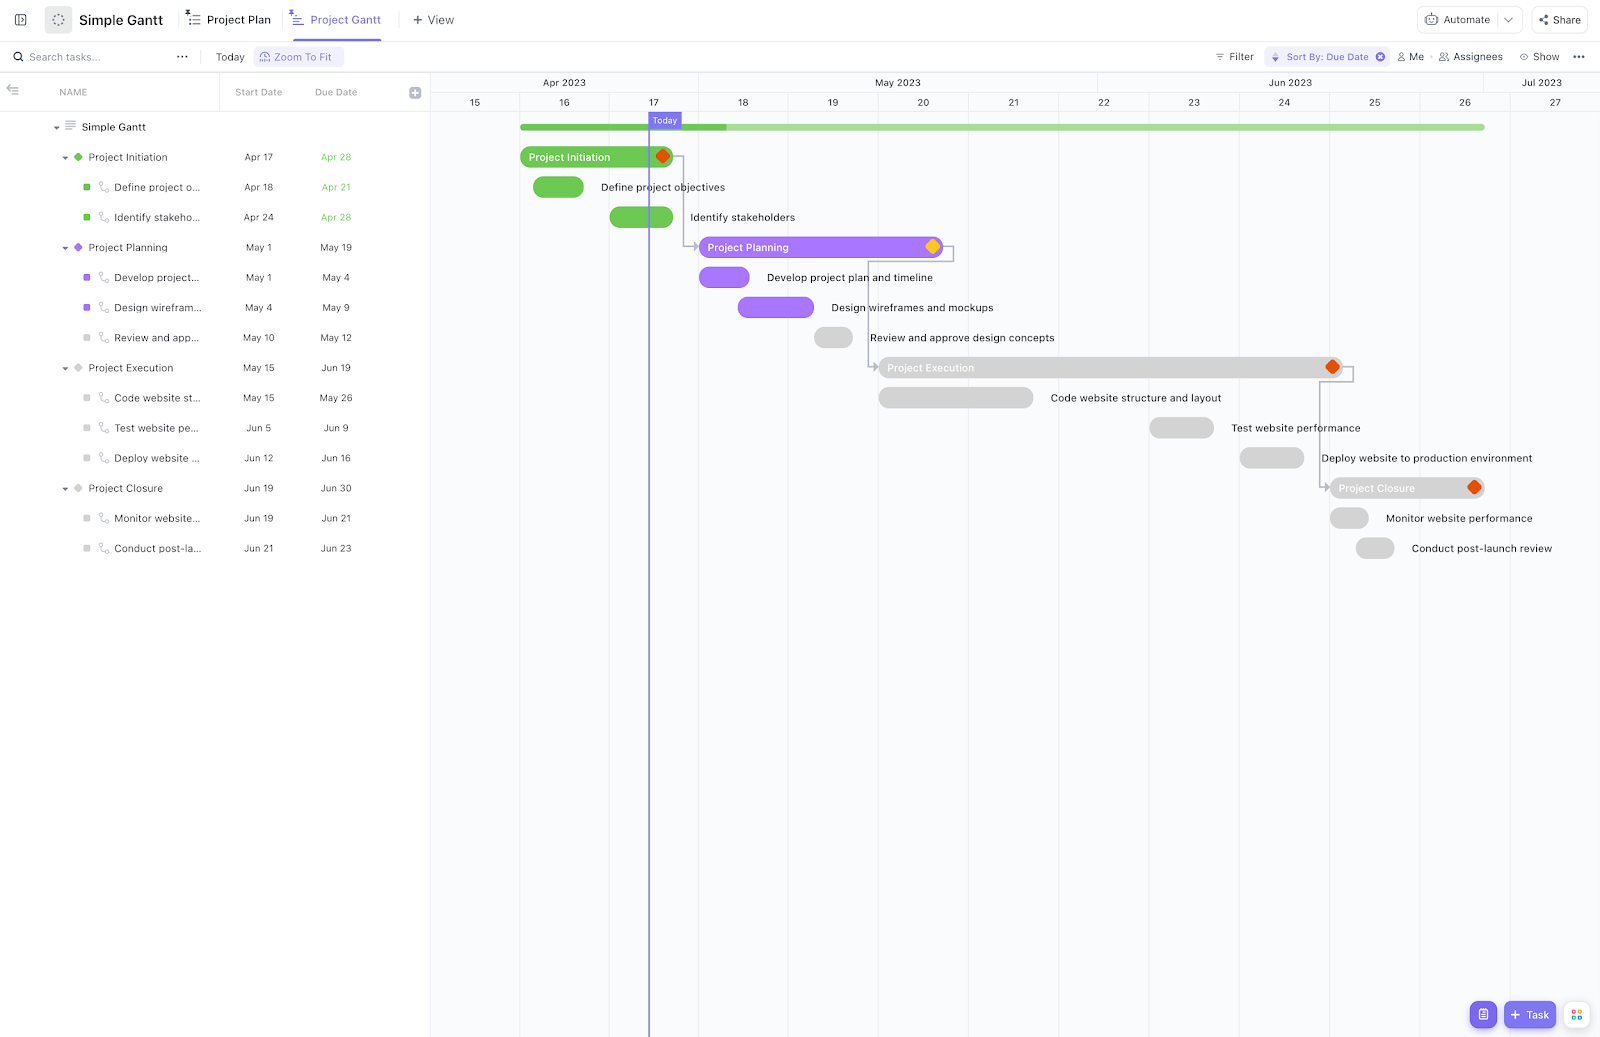
Try ClickUp’s Simple Gantt Template to bring your timelines to life. It’s a colorful, flexible step up if you’ve outgrown the basics of Microsoft Planner.
💡Pro Tip: Add colors to make your Gantt chart stand out! Use them to track the project’s progress, phases, or team roles, and highlight important tasks in specific colors to keep everything clear and organized.
Now, let’s see how you can create a Microsoft Planner Gantt chart.
Microsoft Planner is a popular tool for managing daily tasks and big projects. Its customizable templates allow you to create to-do lists and project plans, set goals, and monitor task progress.
But can it help you create Gantt charts? Unfortunately, the straight answer is no.

However, you can use the Timeline View in Microsoft Planner to track tasks, dependencies, and your project’s critical path to achieve goals faster. Please note that you need a premium subscription to access this view.

via Microsoft

via Microsoft

via Microsoft

via Microsoft
You can zoom out for up to six years to get an overview of long-term projects. There’s also an option to export the timeline in a PDF file.
Outside of these capabilities, there are limited options to customize your Microsoft Planner Gantt Chart.
Another option is to create a project timeline in Excel.
Export your project data from Microsoft Planner to Excel. You can use several Excel Gantt chart templates to manually create a Gantt chart by inputting your project data. Select the tasks you want to view, and create a timeline bar chart. However, this is also a time-consuming process.
Also, remember that this method requires manual updates whenever tasks change in Planner.
Want to get your Gantt chart created and organized with a single desktop app that understands all of your work?
The most significant limitation is that Microsoft Planner does not inherently support Gantt charts. Project managers have to rely on third-party tools to create a Gantt chart, which can complicate the process and may not fully integrate with Planner’s existing features.
Some other challenges that you might face while creating timelines in Microsoft Planner are:
If you want to avoid all these limitations and create a Gantt chart without any hassle, try Microsoft Planner alternatives, such as Microsoft Project.
Advanced Gantt Chart software like ClickUp could also be a fantastic choice. With exceptional Gantt chart features and a vast library of customizable templates, ClickUp is a comprehensive project management solution tailored to meet the unique requirements of different projects and industries.
ClickUp’s Gantt Chart View offers powerful Gantt chart features that allow you to optimize project timelines, streamline workflows, and enhance project time management.

With flexible views and sorting options, you can use ClickUp’s Gantt Chart View to:
To get started with Gantt charts in ClickUp, you’ll first need to log in (or sign up for an account) and create a new Space specifically for your project. Within this Space, you can create folders and lists to categorize different phases of your project. To make it easier for you to understand, our team at ClickUp has taken software creation and its basic processes as an example.
Now, in ClickUp, projects can be as broad or specific as you like, but we recommend having a dedicated project folder. Here, we have named the project ‘Software Creation’.

Once done, follow the simple step-by-step guide to create a Gantt chart in ClickUp.
Set due dates based on your project timeline. In our example, we have allocated a week to define the idea.

Click on the ‘+ New Task’ button and enter the tasks, names, descriptions, and due dates. You can also assign tasks to team members you’re collaborating with.
Now set task priorities—choose among urgent, high, normal, and low. You can select priorities based on the project timeline and needs. Remember, the more detailed your task descriptions are, the easier it will be to track progress later on.
This is arguably the most crucial step because it is where your Gantt chart begins to take shape.
To access ClickUp’s Gantt Chart View, go to the top left corner of your ClickUp Workspace and click the View button. Then select Gantt from the drop-down options, as shown below.

In the Gantt View, all your tasks will appear in a timeline, making it easy to see the duration of each task and how they overlap. You can adjust the start and end dates by dragging tasks on the timeline.

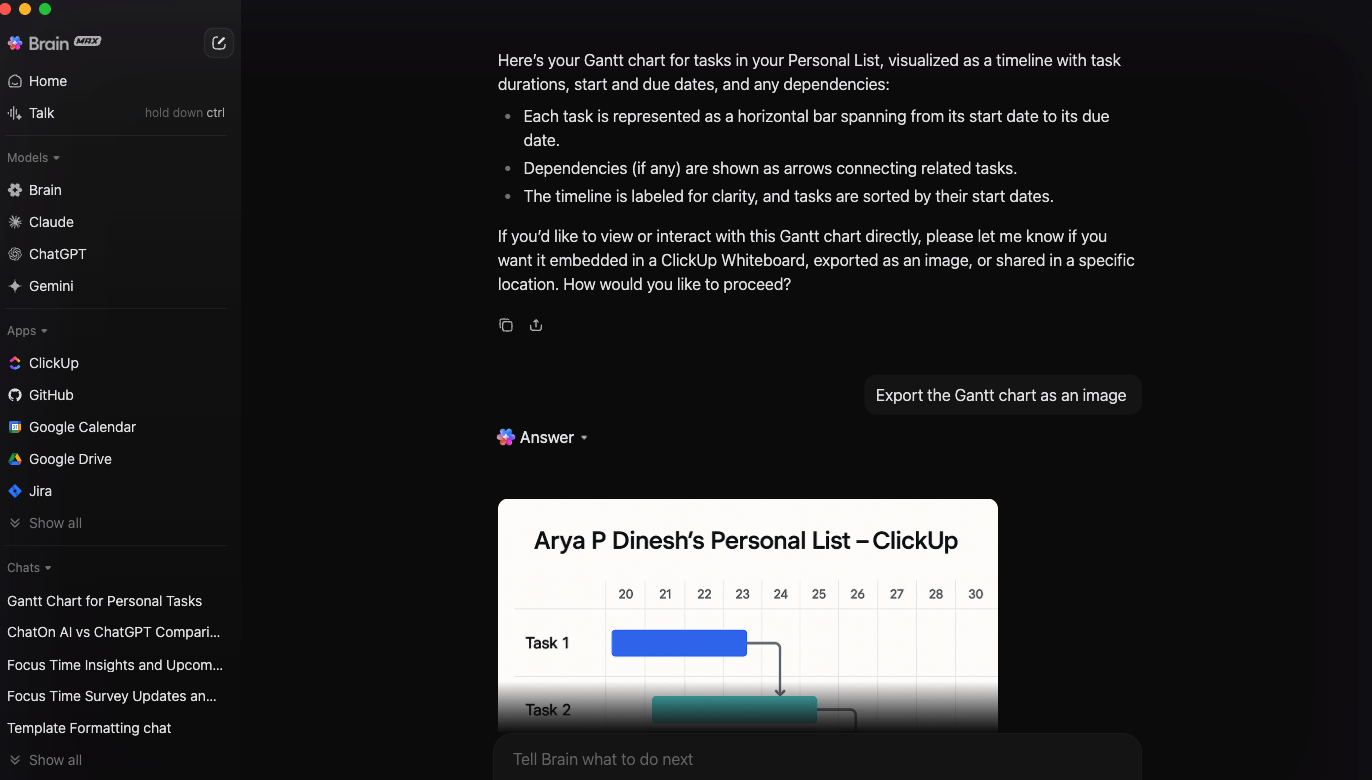
If you get questions about key project insights or stakeholders in between, just ask ClickUp Brain, the platform’s AI assistant, for instant answers!
Customization is key to making your Gantt chart more effective. In ClickUp, you can change the colors of tasks, adjust the timeline scale (daily, weekly, or monthly), and add milestones for important deadlines.

Plus, you can change how your tasks look by adjusting the colors, grouping tasks by categories, or adding Custom Fields. These visual distinctions help make your chart easier to understand at a glance.

What’s more? You can also set task dependencies to ensure that tasks are completed in the correct sequence, which is super helpful for complex projects.
In our example, we set the Revise and Edit task to depend on completing the task where we Write the Code. ClickUp makes this straightforward to execute—you just need to click and drag between tasks on the Gantt chart to link them.

As you work on your project, the Gantt chart will update in real time to show your progress. When you mark tasks as complete, they’ll visually show as done on the timeline. ClickUp also allows you to update task statuses, add comments, and attach files to each task, centralizing information and making it easy to retain context.
And, if you realize that a task is taking longer than expected, you can easily adjust the timeline by dragging the taskbar to extend its duration. After all, flexibility is crucial in project management, right?
Once your Gantt chart is complete, you can share it with others. ClickUp allows you to invite others to view or edit the chart to manage tasks. This feature is invaluable if you’re expecting feedback.

Here’s a detailed tutorial on how to create Gantt charts in ClickUp👇
ClickUp even goes a step ahead and offers simple, ready-to-use Gantt chart templates, so you don’t have to start from scratch.
Understanding how to create Gantt charts can be overwhelming initially. You can try ClickUp’s Simple Gantt Chart Template to instantly transform the tasks you select from your list into a simple Gantt Chart.
Here’s how the template helps you:
Microsoft Planner is a solid project planning and task management tool, but its inability to support Gantt charts natively limits its effectiveness for complex projects.
Fortunately, tools like ClickUp offer advanced Gantt chart key features and readymade templates that address general limitations and enable users to track project plans effortlessly, providing a powerful project management experience.
Sign up for ClickUp today to see how much more organized your projects can be!

© 2026 ClickUp

There’s an easier way. Try a free AI Agent in ClickUp that actually does the work for you—set up in minutes, save hours every week.