

You’re not alone if you’ve ever wondered about the difference between revenue and income. Both provide a deeper insight into your company’s financial health and performance metrics.
While they’re often used interchangeably, they represent different aspects of your financial performance.
Ready to clear up the confusion between these two terms in business finance?
Let’s examine what distinguishes revenue and income so you can confidently navigate your financial discussions and make informed decisions for your business.
What Is Revenue?
Revenue is the total money a company earns from selling goods or services. It’s a vital indicator of a company’s financial performance and assesses its overall health and growth potential. Plus, it’s called “top-line” as it appears first on the company’s income statement.
Revenue is classified into four types:
- Gross revenue: Also known as gross sales, this is the total amount a business generates from all its operations. For example, if a bakery earns $10,000 from selling cakes, bread, and pastries in a month, this total amount is the gross revenue
- Net revenue: The amount left after subtracting allowances, discounts, and returns from gross revenue is called net revenue or net sales. It provides a clearer picture of a company’s income from its sales and operations. Out of the $10,000 earned, if $1,000 is given as discounts and $500 is refunded for returned items, the bakery’s net revenue is $8,500
- Operating revenue: This includes total cash inflows from the company’s core business activities, excluding any income from non-core activities like investments or asset sales. $8,500 represents the operating revenue of the bakery since it’s from their main business
- Non-operating revenue: This is the income from secondary sources, such as interest earned on investments, dividends received from stock holdings, or rental income from property leases. The bakery also earns $500 by renting out a small space in their shop to a local artist. This $500 is non-operating revenue
What Is Income?
Income is the amount that remains after all expenses, taxes, and costs have been deducted from total revenue. It reflects the company’s profitability and is often called the “bottom line.”
There are mainly four types of income:
- Gross income: Also known as gross profit, this includes the company’s total earnings from its core business activities before subtracting expenses. For example, a clothing store earns $50,000 from selling clothes in a month. Before subtracting any expenses, this $50,000 is the gross income
- Operating income: This is the amount left after subtracting operating expenses such as wages, rent, and utilities but before accounting for taxes and interest. Out of the $50,000 earned, the store spends $20,000 on wages, rent, and utilities. The remaining $30,000 is the operating income
- Net income: This is the final profit after all expenses, taxes, interest, and other costs have been deducted from total revenue. After subtracting $5,000 in taxes and interest from the $30,000 operating income, the store’s net income is $25,000
- Non-operating income: This includes earnings from activities not related to the core business operations, such as interest income, dividends, or gains from asset sales. The clothing store also earns $1,000 from interest on savings and $2,000 from selling old equipment. This $3,000 is non-operating income
Calculating Revenue vs. Income
Before we dive into the calculations, it’s important to understand the difference between revenue vs. income for effective financial analysis and decision-making.
| Difference | Revenue | Income |
| Scope | It encompasses all earnings from business activities without any deductions | It reflects what remains after all expenses, taxes, and costs are deducted from revenue |
| Position in financial statements | It appears at the top of the company’s income statement | It appears at the bottom of the company’s income statement |
| Implications | It helps in assessing the business’s capacity to generate sales and indicates market performance | It provides insight into the actual profitability and financial sustainability of the business |
| Management focus | It focuses on increasing sales, expanding market reach, and enhancing customer acquisition | It focuses on cost management, efficiency, and maximizing profit margins |
| Financial health indicator | A high revenue figure indicates strong sales but does not guarantee profitability | A positive net income indicates profitability and efficient management of expenses relative to revenue |
| Tax implications | Revenue itself does not directly affect taxes | Income is used to calculate taxable income and tax liability |
How to calculate revenue?
Calculating revenue is straightforward. Here’s how to do it:
1. Identify the total quantity sold: Determine the total number of units sold for a product or service within a given period
2. Determine the unit price: Find the average selling price per unit of the product or service
3. Calculate gross revenue: Multiply the total quantity sold by the unit price to obtain the gross revenue
Gross revenue = Number of goods sold X Sales price
Imagine you own a bookstore. Over the month, you sell 800 books at an average price of $20 each. Your gross revenue would be:
800 books X $20 per book = $16,000
4. Subtract deductions: Subtract any discounts, allowances, and returns from the gross revenue to arrive at the net revenue
Net revenue = Gross revenue – Discounts – Allowances – Returns
Continuing the previous example, let’s say you offer:
- Discounts: $500 (given on bulk purchases)
- Allowances: $200 (for damaged books)
- Returns: $300 (for returned books)
Your net revenue will be:
$16,000 – $500 – $200 – $300 = $15,000
How to calculate income?
Calculating income, or net profit, involves the following steps:
1. Calculate total revenue: Start with the total revenue or sales the company has earned. This includes all income from business operations and other sources, including:
- The sale of assets
- Fees and service charges
- Subscriptions
- Rental income
- Advertising
2. Calculate total expenses: Add up all business expenses, which typically include:
- COGS (Cost of goods sold): Direct costs related to producing or purchasing the products sold
- Operating expenses: Costs associated with running the business, such as rent, utilities, salaries, and marketing
- Depreciation and amortization: The reduction in value of tangible and intangible assets over time
- Interest expenses: Costs of borrowed funds
- Taxes: Income taxes owed to the government
3. Calculate net income: Subtract the total expenses from the total revenue to get the net income
Net Income = Total Revenue − Total Expenses
Let’s say your bookstore has the following financial details for the month:
- Total revenue: $15,000
- COGS: $5,000
- Operating expenses: $4,000 (includes rent, utilities, salaries)
- Depreciation: $500
- Interest expenses: $200
- Taxes: $800
Net Income for the month is:
$15,000 − $10,500 ($5,000 + $4,000 + $500 + $200 + $800) = $4,500
Effective financial management helps you distinguish between revenue and income, ensuring a clear understanding of your business’s true financial health.
Streamline Your Financial Management with ClickUp
ClickUp is a versatile financial management tool that goes beyond basic task management by offering a range of features designed to help you track financial goals, manage accounts, and calculate profits.
With ClickUp Dashboards, you can easily create high-level reports to get a clear view of where your money is going. And monitor budget allocations, actual spending, and profit and loss—all in one place.
It also provides real-time updates, so you’re always up-to-date on your financial performance. No more waiting for monthly reports; get instant insights as things change.
Customizable widgets let you tailor your dashboard to highlight key performance indicators—like total revenue, net income, and expenses—exactly how you want. This keeps your financial overview sharp and on point.
ClickUp Goals lets you set clear revenue and income targets, making your financial objectives easy to track and on target.

It offers various target types that cater to different financial tracking needs. Create numerical targets for specific figures, like “Increase monthly sales by 20%,” or set monetary targets to track revenue goals. Use true/false targets for simpler tasks, such as “Complete financial audit” or “Finalize budget approval.”
Aligning team efforts becomes a breeze, as everyone can see the same goals and work towards achieving them together.
Effortlessly Manage Finances with ClickUp Templates
ClickUp provides a variety of templates to streamline your financial processes. Here are some key templates to consider:
1. ClickUp Accounting Template
Find managing expenses, sales records, and invoices overwhelming?, Use ClickUp Accounting Template to simplify the process.
This bookkeeping template helps you effortlessly track payments you owe (accounts payable) and payments you expect (accounts receivable). It also covers client names, contacts, invoice numbers, and payment methods.

This template provides various custom views to help you stay on top of your finances, such as:
- List View: To organize your invoices and expenses for a quick overview
- Calendar View: To track due dates and payment schedules
- Grid View: To compare invoices and expenses side by side
- Board View: To manage tasks by moving them between columns like “To Do” and “Completed”
In addition, the Category field lets you sort invoices by type—whether they’re rent, services, or products. The Notes feature lets you add extra details or reminders about each invoice.
Plus, set a confidence level to gauge the likelihood of payments and collections. This will help you spot and fix potential cash flow issues before they become problematic.
💡Pro Tip: ClickUp Brain, ClickUp’s AI assistant, helps you harness the power of AI for personal finance management.
2. ClickUp Financial Analysis Report Template
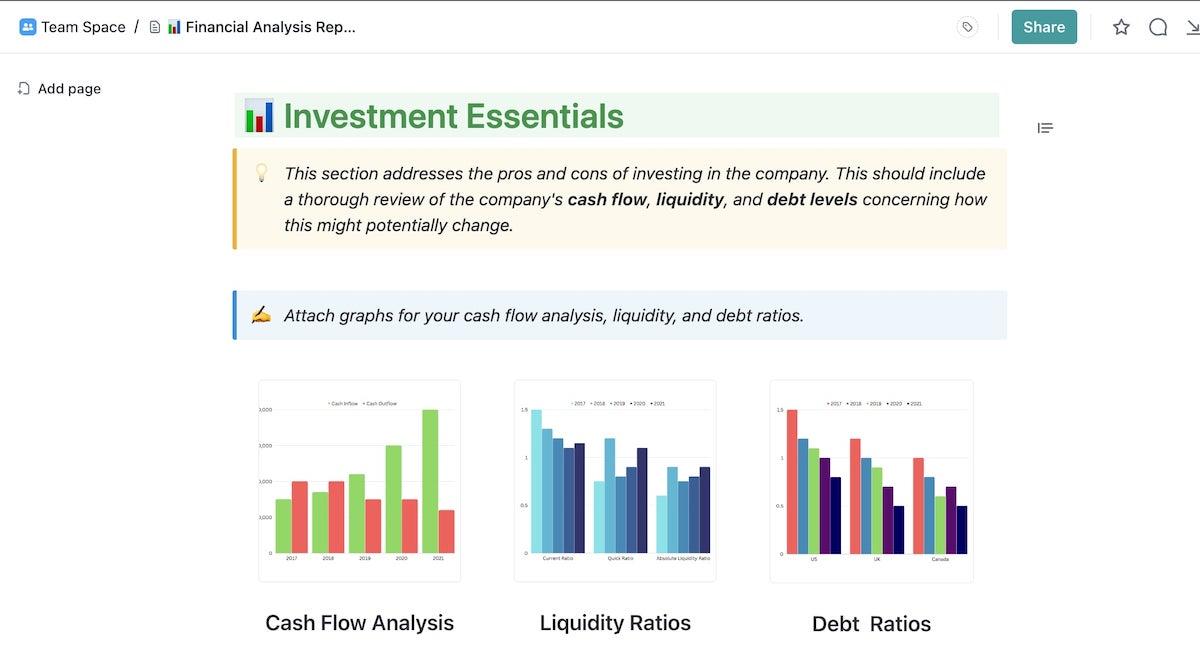
ClickUp Financial Analysis Report Template is a robust tool for evaluating a company’s competitive strengths and weaknesses.
It lets you:
- Identify key financial indicators for smarter decisions
- Summarize your financial performance clearly
- Compare your performance against industry standards
- Spot opportunities to boost efficiency and cut costs
It also features visual aids—like graphs and charts—that provide clear snapshots of cash insights flow, liquidity ratios, balance sheets, and debt ratios. This allows users without a finance background to grasp complex financial data easily.
You can also set custom permissions to control who can view or edit the data. The screen recording feature—Clickup Clips captures financial review sessions, keeping everyone on the same page and ensuring nothing is missed.
3. ClickUp Budget Report Template
The ClickUp Budget Report Template simplifies your budget reporting with precision. It eliminates guesswork and scattered data, giving you everything needed to keep your finances in check and optimize your project budget.

Ideal for both small businesses and large enterprises, this template:
- Gives you a clear view of past and present financial performance
- Pinpoints discrepancies between planned and actual spending
- Tracks progress against your goals
The List View lets you see all your budget entries in a straightforward, easy-to-read format. The Gantt View tracks project timelines and financial milestones, while the Calendar View visualizes your budgetary activities and deadlines.
Moreover, the budget summary includes five key financial aspects for a comprehensive view of your business’s financial performance:
- Profit and loss: Provides a comparison of projected and actual revenues and margins
- Sales breakdown: Details actual versus target sales figures by region
- Expenses: Tracks and compares operational expenses against the budget
- Balance sheet: Analyzes revenue against expenses to assess financial stability and performance
- Competitive summary: Benchmarks your revenue and market share against top competitors
4. ClickUp Sales Tracker Template
The ClickUp Sales Tracker Template is your all-in-one solution for keeping your sales processes organized and efficient.
With its user-friendly interface, you can track individual and team performance in real time, pinpoint where to focus your sales efforts, and make data-driven decisions to optimize your pipeline.

It includes several Custom Fields to capture the crucial details of each sale. For example:
- Track the ‘Shipping Cost’ to know how much you’re spending on delivery
- Flag any products that have been returned with the ‘Are there returns’ filed
- Record how much it costs to produce each item using ‘Unit Cost’
- Set your desired profit margin for each sale using ‘Profit Target’
The template includes several custom views to monitor your sales KPIs. The Sales Tracker View provides a detailed look at each product’s performance, while the Sales Volume per Month View helps you track sales trends over time.
You can also use custom statuses for a quick, clear view of where every sale stands.
With the above templates and project accounting tools, you can be assured of keeping track of your venture’s financial progress and meeting your revenue goals with ease and clarity.
What’s More Important: Revenue or Income?
Although income comes from revenue, most financial management professionals consider it more important. Here’s why:
- Expense management: Income reflects how effectively a company controls its expenses and maximizes its revenue to generate a profit
- Reinvestment potential: A strong income figure indicates the company’s ability to reinvest in itself, fund growth initiatives, and enhance business operations
- Operational health: Income demonstrates whether a company can cover its operational costs, pay dividends, or invest in future growth
- Investor and lender appeal: A company with strong income is more attractive to investors and lenders as it demonstrates profitability and financial stability
While revenue provides valuable insights into a company’s sales performance, income is the more telling metric when assessing overall financial health, operational efficiency, and long-term sustainability.
Can Income Be Higher than Revenue?
Under normal circumstances, income cannot exceed revenue because income is derived after subtracting expenses from revenue. However, specific scenarios can make it happen:
1. Non-operating income: A company might show net income higher than revenue if it secures substantial gains from non-operating sources, such as interest income, profits from asset sales, or returns on investments.
2. One-time gains: Sometimes, accounting adjustments or one-time gains—like insurance payouts or litigation settlements—lead to net income exceeding the company’s revenue. Unusual financial events, like large tax refunds or asset sales, which are not part of regular operations, can also contribute to this situation.
3. Revenue recognition issues: Sometimes, aggressive revenue recognition practices, such as recording revenue from long-term contracts before the work is completed or booking revenue from sales before the product is delivered, can temporarily inflate reported income.
Revenue vs. Income Examples
Let’s look at how revenue and income differ in real life:
1. Microsoft: In fiscal year 2023, Microsoft generated revenue of approximately $211 billion from various business segments, including cloud services like Azure, software products like Windows and Office, and hardware sales from devices like Surface. On the other hand, its operating income for the same period was around $88 billion.
The difference between these figures highlights Microsoft’s operational efficiency and capacity to turn a significant portion of revenue into profit.
2. Netflix: Netflix generated approximately $33.7 billion in revenue in 2023, largely due to its vast global subscriber base and content offerings. However, the company’s net income for the same period was around $5.4 billion.
Netflix’s net income is far lower than its revenue because it invests heavily in creating original content, acquiring licenses, and maintaining its streaming technology. Additionally, substantial spending on marketing and promotions to attract and retain subscribers impacts profitability.
Supercharge Your Revenue vs. Income Tracking with ClickUp
Understanding the difference between revenue and income is essential for savvy financial management. ClickUp is the ultimate tool for tracking and managing your finances seamlessly.
ClickUp Dashboard’s real-time updates allow you to visualize key metrics like total revenue and net income, ensuring that you stay informed and make data-driven decisions.
Use ClickUp Goals to set clear revenue and income targets and align your team with your financial objectives. Customizable templates like the Accounting Template and Budget Report Template help streamline your financial processes and ensure nothing slips through the cracks.
Get started with ClickUp today and take control of your finances effortlessly.
Frequently Asked Questions
1. Is total income the same as gross revenue?
Gross revenue refers to the total earnings from sales before any deductions, while total income is what’s left after all expenses, taxes, and costs have been subtracted from the revenue.
2. Is revenue always profit?
No. Revenue is the total money generated from sales, while profit shows how much of that revenue is retained after covering all expenses, including operating costs, taxes, and other deductions.
3. Is my total income my gross income?
Not necessarily. Gross income typically refers to earnings before deductions, such as taxes and other expenses. Total income is a broader term that includes all sources of income, both before and after deductions, depending on the context.
4. Is revenue the same as income?
Revenue and income are related but not the same. Revenue is the total amount earned from sales, while income generally refers to the profit or net income after subtracting all expenses from the revenue.

Everything you need to stay organized and get work done.
