
Sorry, there were no results found for “”
Sorry, there were no results found for “”
Sorry, there were no results found for “”
You’re hitting growth targets one quarter and missing them the next.
Forecasts look solid on paper, but reality doesn’t match up. Reps are busy—deals are “in progress”—yet revenue feels sluggish.
This is the pain point that keeps rearing its head in boardrooms and revenue check-ins: a lack of visibility into what’s really happening in the sales pipeline.
Maybe you’re a VP of Sales, tired of surprises. Maybe you’re in RevOps and can’t get clean data for your dashboards. Maybe your team is booking discovery calls, but deals are stalling, and you don’t know why.
That’s where sales pipeline metrics come in.
They give you more than just numbers. They give you insight into rep performance, pipeline health, more accurate sales forecasts, and improve the overall sales performance.
In this blog, we break down sales pipeline metrics to the bare bones with real-life examples, formulas, expert tips and more!
Sales pipeline metrics are the data points that help you measure, monitor, and manage the performance of your sales pipeline.
They tell you how leads move through each stage of the pipeline, how healthy your pipeline is at any given moment, and how likely you are to hit your revenue goals.
Think of your pipeline as a funnel, with leads coming in at the top and closed deals coming out the bottom. Pipeline metrics track everything that happens inside that funnel: how many leads enter, how quickly they move, how many drop off, how long they take to close, and how much revenue they represent.
🌻 Example: Let’s say your team has 100 open opportunities worth $1.2 million. You close 25 of those deals in a quarter, totaling $300,000 in revenue. That gives you a win rate of 25%, an average deal size of $12,000, and a pipeline coverage ratio of 4:1 (pipeline value is 4x your quota).
With just a few metrics, you can now determine whether your team has enough pipeline to hit the next target and whether they’re converting fast enough to do so.
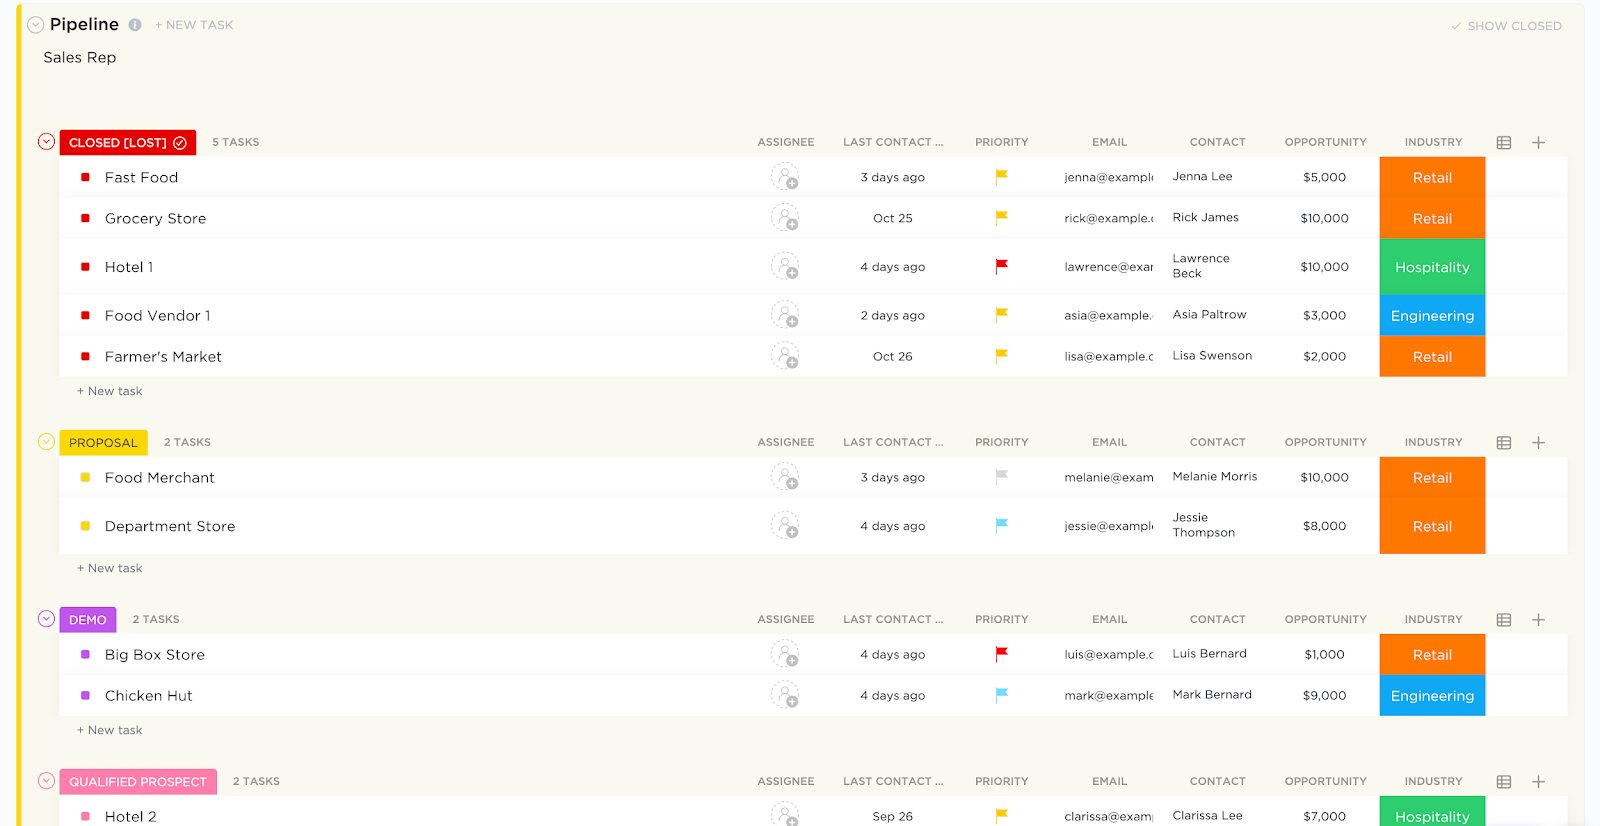
The ClickUp Sales Pipeline Template is your all-in-one solution for tracking leads, managing deals, and closing sales faster. With customizable stages, smart automation, and easy-to-use views, it helps sales teams stay organized and focused every step of the way. Whether you’re nurturing new prospects or following up on renewals, this template keeps your entire pipeline clear, actionable, and right at your fingertips.
If you’re in sales leadership, RevOps, or running a quota-carrying team, you know this already: activity doesn’t always equal progress, and a full pipeline doesn’t always mean predictable revenue.
That’s where pipeline metrics change the game, because they reveal what’s actually happening inside your sales process.
You might have a dozen reps hitting their activity KPIs—calls made, meetings booked, demos scheduled. But, deals are stalling or vanishing before they close.
Is it the quality of the leads? Are reps pushing deals too early? Are the specific stages dragging? Pipeline metrics show you where deals consistently fall off.
For example:
You grab onto the same old metrics like how many calls people are making and how many meetings they’re taking. If people are working hard but you’re not seeing the results you want, it’s impossible to know where to intervene. You end up giving people more time to figure things out, until it’s too late.
Every sales leader has faced this moment: the team says, “We’ve got $2 million in the pipe”, but by EOW, you’ve barely closed half that. The gap? Poor pipeline visibility.
Metrics like pipeline coverage ratio, deal stage aging, and opportunity-to-win rate help you validate the quality and closability of what’s in the pipeline. They separate “in pipeline” from “likely to close.”
That means better forecast accuracy, fewer surprises in QBRs, and more credibility with the C-suite.
Coaching without metrics is like flying a plane without instruments. You can try, but you won’t land safely.
For example:
You don’t need to wait for a miss to start fixing performance. The right metrics give you a dashboard of leading indicators to proactively coach and course-correct before the quarter slips.
🧠 Fun fact: The concept of the “ABC” of sales — “Always Be Closing” — became popular because of a movie. It was made famous by Alec Baldwin’s character in the 1992 film Glengarry Glen Ross. While it’s a memorable line, modern sales strategies often focus more on relationship-building and solving customer problems than just closing deals.
Think of your revenue as an outcome of a process. Metrics let you work backward from target numbers to the activities and conversion rates needed to get there.
For example:
You now know you need 250 qualified opportunities to hit your goal, and how much pipeline coverage you need to build each month to stay on track. It transforms goal-setting from aspiration into math.
When execs ask: “Should we invest more in outbound? Hire another AE? Move upmarket?” — pipeline metrics give you the evidence, not just opinions.
Bottom line: Sales pipeline metrics aren’t just helpful — they’re foundational. They give you the visibility, control, and insight to build a sales process that actually scales, not one that burns out your team chasing numbers that don’t move.
Not all sales pipeline management metrics are created equal.
Some give you insight, and others give you noise. These nine are the core pipeline metrics that sales leaders, RevOps teams, and revenue strategists need to track consistently and contextually to understand where deals stand and how the pipeline is trending.
What it is: The total dollar value of all open opportunities in your pipeline.
Formula: Σ (Deal Value × Probability of Closing)
If you have three deals:
The calculation would be:
Why it matters: This is your starting point. Pipeline value gives you a top-level view of how much potential revenue is in motion. But alone, it’s not enough — it needs to be paired with conversion rates and pipeline coverage to tell the full story.
💟 Bonus Tip: Segment pipeline value by rep, stage, region, and deal type to uncover where the strongest (or weakest) revenue opportunities are concentrated.
What it is: The count of active sales opportunities currently in your pipeline.
Formula: Total Count of Active Sales Opportunities
Why it matters: You can’t improve what you don’t quantify. Knowing how many live deals are in play helps you assess sales activity levels, territory coverage, and future revenue potential, especially when combined with average deal size and win rate.
❗️Watch for: High opportunity counts with low pipeline value can signal small deal sizes or an inflated low-quality pipeline.
What it is: The percentage of deals closed-won compared to total deals worked.
Formula: (Number of Won Opportunities / Total Number of Opportunities) × 100
See this example, for instance:
The Win Rate would be (8 / 20) × 100 = 40%
Why it matters: Win rate is your efficiency score. A high win rate means reps are qualifying well, positioning effectively, and closing strong. A declining win rate, even with a growing pipeline, is a red flag.
Benchmark it: By rep, team, stage, and deal type, you’ll see where performance really falls short.
What it is: The speed at which deals move through your pipeline to become revenue.
Formula: (Number of Opportunities × Average Deal Value × Win Rate) / Sales Cycle Length
They break down as:
Why it matters: It tells you how fast you’re turning leads into cash. A high-velocity pipeline is a high-efficiency engine. If your velocity is lagging, you’ll struggle to hit targets even with strong top-of-funnel numbers.
What it is: The average dollar value of your closed-won deals.
Formula: Total Value of Won Deals / Number of Won Deals
If you closed 5 deals in a month with the following values:
Here’s how your calculations would look:
Why it matters: This is your revenue-per-deal signal. It also helps you plan—if your team needs to hit $1M in new business, do they need 10 deals or 50?
💟 Bonus Tip: Monitor this monthly. A sudden drop could indicate discounting, smaller accounts, or weaker negotiation.
What it is: The average number of days it takes for a deal to move from opportunity to closed-won.
Formula: Total Number of Days to Close All Won Deals / Number of Won Deals
Imagine you closed 4 deals, and the number of days from first contact to closing for each was:
You can calculate your cycle length as:
Why it matters: Longer sales cycles can delay cash flow, stall momentum, and muddy forecasts. If your cycle is getting longer, examine the duration stage by stage to find the bottlenecks.
🌟 Slice it by: Deal size, lead source, and product line — you’ll often find wildly different cycles hidden inside your averages.
What it is: The percentage of leads that convert into qualified sales opportunities.
Formula: (Number of Leads Converted to Opportunities / Total Number of Leads) × 100
If you had 200 leads in a month, and 40 of them were converted to sales opportunities, your Lead to Opportunity Conversion Rate = (40 / 200) × 100 = 20%
Why it matters: This tells you how well your top-of-funnel efforts are generating real sales conversations. A low conversion rate could mean weak lead quality, misaligned outreach, or poor discovery.
🌈 Helpful for: Aligning marketing and sales. If the rate is low, you may need to revisit ICP, messaging, or lead scoring.
What it is: The percentage of opportunities that convert into closed-won deals.
Formula: (Number of Opportunities Won / Total Number of Opportunities) × 100
For example, if you had 50 sales opportunities in a period and 12 of them were won, your Opportunity to Win Conversion Rate = (12 / 50) × 100 = 24%.
Why it matters: This is a mirror of your sales process quality. If you’re bringing in lots of opportunities but very few are closing, something’s off — whether in qualification, positioning, objection handling, or negotiation.
❗️Diagnose it further: Look at the conversion rate by stage to spot where deals are dying.
What it is: The ratio of total pipeline value to your sales target.
Formula: Total Pipeline Value / Sales Quota
Here’s an example:
Pipeline Coverage Ratio = $500,000 / $250,000 = 2.0
Why it matters: This metric answers one critical question: Do we have enough pipeline to hit our goal? A good rule of thumb is a 3–4x coverage ratio. Less than that, and you’re relying on a perfect win rate. More than that could mean pipeline bloat or poor forecasting discipline.
➡️ Read More: How to Measure Sales Enablement KPIs and Metrics
A healthy sales pipeline isn’t just full—it’s built for movement.
Too many sales professionals rely on intuition or anecdotal insights instead of building a system that captures the right data, flags friction in the sales process, and ties marketing and sales efforts directly to revenue outcomes.
Here’s a step-by-step workflow to help your sales team track pipeline metrics correctly and make smarter, faster decisions about sales performance, pipeline management, and revenue growth.
You can’t track meaningful metrics without a well-defined sales process. The biggest mistake sales and marketing teams make? Building a pipeline around internal sales stages, not around what the buyer is actually doing.
Instead of vague stages like “Demo Complete,” define clear, buyer-driven pipeline stages like:
This structure improves the accuracy of every pipeline metric—from sales cycle length to conversion rate—and gives sales reps better visibility into what’s actually moving deals forward.
Using ClickUp Sales, you can fully customize your sales pipeline to match your unique process.
Using Kanban or List views, your team can visually track deals as they move through the sales pipeline stages, from initial contact to closing. Custom statuses let you define every step—such as “Contacted,” “Demo Scheduled,” “Proposal Sent,” “Negotiation,” and “Closed/Won”—so you always know exactly where each opportunity stands.
Custom Fields make it easy to capture and update key sales data directly within each deal. For example, you can track the current stage, expected revenue, customer acquisition cost (CAC), deal owner, close date, and lead source—all in one place, without relying on spreadsheets or manual updates.
This ensures your entire team has access to the latest information at a glance. Not sure what Custom Fields to add? Ask AI!
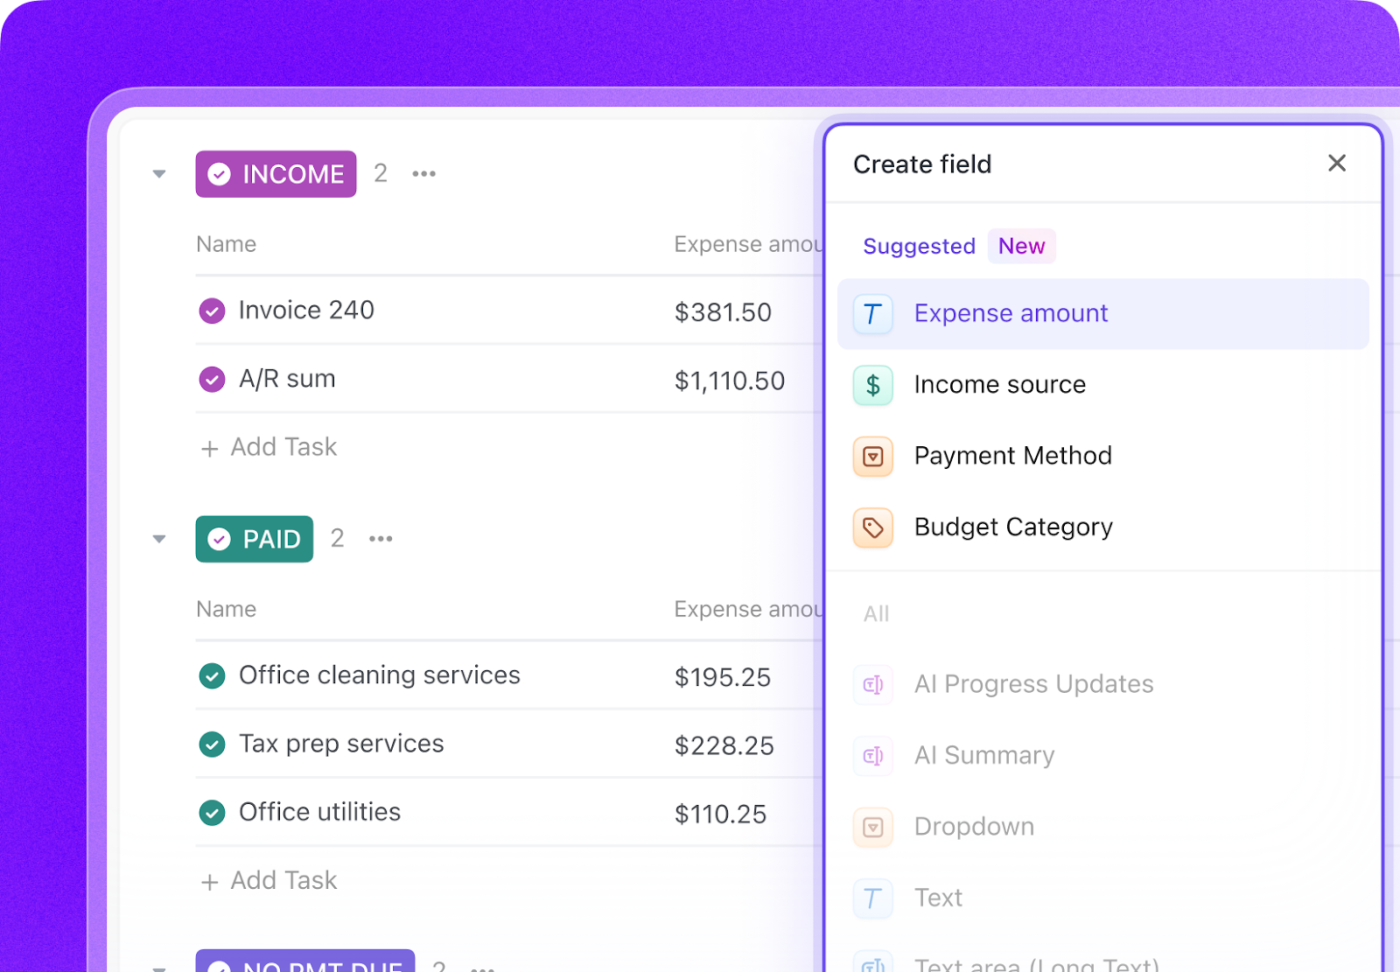
ClickUp’s AI-powered Custom Fields take your CRM even further. AI can automatically analyze deal activity and communication to generate a health score, predict the probability of winning a deal, and suggest the next best action for your reps. This means your team can focus on building relationships and closing deals, while ClickUp handles the data and insights behind the scenes.
Sales reps are already juggling prospecting, follow-ups, demos, and closing. The last thing they want to do is update 10 fields per deal. 🙄
To fix that, automate the core inputs tied to sales performance metrics like:
ClickUp’s AI Agents—specifically Autopilot Agents—enable sales representatives to easily automate these workflows and focus on high-value activities like lead generation and relationship building.
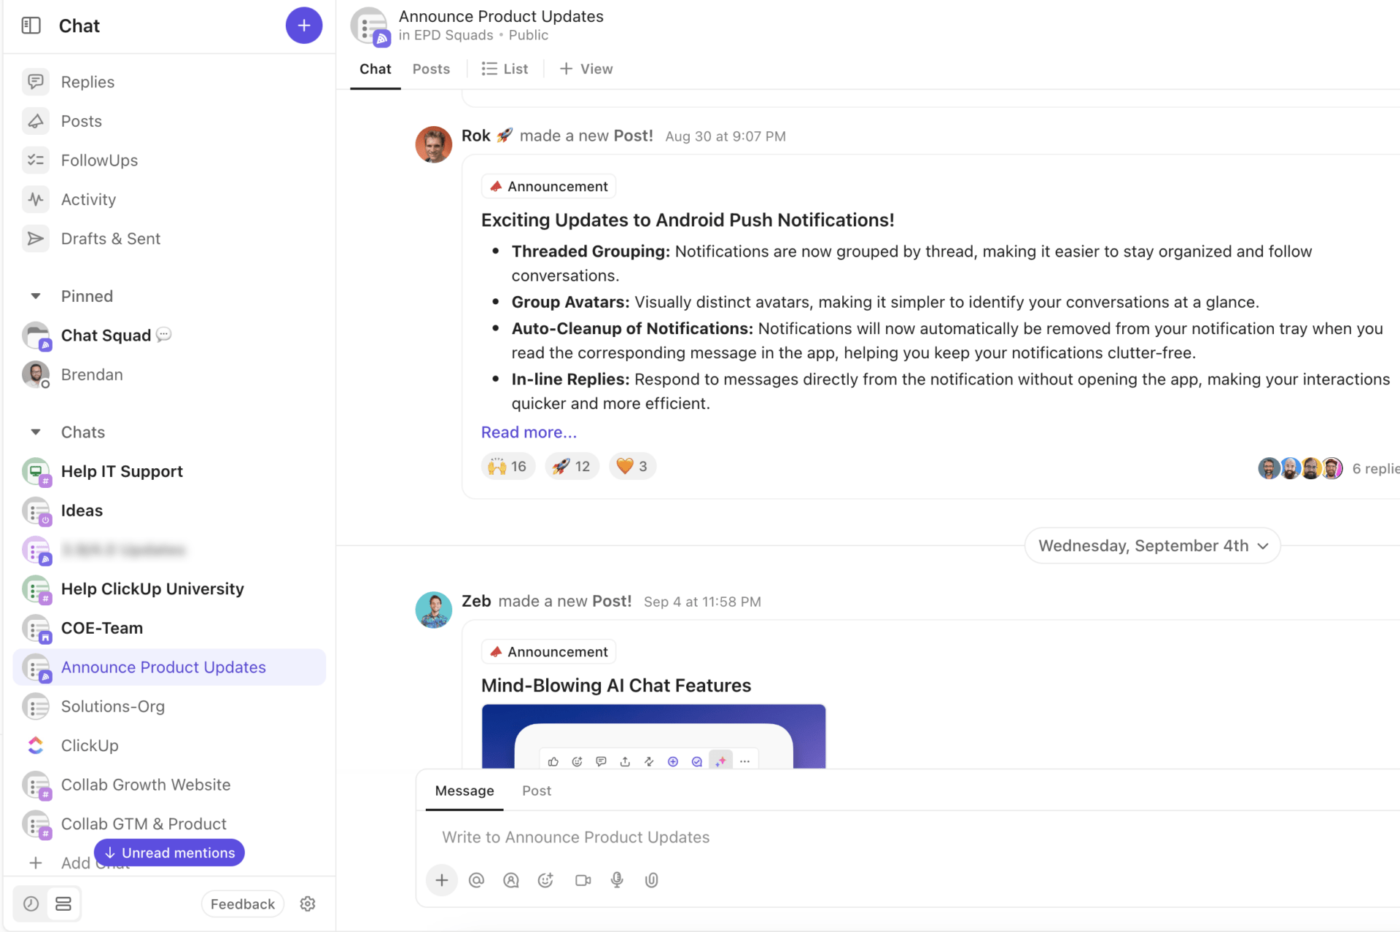
Available in your sales List Views and ClickUp Chat Channels, they can be configured to automate repetitive sales tasks such as updating CRM records, qualifying sales leads, sending follow-up reminders, and generating daily or weekly sales reports.
For example, Prebuilt Autopilot Agents can post automatic updates on lead status, summarize sales activities, and answer common questions in real time by drawing from tasks, Docs, and Chats within your workspace. You can even use Custom Autopilot Agents that can be tailored to trigger on specific sales events, ensuring that no opportunity slips through the cracks.
By leveraging these AI-driven automations, sales teams reduce manual effort, minimize errors, and maintain consistent communication, freeing up more time to develop and execute effective lead generation strategies. This results in overall sales effectiveness and a more proactive approach to pipeline management.
➡️ Read More: 10 Free Sales Pipeline Templates to Close More Deals
Tracking sales pipeline metrics effectively requires alignment across the entire funnel, from marketing qualified leads (MQLs) to closed deals. Too often, pipeline health breaks down because MQLs aren’t converting to SQLs, or lead generation efforts bring in volume without quality.
That’s why MQL to SQL conversion rate is one of the most important pipeline metrics to track—it reflects both the effectiveness of marketing campaigns and the handoff to your sales team.
Sales and marketing strategies should be built around a shared understanding of:
With an everything app for work like ClickUp, you can easily build a single source of truth for your marketing and sales teams:
➡️ Read More: AI Dashboard Generator Tools
You can’t improve what you can’t see—and you definitely can’t forecast with confidence if your metrics are scattered across tools or buried in reports. That’s why building a centralized, live view of your sales pipeline is critical for tracking sales performance and spotting risk early.
To manage this blind spot effectively, build custom dashboards to surface key pipeline metrics like:
But no one wants to spend hours wrestling with complicated reporting tools or building dashboards from scratch, especially when you’re in sales and every minute counts. With ClickUp, creating a powerful, customized sales dashboard is refreshingly simple.

Thanks to its intuitive drag-and-drop interface and ready-made templates, you can set up a dashboard that tracks your pipeline, revenue, and team performance in just a few clicks—no technical skills required. However, if you need some inspiration, check out our dashboard design examples!
This switch to using ClickUp for all teams has provided a centralized hub for all of our teams + users to exist and be able to organize their own work while also keeping track of other team’s projects. The set of features and tools provided by ClickUp are great for CS, Sales and our Development team to efficiently and effectively manage our projects company-wide!
➡️ Read More: AI Tools for Data Visualization
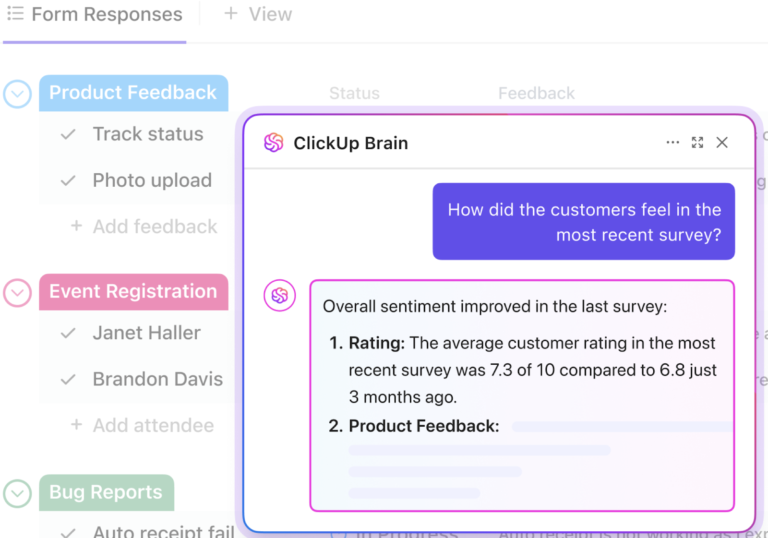
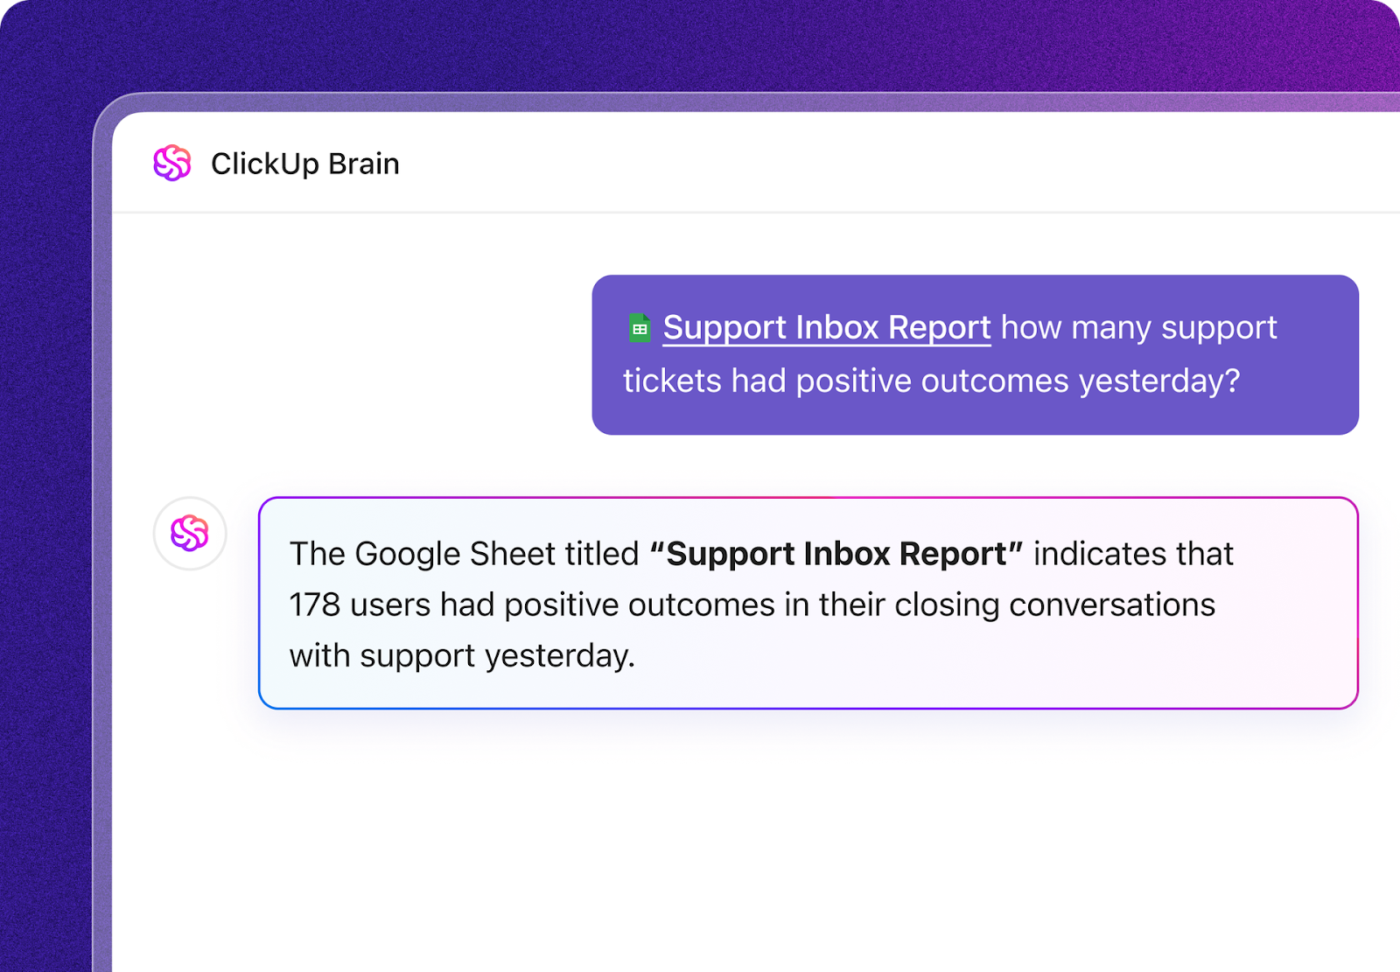
Pipeline metrics tell you what’s happening, but they don’t always explain why.

ClickUp AI gives sales teams the power to fill in the context, without digging through dozens of notes or Slack threads. With AI-powered summaries:
This allows you to tie sales performance back to real buyer behavior—not assumptions—and confidently make coaching, forecasting, and sales strategy decisions.
📮ClickUp Insight: 62% of our survey respondents rely on conversational AI tools like ChatGPT and Claude. Their familiar chatbot interface and versatile abilities—to generate content, analyze data, and more—could be why they’re so popular across diverse roles and industries.
However, if a user has to switch to another tab to ask the AI a question every time, the associated toggle tax and context-switching costs add up over time.
Not with ClickUp Brain, though. It lives right in your Workspace, knows what you’re working on, can understand plain text prompts, and gives you answers that are highly relevant to your tasks! Experience 2x improvement in productivity with ClickUp!
➡️ Read More: How to Write a Meeting Summary (+Templates)
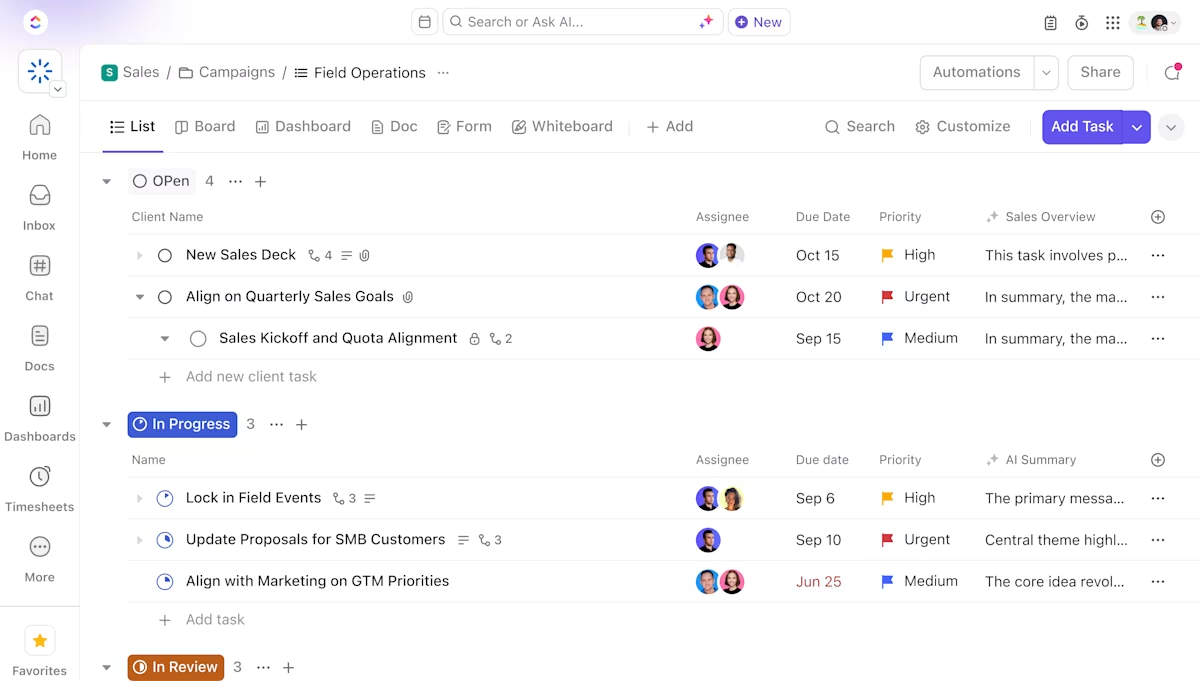
Pipeline metrics should drive your team’s sales effectiveness week over week. Here’s how to operationalize it:
ClickUp gives real-time access to all the data across your workspace and connected third-party apps— so you can coach your team with precision, improve forecast accuracy, and reduce sales expenses tied to inefficient motions.
If your sales pipeline isn’t built to capture, report, and act on key metrics, you’re not managing a pipeline. You’re hoping for the best. By implementing a system that ties lead generation, sales process execution, and sales and marketing strategies together, your team gets:
✅ Cleaner handoffs from MQL to SQL
✅ Faster identification of stalled or bloated stages
✅ Stronger revenue predictions tied to actual buying signals
✅ Clearer coaching opportunities that improve rep performance
✅ And ultimately, more closed deals and future revenue
Our account scoring right now is primarily signal-based. There’s a bucket of data points coming in from product activity and another bucket that’s firmographic. The third thing we’re now adding are marketing signals – and I think marketing signals are where you can see how deep is the intent of this buyer even if this particular user doesn’t manifest through a product signal.
Everyone thinks this is a deep exercise in data science. In reality, you can just come up with four or five dimensions. People are looking for precision that can tell you the exact 10 accounts that are going to buy. But even if I told you these 10 accounts will buy, you can only convert 30-40%. You can’t convert everyone, but you can eliminate the 98% or 99% or accounts that sellers should not focus on
Once you’ve nailed the basics—win rate, sales cycle length, average deal size—it’s time to level up. High-performing sales teams don’t just track pipeline metrics; they analyze them deeply to predict outcomes, prioritize efforts, and scale more intelligently.
Here are advanced sales pipeline metrics and strategies that give sales leaders and ops teams the edge.
Not every deal is equally likely to close, and your forecasts should reflect that. Weighted pipeline value helps you get more realistic about your revenue projections by multiplying each opportunity’s value by its estimated close probability. It’s a smarter view of expected revenue, especially when planning sales targets or setting quotas.
This metric shows where potential deals are falling out of your pipeline. Whether it’s after initial contact or during the contract phase, a high leakage rate signals misalignment in your sales process, messaging, or buyer qualification.
Speed matters. A faster lead response time can drastically improve conversion rates, especially for inbound or marketing qualified leads (MQLs). If your reps are taking hours (or days) to follow up, those leads are probably cooling off—or going to competitors.
This is a crucial pipeline health indicator. A long ramp time may mean your onboarding is inefficient or that your CRM and sales pipeline management tools aren’t intuitive.
This metric helps you understand how much effort it takes to close a deal or spot inefficiencies in your sales and marketing strategies. Are you over-nurturing poor leads or under-engaging high-value prospects?
This metric is all about closing profitable ones. A sustainable sales strategy balances the cost of acquiring a customer (ads, sales time, tools) with the revenue they generate over time. Poor ratios may signal bloated sales expenses or underpriced offers.
Understanding why you’re losing deals is just as important as knowing which ones you lost. Poor fit? Timing? Budget? Competitor? By tagging and categorizing lost deal reasons, you can refine both your sales process and your marketing strategies.
These advanced pipeline metrics go beyond visibility—they give your sales leaders the insights to:
Because in sales, knowledge isn’t just power — it’s revenue.
➡️ Read More: Top Customer Retention Metrics to Track and Improve
To build a sales process that drives real revenue growth, sales managers, leaders, and teams need visibility, consistency, and actionable insights at every stage of the journey.
But collecting and analyzing these metrics doesn’t have to be complicated or time-consuming. With ClickUp, sales teams can track and manage every aspect of their pipeline in one intuitive platform—from lead generation and sales opportunities to customer acquisition and revenue forecasting.
Whether you’re a growing startup or an enterprise operation, ClickUp is the centralized platform that unifies your workflow, automates tedious tasks, and ensures sales efficiency.
Start using ClickUp today, and turn your sales pipeline into your most powerful driver of business growth.

Praburam Srinivasan
Max 21min read
Praburam Srinivasan
Max 17min read

Sudarshan Somanathan
Max 20min read

© 2026 ClickUp