
Sorry, there were no results found for “”
Sorry, there were no results found for “”
Sorry, there were no results found for “”
A tight deadline presses down on your software project, with complex workflows and a team struggling to stay on the same page. Miscommunication and shifting requirements are starting to disrupt progress—sound familiar?
This is where UML diagrams can mamke all the difference. ✨
Introduced in the 1990s at the Rational Software Corporation, UML diagrams provide a unified way to model and design systems, completely transforming how you visualize software architecture.
Dive in as we walk through essential UML diagram examples, step-by-step guidance on implementing them, and tools to help you on the way. 💻
Unified modeling language (UML) diagrams are visual blueprints used to illustrate the structure and behavior of systems, especially in software development and project management.
Think of UML as a language that lets software developers, designers, and business analysts speak the same visual language to clarify complex processes.
Here are the core elements and contents typically found in UML diagrams:
Each UML diagram type uses a mix of these elements to capture the system’s static structure or dynamic behavior.
Originally, UML was created to standardize many existing methods for software design. Today, it helps developers visualize everything from how individual components work together to how the system interacts with users and other systems.
For professionals in software engineering or business analysis, UML provides a comprehensive understanding of object-oriented design, helping teams create clearer, more organized documentation.
UML diagrams fall into two main categories, each providing a unique lens on system design—structural and behavioral diagrams.
Together, these process mapping techniques make it easier to visualize, design, and maintain software by showing both the ‘what’ (structure) and ‘how’ (behavior) of a system. This holistic view enhances collaboration, helps identify issues early, and supports more efficient development.
Here’s a brief overview of different types of UML diagrams within the two categories and how each one fits into the UML framework:
| UML Diagram type | Category | Overview |
| Class diagram | Structural | Defines system classes, class attributes, operations, and relationships |
| Object diagram | Structural | Shows instances of classes at a specific time for a real-world snapshot |
| Composite structure diagram | Structural | Details the internal structure and collaboration within components |
| Component diagram | Structural | Represents physical components and their dependencies |
| Deployment diagram | Structural | Maps software components to hardware, illustrating system deployment |
| Package diagram | Structural | Organizes classes and elements into packages, indicating dependencies |
| Profile diagram | Structural | Customizes UML for specific needs by defining stereotypes and extensions |
| Activity diagram | Behavioral | Models dynamic workflows with activities, transitions, and decisions |
| Use case diagram | Behavioral | Illustrates system functions from the user’s perspective with actors and use cases |
| Sequence diagram | Behavioral | Captures the order of messages flowing between objects over time |
| Communication diagram | Behavioral | Focuses on interactions between objects, showing message exchange paths |
| State machine diagram | Behavioral | Shows states and transitions of an object in response to events |
| Timing diagram | Behavioral | Represents object states over time, with a focus on timing constraints |
| Interaction overview diagram | Behavioral | Combines sequence and activity diagram elements for complex scenarios |
Understanding UML diagrams can seem daunting at first, but breaking them down makes it easier to grasp how they can enhance your projects.
Each of these diagram examples has unique strengths. Let’s dive into what each one does, how it looks, and where it fits best.
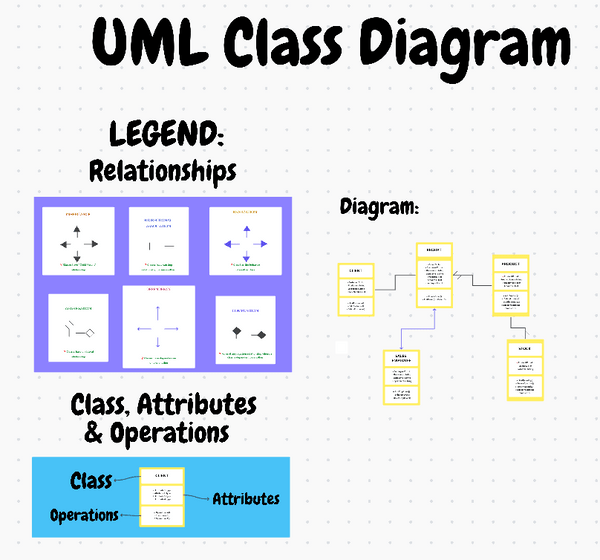
As a static structure diagram, the class diagram serves as the blueprint for an object-oriented system. It highlights key foundational elements such as:

When designing applications like e-commerce platforms or content management systems, class diagrams simplify complex relationships, helping developers and stakeholders understand how core components will interact.
📌 Use Case: Models an e-commerce platform’s structure with entities like product, order, and customer, along with their attributes and relationships.
The ClickUp UML Class Diagram Template is an intuitive tool designed to streamline modeling for object-oriented systems, making it easy to visualize classes, attributes, and relationships while keeping your team on the same page. This template lets you:
📖 Also Read: 10 Free Swimlane Diagram Templates & Process Maps
Serving as an internal structure diagram, a composite structure diagram provides a look inside a particular component or class to see how its parts work together. Its key elements are:

Unlike high-level diagrams that focus on broad interactions, composite structure diagrams dive into the internal organization of a component, illustrating relationships between its parts, ports, and connectors. They reveal what a component does and how it functions by coordinating its internal elements.
📌 Use Case: Details the internal organization of a car class, including parts like engines and brakes for complex component communication.
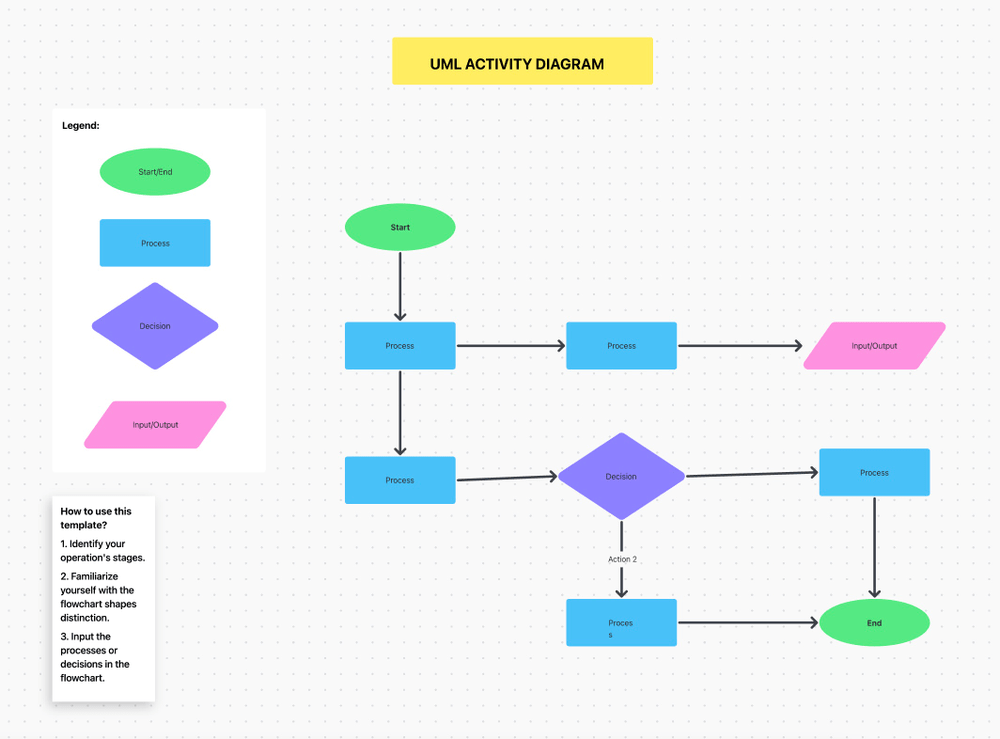
Activity diagrams illustrate workflows and business processes by breaking them down into:

Perfect for modeling processes like sales pipelines, project execution, or product manufacturing steps, activity diagrams provide a top-down look at workflows, making it easier to pinpoint efficiencies and streamline processes. This is essential for teams who need to understand operational flow and decision points within a system.
📌 Use Case: Outlines a bank’s loan approval workflow, capturing each step from application submission to loan disbursement for streamlined process flow.
A use case diagram provides a dynamic view of a system’s functionality, focusing on:

These diagrams are invaluable during the project planning phase, where stakeholders, business analysts, and developers can visualize user interactions and ensure that essential functionality is accounted for. Whether you’re building a mobile banking app or an HR management tool, use case diagrams offer a clear roadmap of user needs.
📌 Use Case: Defines user interactions for a healthcare patient portal, covering tasks like book appointment and view test results.
Sequence diagrams capture the flow of messages in a particular process, highlighting:

Sequence diagrams detail message flows and their order, helping developers and designers ensure smooth communication between system components. This proves especially useful in processes like user login systems or payment processing, where accurate timing and event order are essential.
📌 Use Case: Maps the login sequence in a mobile app, showing message flow between user and server to ensure proper request timing.
👀 Bonus: Find the best flowchart software to visualize your ideas clearly.
State diagrams portray the lifecycle of an object by focusing on:

This type of diagram is especially helpful in applications where the object lifecycle is complex, such as order management or subscription services. State diagrams help you to predict how objects move from one state to another, ensuring smooth transitions and accurate state handling.
📌 Use Case: Illustrates the lifecycle of an order, highlighting transitions through states like placed, shipped, and delivered.
Object diagrams are similar to class diagrams but capture instances at a particular moment, showcasing:

Often used for testing and debugging, object diagrams help teams visualize how real-world examples of objects interact within the system, allowing developers to verify accuracy in a snapshot of the system’s state at a specific time.
📌 Use Case: Captures a snapshot of instances in an e-commerce checkout, showing real-time relationships between cart, product, and customer.
Deployment diagrams model the hardware and software components of a system and their interactions. It maps out the physical distribution of software, focusing on:

Deployment diagrams are essential for distributed systems or cloud applications. They depict the hardware and software setup and help IT professionals see how resources are allocated, which is crucial for efficient system scaling, load balancing, and maintenance.
📌 Use Case: Visualizes the deployment setup for a web application, mapping nodes like web server and database for organized infrastructure.
Package diagrams organize model elements into groups or ‘packages,’ showing package dependencies. Two major elements of this UML diagram are:

These diagrams are crucial in large systems with multiple modules, as they help developers and architects see the organization and dependencies within the project.
For enterprise-level software, package diagrams make it easier to manage complexity by grouping related elements, promoting a modular and maintainable structure.
📌 Use Case: Organizes an enterprise system into logical packages (e.g., authentication, payment), clarifying dependencies within large projects.
Communication diagrams focus on the interactions between objects or parts, emphasizing their relationships and highlights:

These diagrams provide a streamlined view of communication flow, making them ideal for systems with complex interactions like chat applications or customer service platforms.
They help ensure each object sends and receives information as expected, promoting seamless interactions within the system.
📌 Use Case: Details interactions in an order processing system, showing message flow between objects like order, payment, and inventory.
Component diagram maps out the physical structure of a software system, breaking down major components and their dependencies. It mainly focuses on:

This diagram is particularly useful in large-scale applications to plan and communicate architecture.
📌 Use Case: Maps a SaaS platform’s core components, such as user interface, database, and API, for effective system architecture planning.
💡Pro Tip: Include brief descriptions or annotations alongside diagrams. This additional context can help both your technical and non-technical audience to interpret the diagrams correctly.
Ready to bring your ideas to life with UML diagrams?
While workflow software and online tools like Lucidchart and Microsoft Visio offer built-in UML shapes and templates for creating diagrams, they often lack the collaborative features that make teamwork seamless.
That’s where ClickUp, the everything app, comes in.
Implementing UML diagrams with ClickUp makes it easy to map out systems, keeping everything clear and manageable. Let’s see how.
Start by outlining what the diagram needs to represent, such as a class structure for an app or a business process.
You must define the specific purpose and scope to keep your UML diagram focused and relevant.
📮ClickUp Insight: Context-switching is silently eating away at your team’s productivity. Our research shows that 42% of disruptions at work come from juggling platforms, managing emails, and jumping between meetings. What if you could eliminate these costly interruptions?
ClickUp unites your workflows (and chat) under a single, streamlined platform. Launch and manage your tasks from across chat, docs, whiteboards, and more—while AI-powered features keep the context connected, searchable, and manageable!
Classes represent primary components in your system, like User, Product, or Order.
ClickUp Whiteboards allows you to create UML components and establish relationships using shapes, freehand drawing, and linking tools. You can also simply drag and drop elements to connect them and create comprehensive system structures.

Attributes define the data held within each class. For instance, in a User class, include attributes like username, email, and role.

Use Whiteboards’ text feature to add attributes under each class. To provide more detail, add images, links, and additional resources. Upload visual aids and links to related documents to keep everything accessible within your UML diagram.
Visibility modifiers:
ClickUp has tools to visualize your process, goals, etc. It is the peak of collaborative work and it has been improving on that end, especially with the addition of the Whiteboard View
Identify the actions or behaviors each class will perform to define its methods. Methods describe how the class operates, allowing it to interact with other classes or fulfill specific functions within the system.
Use this format to define methods:
For example:
Using ClickUp Whiteboards, you can easily represent key UML relationships with simple visual cues:
📖 Also Read: Best Mind Mapping Software
Define the number of instances in relationships, like ‘one-to-many.’ You can add text labels on relationship lines.
Common multiplicities:
Bonus: Check out these mermaid diagram examples!
Once the initial layout is in place, add depth with ClickUp Mind Maps to connect attributes, methods, and dependencies. This step allows you to organize classes and capture a broader view of the system’s structure.
With the Re-Layout feature, you can easily adjust the layout of your Mind Map. This ensures a clean structure, making it simpler to maintain hierarchy and prioritize elements.
You can also choose between Blank Mode for unrestricted brainstorming and Tasks Mode for organizing project elements.

🔍 Did You Know? Airbnb’s engineering teams use UML diagrams, particularly class and sequence diagrams, to manage complex interactions among users, hosts, and listings.
If you’re looking for even more reasons to choose ClickUp, the ClickUp UML Activity Diagram Template makes visualizing workflows easy with intuitive drag-and-drop tools. You can also collaborate in real time with your team to refine your workflow.
Whether you’re working on user stories or project planning, this template helps keep everything organized in one place.
👀 Bonus: Explore additional UML diagram templates to help you map out your ideas, simplify complex systems, and work better with your team.
UML diagrams can be powerful tools, but it’s easy to make mistakes. Here are some common pitfalls to watch out for when working with UML diagrams, along with tips to help you avoid them.
UML diagrams allow you to map out different aspects of a software system, visually breaking down the components, processes, and relationships that make a project tick.
Understanding various examples of these diagrams will help you choose the best one for creating an object-oriented design.
To enhance your UML diagramming experience, ClickUp Whiteboards lets you brainstorm and collaborate in real time. Mind Maps provide a structured way to break down complex processes and keep your project organized.
Sign up to ClickUp today and discover how our collaborative tools can bring clarity to your development process.

© 2026 ClickUp