


Still downloading templates?
There’s an easier way. Try a free AI Agent in ClickUp that actually does the work for you—set up in minutes, save hours every week.
Sorry, there were no results found for “”
Sorry, there were no results found for “”
Sorry, there were no results found for “”

For businesses, customer feedback is the key to refining customer service and improving day-to-day processes.
And what better way to gather this intel than through survey tools? They’re the best way to collect customers’ voices, which can then be neatly packed into quantitative data.
But let’s face it—collecting feedback is just step one. How do you turn all that raw data into a meaningful and complete survey report?
That’s exactly what we’re here to break down. In this article, we will explore how you can use ClickUp to complete a survey report and present survey results.
Simply put, a survey report is a structured document that gathers and presents survey findings in an objective way that anyone from a manager to a marketing intern can understand.
It’s designed to turn survey responses into actionable insights, driving strategic decisions, shaping products, and enhancing business services.
Here’s what you’ll often find in a good survey report example:
🍪 In a bite: A survey report takes raw data, organizes it, and delivers a story—because good data should always tell a story!
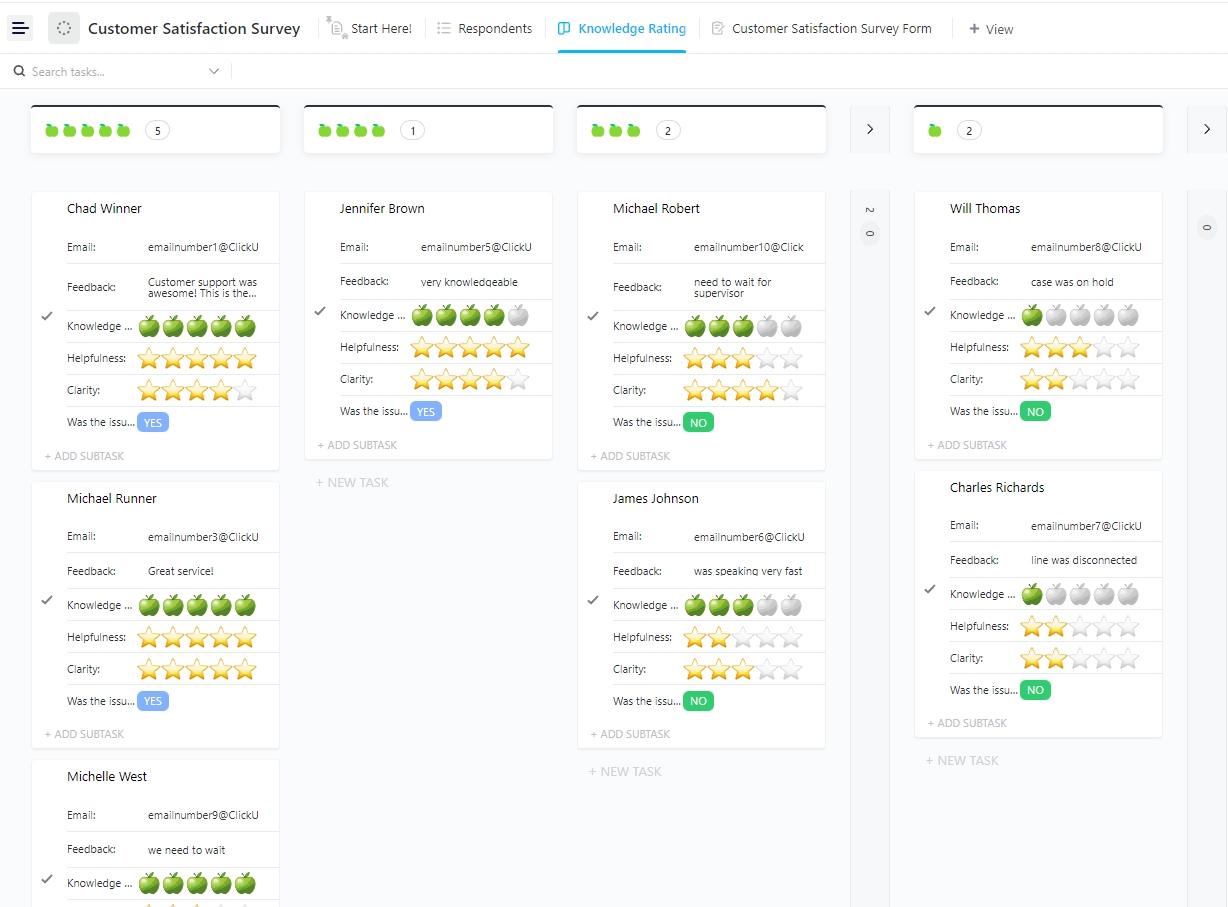
Stop guessing what your customers think. ClickUp’s Customer Satisfaction Survey Template helps you capture targeted feedback that actually drives improvements. Try it for free today!
Did you know that 97% of global business leaders actively seek help from data to make critical decisions?
Survey reporting hits the bullseye for these goals.
It’s essential because it bridges the gap between data and action, giving stakeholders a clear, objective view that aligns with their priorities. Here’s why survey reports matter:
Different surveys call for different report formats. Let’s break down the main types, along with their unique perks:
| Type of Survey Report | Description | Pros | Cons |
| Questionnaire | Distributed questions that respondents complete. | Easy to analyze; covers a wide audience | Limited depth on complex issues |
| Interview | Questions asked in person/by phone, with recorded answers. | In-depth insights; flexible | Time-consuming; costly |
| Telephone Survey | Ideal for reaching existing customers post-sale. | Convenient; good for immediate feedback | Limited to users willing to answer calls |
| Focus Group | Group discussions with semi-structured questions. | Captures spontaneous insights | Harder to analyze; can be expensive |
| Panel Survey | Longitudinal research over time is often used in psychology. | Detailed insights over time | Requires committed participants |
| Mail Survey | Like paper surveys but sent by mail. | Broad reach; physical copies for reference | Dependent on reliable postal service |
| Kiosk Survey | Digital responses captured offline are ideal for real-time data. | Convenient, real-time feedback | Limited customization options |
| Reconnaissance Survey Report | Comprehensive, covering survey details, plans, and cost estimates. | Highly detailed; great for planning | Requires time and resources |
Welcome to Survey Reports 101. Make sure you include these key ingredients to whip up an insightful analysis with ease:
Think of the executive summary as the “too long; didn’t read” version of your survey report.
It’s a quick snapshot of the main findings, conclusions, and recommendations, giving busy readers a high-level view without needing to dig through every detail.
💬 Key points:
The introduction warms readers up to your report. It provides essential context, laying out the background, objectives, and key questions driving the survey.
Consider it the story behind the numbers.
💬 Key points:
Here’s where we get technical.
The methodology section details how the survey was conducted, covering aspects like survey design, sampling methods, data collection techniques, and any limitations that could affect the findings.
💬 Key points:
Ah, the heart of the survey report—data analysis!
This is where raw numbers transform into meaningful insights. This section breaks down the data using charts, graphs, and tables, spotlighting trends, patterns, and standout results.
💬 Key points:
💡 Pro Tip: Use color-coded visuals like pie charts and bar graphs to highlight key insights when crafting your survey report. This makes the data more digestible while keeping readers engaged.
The findings section is the main event.
Here, each survey question is analyzed with supporting data, presenting a clear and organized breakdown of responses. For clarity, it’s often helpful to group similar questions.
💬 Key points:
This section turns data into action. Based on your findings, the conclusions and recommendations offer actionable insights, specifying what the data implies and suggesting concrete steps forward.
💬 Key points:
Got extra data or detailed methodologies? The appendices are the perfect place to store them.
This section includes supplementary material like raw data, additional charts, and comprehensive methodology notes.
💬 Key points:
To keep things credible, include a references section for any external sources or previous studies you’ve cited. It’s the academic way of saying, “Don’t just take my word for it!”
💬 Key points:
Also Read: Top Project Management Charts
Not all survey reports are created equal.
To help you avoid the pitfalls, we’ve gathered some top-notch survey report examples that turn data into decisions with style and clarity.
A marketing software company conducted a surveyto gauge customer satisfaction with its CRM platform, assess any usability concerns, and evaluate its support team’s effectiveness.
Here’s how they structured their approach:
The company’s survey report included clear visuals to showcase the results:
From the feedback collected, the company derived practical insights and actions:
If you were wondering how to make your data look sleek and impress stakeholders, try ClickUp’s Stacked Bar Graph Template.
If complex software is not your jam, this ready-to-use template is perfect if you want to visually compare data in a few quick, simple steps.
The stacked bar graph format offers a clear picture of data distribution across multiple categories, helping you spot trends and make comparisons at a glance.
Plus, you can keep your insights current and actionable with custom statuses, fields, and real-time data.
This employee engagement survey was conducted to assess overall morale, identify key engagement drivers, and gather feedback on workplace culture.
Here’s a snapshot of the approach:
The survey report highlighted specific engagement trends backed by clear data visualizations:
Based on these findings, actionable steps were recommended to improve engagement and build a supportive work environment:
💡 Pro Tip: When analyzing survey data, don’t just look at the numbers—dig into the “why” behind them. Combining quantitative insights with open-ended responses can reveal hidden patterns and give you a clearer picture of consumer motivations.
This market research survey gathered insights into consumer behavior, demographic preferences, and market trends to help a digital marketing agency refine its strategies.
Here’s a breakdown:
The survey report included several data visualizations to present demographic insights clearly:
Based on the data gathered, the following recommendations were suggested to optimize marketing efforts:
After having explored the survey analysis report examples, let’s understand how you can use ClickUp to collect data and generate visual representations of your data, like pie charts and donut charts, that can express survey insights and key findings.
Here’s how you can create them in just a few steps:
First, decide which categories you want in your chart. For instance, if you’re tracking project tasks, categories like ‘Completed,’ ‘In Progress,’ and ‘Pending’ work great.
Gather your numbers—maybe the number of tasks or hours per category.
In ClickUp, you can pull data from Spaces, Folders, or Lists, giving you total flexibility.
In your ClickUp Dashboard, click on + Add a card and choose the Pie Chart from the custom card options.
The Dashboard layout is fully customizable, so you can organize data exactly how you want. Add your dataset here, and voilà—ClickUp displays your tasks by status, complete with subtask counts, tags, and indicators for blocked or waiting tasks.
Turn that pie chart into a donut chart with just a few clicks. Open the pie chart settings and select the option to convert to a donut chart.

With the drill-down view, ClickUp’s donut chart gets even better.
Click on any slice (or the center total) to see specific details—who’s responsible for each task, due dates, and progress.

You can also organize this data by date, helping you track trends over time for each category or activity.
Once your masterpiece is ready, save it and share it with your team or stakeholders so everyone stays in sync with the latest visual data.
📮ClickUp Insight: 83% of knowledge workers rely primarily on email and chat for team communication. However, nearly 60% of their workday is lost switching between these tools and searching for information. With an everything app for work like ClickUp, your project management, messaging, emails, and chats all converge in one place! It’s time to centralize and energize!
Personalizing your survey reports involves presenting data in a clear, engaging, and, yes, impressive manner.
ClickUp’s customization options allow you to choose from various card types, such as Line, Bar, Battery, and Calculation. Here’s a rundown of ClickUp’s card types and when to use them.
Line Chart Card
✅ Best for: Tracking data over time, making it perfect for visualizing trends, progress, and patterns. Ideal for metrics like project completion rates, revenue growth, or hours logged over a timeline
Bar Chart Card
✅ Best for: Comparing multiple data sets side by side, helping you quickly spot high and low points. Useful for productivity levels across teams, sales comparisons, or category-wise data distribution
Pie Chart Card
✅ Best for: Showing how different parts contribute to a whole. Great for visualizing task distribution among team members or market share percentages
Battery Chart Card
✅ Best for: Quick status checks on progress and completion rates. Excellent for sprint tracking, goal completion, or any project with a measurable progress bar
Calculation Card
✅ Best for: Aggregating data points like total time tracked, task counts, or average ratings to give you insights at a glance. Handy for on-the-spot calculations like sums, averages, and more within your dashboard
Portfolio Card
✅ Best for: Monitoring multiple projects or initiatives, as it categorizes and tracks the progress of lists or folders. Perfect for project managers wanting an overview of each project’s stage and health
Text Block Card
✅ Best for: Adding context to your dashboard with rich text and images. Use it to provide instructions, highlight updates, or offer guidance on interpreting data
Discussion Card
✅ Best for: Fostering team collaboration directly within the dashboard. Ideal for gathering feedback, discussing data, or planning the next steps based on insights
Search Card
✅ Best for: Creating a dynamic list of filtered items by keywords or tags across the workspace so you can quickly access relevant tasks or resources without hunting
Also Read: Best Survey Analysis Software
Crafting a survey results report that grabs attention and presents insights is both an art and a science—let’s learn to master it.
Designing an effective questionnaire takes precision and clarity.
Make things easy for yourself with ClickUp Docs. It offers everything survey creators need for well-structured, visually engaging, and editable survey designs that can be created in real time by your entire team.

With features that allow you to leave comments, assign tasks, and provide direct feedback, your team can efficiently refine survey questions.
💡 Pro Tip: Use pages and subpages to separate questions by topic or type, and add icons and cover images to give your survey a professional look.
Gathering data is simpler than ever with ClickUp Forms.

We’re talking visually engaging, well-structured surveys in just minutes.
ClickUp’s user-friendly design means you can quickly add scales, ratings, and other fields to get the exact data you need—from text boxes and dropdowns to checkboxes, dates, and more.
And here’s the kicker: each response can seamlessly turn into a task, so instead of letting feedback pile up, you can start taking action the moment responses arrive.
Without any help, analyzing survey data can feel like staring at confusing puzzle pieces.
With ClickUp’s Form View and Dashboards, you’re set up to collect feedback and turn it into meaningful insights.
💡 Pro Tip: SingTel, Singapore’s oldest telecommunications company, discovered that brands that master storytelling can boost customer loyalty by over 30%.
You must present your findings clearly and accurately when crafting a survey report
Here are some mistakes to steer clear of:
✅ Start with an engaging introduction: Set the stage by explaining the purpose of the survey and why the data matters. This adds context and makes your audience feel invested in the findings right from the start
✅ Use visuals to tell your story: Graphs, charts, and images can make complex data more digestible. Spice it up with pie charts, bar graphs, or even infographics where relevant, but ensure each visual serves a purpose and enhances understanding
✅ Highlight the key takeaways first: Start with the most impactful data points—think of it as the headline news of your report. This helps your readers get a quick overview before diving into the details
✅ Organize data into logical categories: Group similar responses to reveal relationships and patterns. Breaking down results by category or theme keeps the report organized and allows for deeper insights
✅ Summarize insights for clarity: Wrap up each section with a summary that captures the main findings. A brief conclusion at the end of the report helps readers recall the key points and takeaways
✅ Infuse your company’s branding: A professionally branded report boosts credibility. Add your company’s logo, use brand colors, and select fonts that align with your style guide for a polished finish
✅ Make your report easy to share: Choose convenient formats for sharing, like a PDF, cloud link, or embedded report. Different stakeholders may prefer various formats, so offer flexibility to suit everyone’s needs
As more businesses enter the market, understanding your customers and identifying their pain points is more important than ever to ensure a better customer experience.
But what will you use to get your survey reports made? You’ve got to try ClickUp.
As Chandu Prasad T S, Senior Account Executive at Smallcase Technologies, says, “ClickUp offers tons of tracking tools, from time trackers to pie, line, and bar charts, making project management a breeze.”
There’s no denying it. ClickUp combines user-friendly data visualizations, flexible dashboards, and dynamic forms—all working together to give you a complete picture of every project at a glance.
So why not go live with ClickUp? Create a free account on ClickUp today!

© 2026 ClickUp

There’s an easier way. Try a free AI Agent in ClickUp that actually does the work for you—set up in minutes, save hours every week.