Free Fishbone Diagram Templates for Word

Sorry, there were no results found for “”
Sorry, there were no results found for “”
Sorry, there were no results found for “”
Tired of tackling the same work issue over and over? A fishbone diagram template in Word could be your answer.
This visual tool helps you map out all possible causes behind an issue in one simple layout, making it perfect for brainstorming solutions directly in Microsoft Word. ✨
Whether you’re a project manager or part of a problem-solving team, fishbone diagram templates support everything from quality management to process improvements.
Below, we’ve rounded up some of the best free Word options to help you find the right fit.
But first, let’s explore the key points to consider when choosing a Word template.
A solid fishbone diagram template goes beyond just basic cause mapping. Here are the key features to seek out:
💡Pro Tip: Building fishbone diagram templates in Excel can be more efficient than in Word. Excel’s flexible layout and interactive tools let you adjust categories and format visuals, making it the better Microsoft tool for active problem-solving.
Microsoft Word isn’t an inherent fishbone diagram maker, but you can find plenty of Word-compatible templates from external flowchart software. These templates make structured problem-solving easier in Word.
Explore our top picks for free fishbone diagram Word templates to get started.
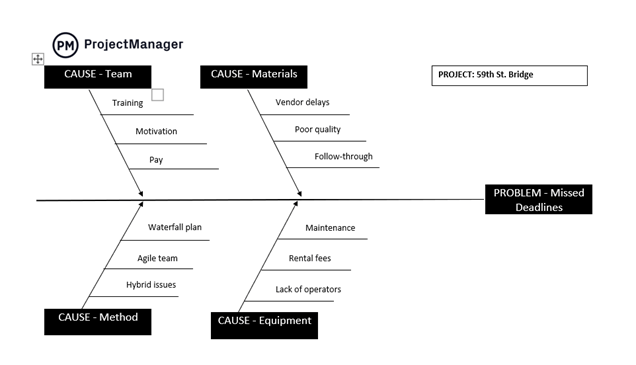
The Word Root Cause Analysis Template by ProjectManager uses a herringbone diagram (fish skeleton) to pinpoint what’s causing a process to veer off course. It is the perfect starting point for your overall quality management.
The predefined template is set up for analyzing a bridge project that’s struggling to meet deadlines. It organizes potential causes into four key areas: your team, materials, methods, and equipment. Under each category, you can specify detailed causes.
For example, on the team side, you might note insufficient training, lack of motivation, or inadequate pay.
Best for: Project managers analyzing missed deadlines in small-scale software development projects.
Six Sigma and DMAIC templates are designed to improve business processes through a step-by-step approach: defining, measuring, analyzing, improving, and controlling.
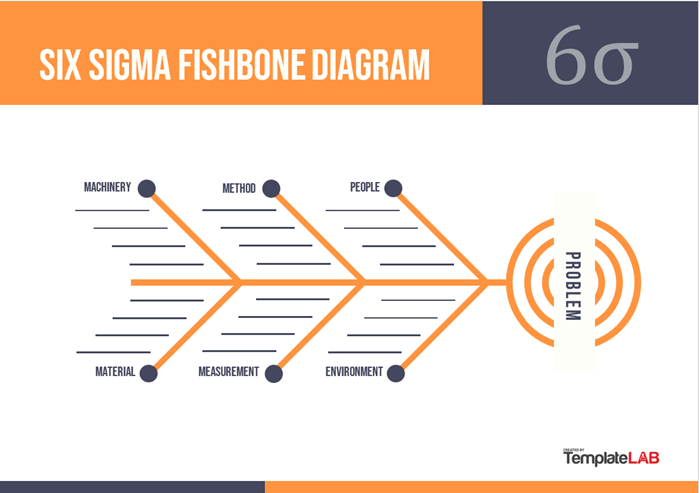
The Six Sigma Word Fishbone Diagram Template by TemplateLAB makes it easy to apply these principles.
This Ishikawa diagram template helps you visually arrange causes based on their impact. You can place the biggest causes near the fish’s head and the smaller ones toward the tail. This layout helps you define, measure, and analyze causes simultaneously.
A popular way to categorize causes is using the classic ‘six Ms’ framework: Method, Man, Machine, Material, Mother Nature, and Measurement. It also has designated spaces for listing sub-causes.
Best for: Local manufacturing teams identifying root causes of defects in production runs.
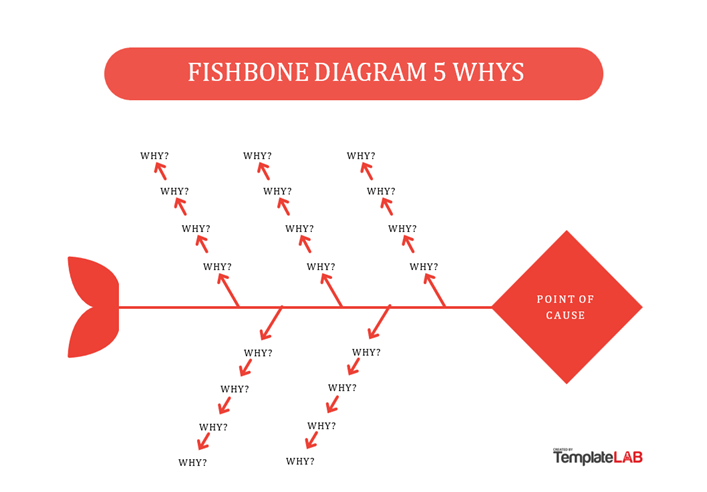
The 5 Whys Word Fishbone Diagram Template by TemplateLAB helps you get to the root of problems by prompting you to continuously ask ‘Why’.
After you fill in the first layer of ‘bones’ in your diagram, continue exploring the reasons behind these issues, peeling back layers until you uncover the core problem.
This iterative questioning process of 5 whys root cause analysis templates clarifies symptoms and root causes. It even helps you identify assumptions that might be clouding your judgment.
Best for: Customer support teams tackling recurring complaints about slow service response times.
The Word Fishbone Diagram Template by Improvement Academy is a flexible tool you can use as a fishbone layout to tackle challenges or a flowchart for mapping processes. It’s a great addition to your stack of mind map tools.
At the template’s center, you outline your issue or project objective. From there, you can add major headings that represent either the causes of the problem or the steps in your process.
The template is set up for a 4M1E classification, but you can include as many headings and subheadings as you need.
Best for: Any team looking to improve their process flows.
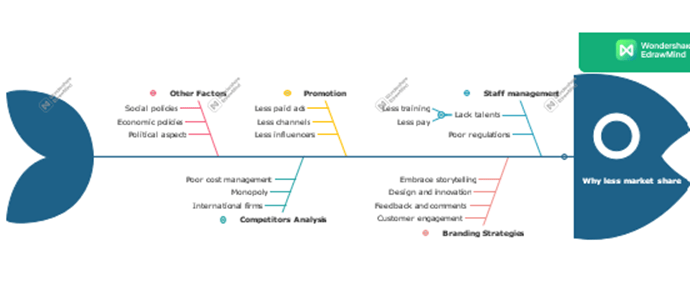
The Word Fishbone Diagram Template by EdrawMind can be created right within the platform’s virtual space.
Start by selecting a template from EdrawMind’s gallery. You can choose one with a skeleton structure to build upon or skip the setup by using the template’s outline mode. Just enter your data, click ‘Mind Map,’ and watch it turn into a fishbone diagram.
You can easily add or remove topics and subtopics using the fishbone’s toolbar, and customize the design with themes, colors, and fonts. The template also lets you create callouts and floating topics and includes a section for an overall summary.
Once your diagram is finalized, you can export it as a Word file, making it easy to include in any report or document.
Best for: Event planners troubleshooting logistical failures at community events, like vendor coordination issues.
Using Word templates for your fishbone diagram? Mind the challenges:
If Word’s limitations are slowing down your problem-solving process, consider a more versatile (yet simple) fishbone diagram template that brings in extra functionality.
➡️ Read More: Top 12 Project Management Charts
In project management, charts are your best friends during the exploratory inquiry phase. But simply jotting down causes and effects in a diagram isn’t enough; you need a way to turn those insights into actionable tasks.
That’s where ClickUp comes in.
ClickUp is a dynamic project management platform that keeps your workflows flowing smoothly. It offers features like automated task management, advanced integrations, and even an AI writing tool, all within your workspace.
And fishbone diagram templates are one of the many things ClickUp excels at. 😉
These feature-rich templates help you investigate the underlying factors behind project challenges and arrange your findings into intuitive lists and boards within a single window. This makes it easier to decide on the next steps for improvement.
Check out our curated selection of top free fishbone diagram templates below.
Interactive whiteboard templates are great for brainstorming ideas at any stage of a project, and the ClickUp Fishbone Diagram Template makes this process even more cohesive.
Built for teamwork, the template’s Whiteboard View hosts a color-coded fishbone layout. Use it for sprint planning, quality control meetings, group discussions, and more. You can even embed files from Google Workspace, Figma, and other tools for added context.
The fishbone features key categories like ‘4M1E’, but you can alter them to fit your specific analysis. Each diagram has a central issue box, major factors, subcategories, and a legend for easy navigation.
Plus, you can switch from the Whiteboard View to Lists or Kanban boards for intuitive viewing of root causes and action items.
Best for: Project teams needing a visual tool to identify multiple root causes of a specific problem.
The purpose of any robust root cause analysis software is proactive problem-solving.
ClickUp’s Root Cause Analysis Template helps you go to the bottom of any project issue before it escalates.
The intermediate-level template features a ‘List of Issues,’ where you can group tasks by issues (both existing and incoming). It includes Custom Fields to explain the why behind each issue and provides color coding to indicate whether a system change is necessary. You can also tag the responsible team and document winning solutions.
The ‘Priority List’ sorts your tasks by urgency, helping you focus on what matters most, and the ‘Needs Action’ board highlights urgent tasks, giving you a quick snapshot of what requires immediate attention.
Best for: Quality assurance teams looking for a structured way to investigate and resolve complex issues.
A specialized version of the root cause analysis template, the ClickUp IT Root Cause Analysis Template is a beginner-friendly option for tech teams.
The process starts when users fill in the ‘Website Issue Form’ to document their problem. Once submitted, the issue pops into the ‘Problems’ list view, sorted by the date it happened.
You can assign roles like analyzer, encoder, and reviewer to conduct the ‘Why-Why Analysis.’ This method involves asking ‘why’ multiple times—usually two to five—to get to the heart of the issue. You can then categorize the contributing factors using color-coded dropdown options, jot down the proposed solution, organize your action plan, and more.
To help you stay on track, auto-progress indicators show how close you are to resolving the issue. You can even set up workflow automation to ensure smooth progress without constant oversight.
Best for: IT support teams diagnosing and addressing technical problems within systems.
The ClickUp Cause and Effect Whiteboard Template is a visual tool for you and your team to identify problems and ideate solutions together. This advanced-level template is integrated directly into your ClickUp workspace.
To begin, note the issue you want to address in the template whiteboard. Then, brainstorm and fill in the branches with high-level causes and specific factors in this cause-and-effect diagram. You can organize your thoughts in a ClickUp Doc first or use data flow diagrams for extra clarity.
For a more inclusive and documented approach to brainstorming, use ClickUp Chat. Team members can contribute at their own pace in a dedicated channel, review previous messages for context, and refer back to the conversation later, ensuring that no insights are lost.
Once you’ve got a list of possible causes, prioritize those that seem most likely to be the root of the issue. Then, transfer everything to the built-in list or board view, assign them to teams, and monitor progress to meet deadlines.
Best for: Product teams exploring cause-and-effect relationships for product design decisions.
The beginner-friendly ClickUp 5 Whys Template features an interactive whiteboard view designed for quick issue exploration.
This template is your brainstorming canvas with color-coded boxes arranged hierarchically to help you and your team identify all potential sub-issues behind an issue. Keep asking ‘why?’ to move from one box to the next until you uncover the root cause.
You can use ClickUp Brain to automatically extract insights and patterns from team discussions, minimizing manual documentation. This AI-powered tool categorizes your inputs clearly, boosting your root cause analysis.
After gathering your answers on the whiteboard, analyze them for patterns. If multiple responses highlight the same cause, you’ve likely identified the potential roadblock.
Best for: Cross-functional teams seeking a fast way to drill down into the causes of project delays without extensive analysis.
The ClickUp Daily Action Plan Template is a beginner-friendly tool that helps you identify and act on solutions to performance challenges, much like a fishbone diagram that organizes root causes.
However, this template goes further by splitting each root cause into specific action items, ensuring no detail is overlooked when driving improvement.
Start by filling in the performance improvement-related task details in the template’s ‘List’ view. Then, in the ‘Action Steps,’ you’ll see all your tasks and subtasks organized by the due date, making it simpler to track action items. Custom Fields help you assign responsibilities, categorize task complexity, and monitor key dates while documenting comments and reviews.
You can also switch to the ‘Goals Board’ view to see your tasks displayed as cards and organized by department.
Best for: Managers looking to improve employee performance using insights from past evaluations.
The ClickUp Project Retrospective Template gathers insights on project performance, highlighting successes, areas needing improvement, and actionable steps for future planning.
Start by sharing the intuitive Agenda Form with your team so they can share their views. Select the retrospective category (like ‘what went well,’ ‘lessons learned,’ or ‘alternative solutions’) and tag the relevant team.
The ‘Activity List’ organizes the feedback by project area, and the ‘Retrospect Board’ groups insights by retrospective category, offering a high-level look at hits, misses, and areas for growth.
Best for: Agile teams reviewing projects after completion to learn from successes and failures for future iterations.
While Word works for simpler analyses, it falls short when creating dynamic fishbone diagrams. The experience is more intuitive in ClickUp.
You’re not limited to static shapes or manual formatting, as ClickUp’s whiteboard fishbone templates give you drag-and-drop tools, custom shapes, and real-time collaboration features to brainstorm and organize ideas more efficiently.
With ClickUp, fishbone diagrams become interactive, actionable parts of your workflow. And the best part? These templates are completely free. 💰
Sign up on ClickUp for free and start transforming your brainstorms into actions, all in one place.
© 2026 ClickUp