


Still downloading templates?
There’s an easier way. Try a free AI Agent in ClickUp that actually does the work for you—set up in minutes, save hours every week.
Sorry, there were no results found for “”
Sorry, there were no results found for “”
Sorry, there were no results found for “”

Do you or your team often struggle to unravel the patterns or trends in your data sets despite multiple visualizations and tools?
There are several ways to represent data and make it visually appealing, such as using PowerPoint, creating a Pareto chart, and using data flow diagrams. However, none will do the trick unless you go granular and unravel the reasons behind the issues.
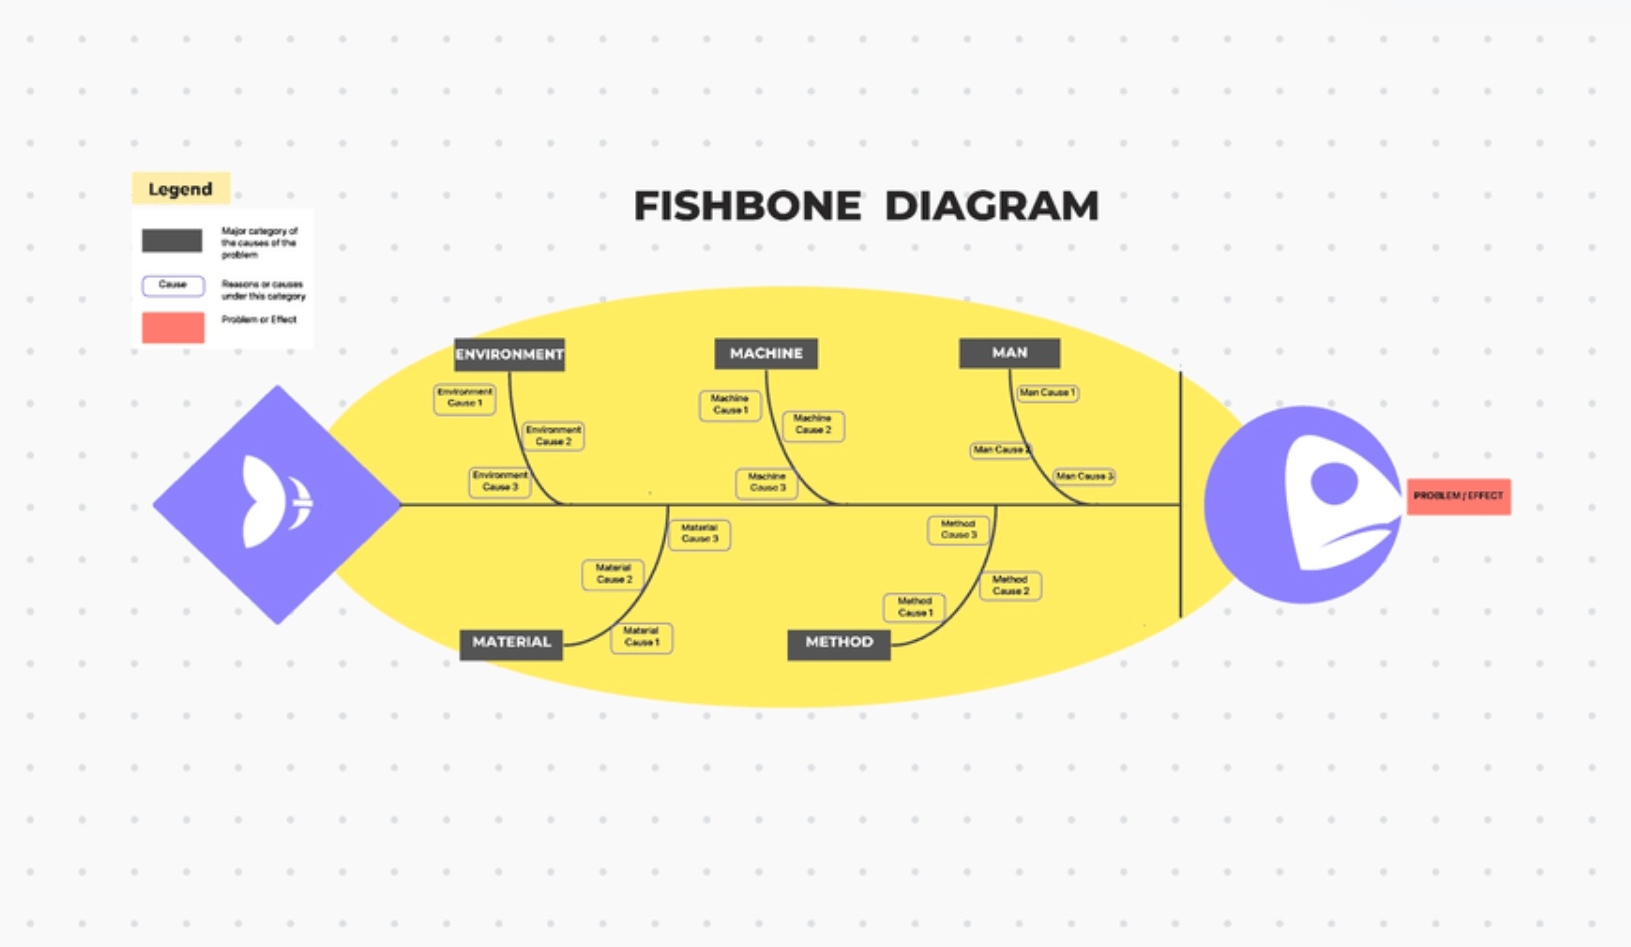
Fishbone diagram, also known as cause-and-effect diagram or Ishikawa diagram, is a powerful visual tool for identifying and pinpointing the root cause of a problem.
Looking to take your existing data and create a Fishbone diagram in Microsoft Excel? There is a way to do it manually, but it might result in a fishbone diagram with too many bones and the wrong shape. 😕
With a fishbone diagram template, you can eliminate all these problems and complete the task quickly without jumping through multiple hoops.
In this blog, we will find out about the best Fishbone diagram template Excel has and discover some alternatives that are much more intuitive and customizable.
A fishbone diagram template provides a clear structure for your data, allowing you to categorize potential causes into different categories and sub-causes, such as primary and secondary causes. This problem-solving method lets you get a clear picture of the factors contributing to a specific case and address them immediately.
A good Fishbone diagram template simplifies the process of identifying and analyzing the root causes behind any issue. It should ideally have the following characteristics:
Finding the right fishbone diagram maker for Microsoft Excel can be tricky. To skip over the research, we have curated a list of the top Fishbone diagram templates in Microsoft Excel:
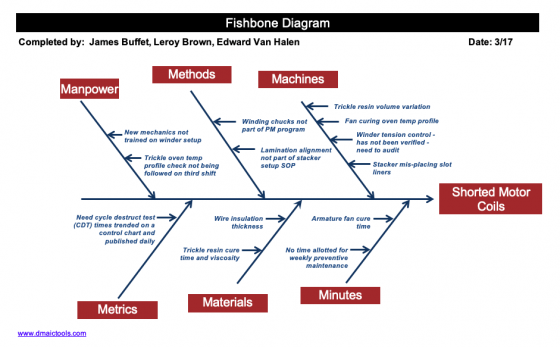
Let’s start the list with the popular Fishbone Diagram Excel Template by DMAICTools.com.
This template includes a comprehensive list of features to help you create fishbone diagrams. It includes predefined categories, instructions, color-coded branches, and various formatting options to enhance visual clarity, making it perfect for beginners.
This template is ideal for teams working in quality control, process improvement, or manufacturing environments. It could be used to identify root causes of defects, bottlenecks, or performance issues in various processes.
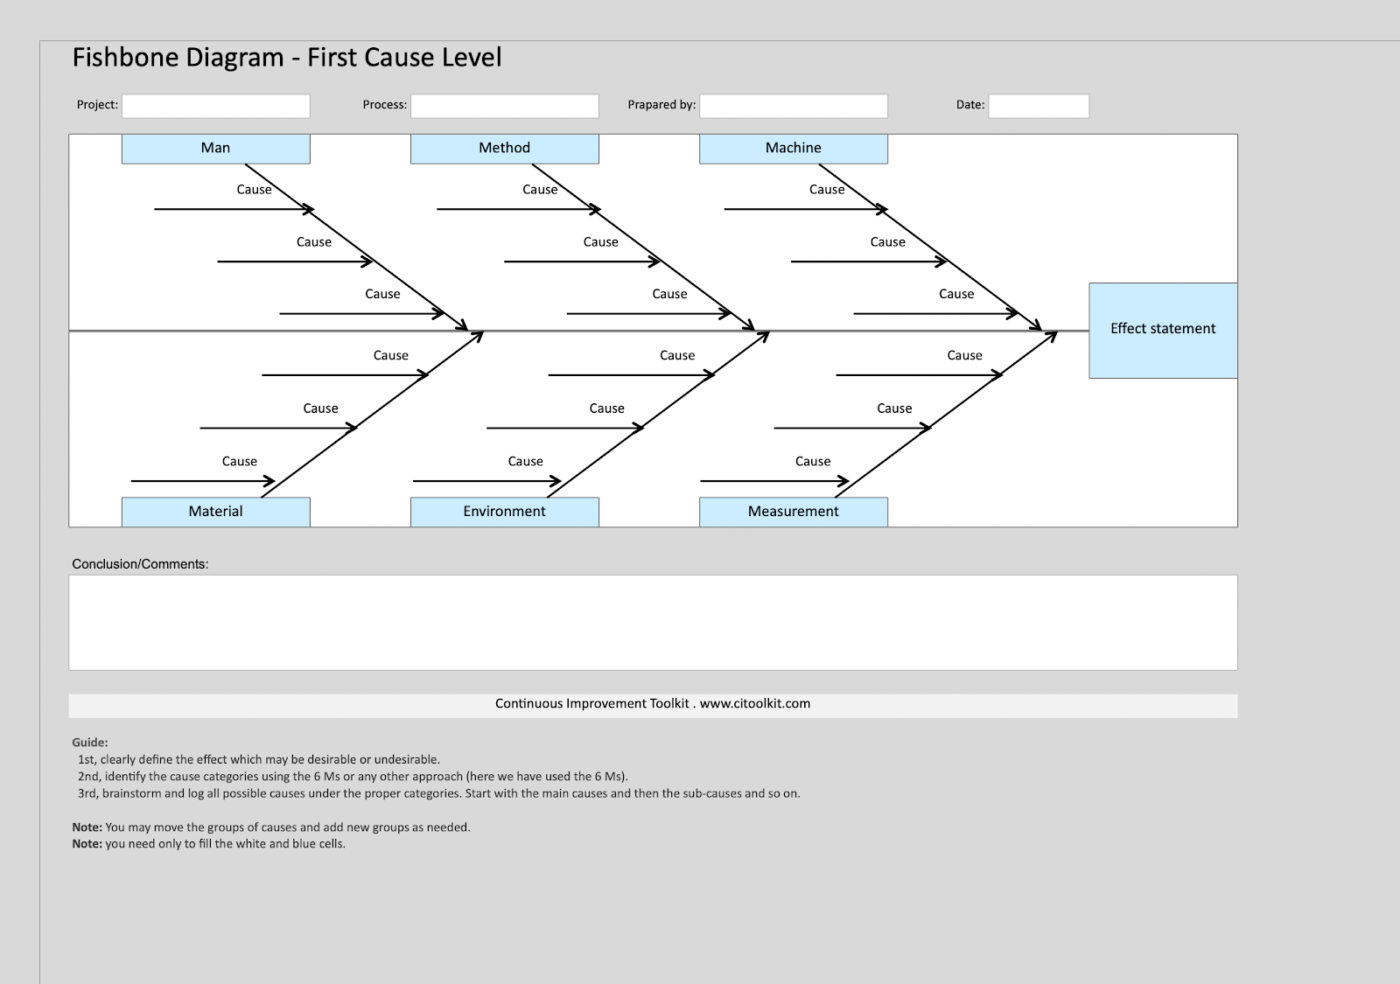
If you are looking for a simple and user-friendly approach to creating fishbone or Ishikawa diagrams in Excel, then the Excel Fishbone Diagram Template by CIToolKit is a great option. With its clean layout, clear instructions, and minimal customization options, this template is perfect for those who prefer a straightforward approach.
This template is useful for individuals or small teams who require a no-frills solution for designing fishbone diagrams. It is particularly useful for those who are new to using this technique or prefer a more streamlined approach.
Another easy-to-use and implement template, the Fishbone Diagram Template by Vertex42, comes with the bare minimum—no installation, no macros, just the structure that is customizable for your specific requirements.
The worksheet has a blank canvas and instruction text, which will help you understand how to implement the fishbone diagram in your business process.
This template is perfect for teams working on various projects or initiatives that require a flexible and customizable root cause analysis solution. For example, you can use this across fields such as engineering, project management, and quality assurance.
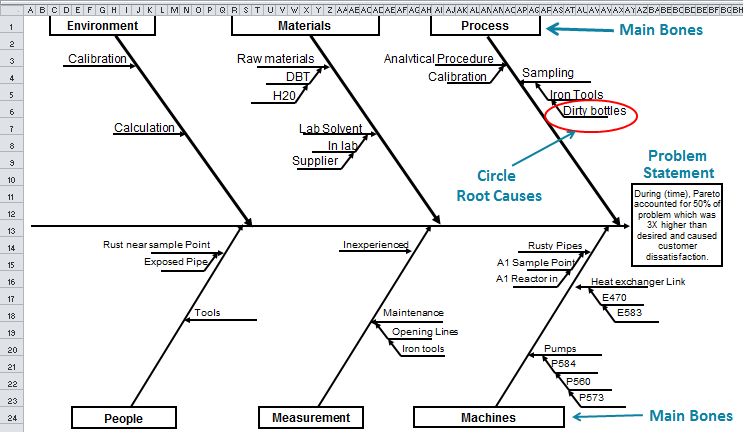
The QIMacros Excel Ishikawa Fishbone Diagram Template is designed for detailed root cause analysis. It offers more comprehensive grouping sections if you want to explore causes and potential solutions for your business operations fully.
The template includes features such as hierarchical levels, conditional formatting, and custom categories, making it suitable for you to draw in-depth data analysis from complicated issues.
This template is best for engineering teams or quality control departments that need to investigate the root causes of technical or production failures.
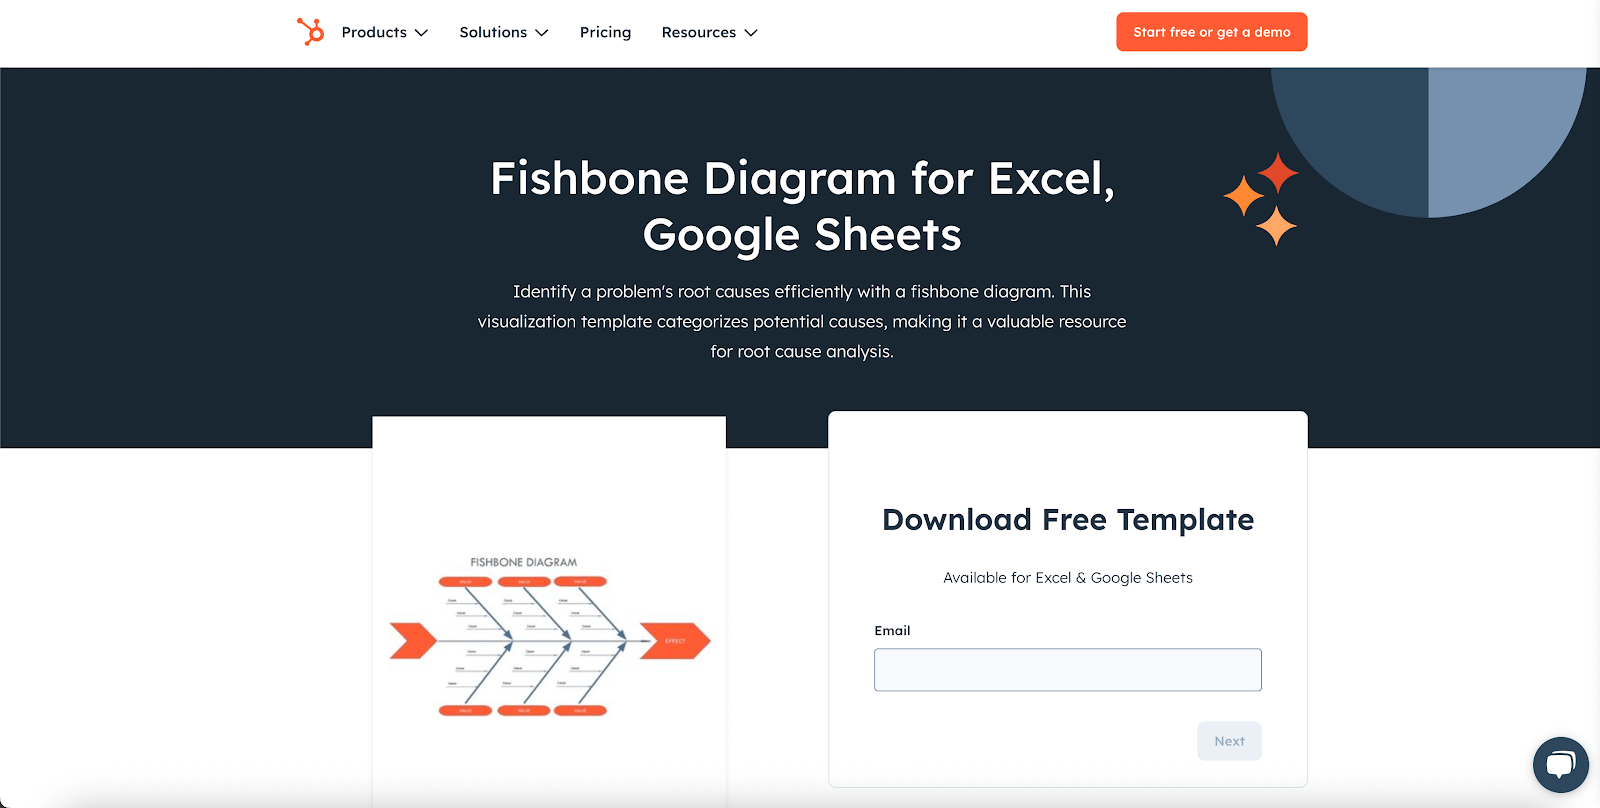
While most Ishikawa diagram templates can be used for multiple industries, they often get too complicated for basic root cause analysis. Hubspot’s Fishbone diagram template for Excel and Google Sheets falls under the category of a simple template that could be edited to add shapes and arrows according to user needs.
This sleek template features a drag-and-drop interface, real-time collaboration, and integration with other HubSpot tools, making it ideal for brainstorming sessions and whiteboarding.
This template is perfect for marketing teams or service industry professionals looking to analyze customer service issues or process inefficiencies quickly and visually.
Although several Excel fishbone diagram templates are great for problem-solving and drawing root cause analysis, they only do surface-level analytics. For more detailed workflow automation, this often feels limiting, with issues like:
To mitigate these issues, consider Excel alternatives to fishbone diagram templates that incorporate project management and data visualization tools.
A fishbone diagram must be clear, organized, and easy to use. This is where ClickUp’s customizable templates come into play.
Whether you’re dealing with over-simplification, time-consuming analysis, or subjectivity, ClickUp offers pre-built templates that optimize your process and ensure you capture every important detail without getting bogged down.
Here is a look at some of the top fishbone diagram templates from ClickUp:
If you need a template that can tackle complicated projects, the ClickUp Fishbone Diagram Template is designed just for you. This template offers a structure that will help you break down complex issues into manageable categories, enabling your teams to pinpoint what works and what doesn’t.
Whether you’re tackling a simple issue or working on a complex project, this fishbone template allows you to clearly define the problem, list potential causes, and assign tasks to team members for follow-up.
Plus, with ClickUp’s collaborative features, such as ClickUp Chat and assigned comments, every team member contributes effectively, making the analysis more comprehensive and reducing the chances of overlooking key factors.
This fishbone template is an excellent tool for teams working on complex projects, process improvement initiatives, or problem-solving efforts.
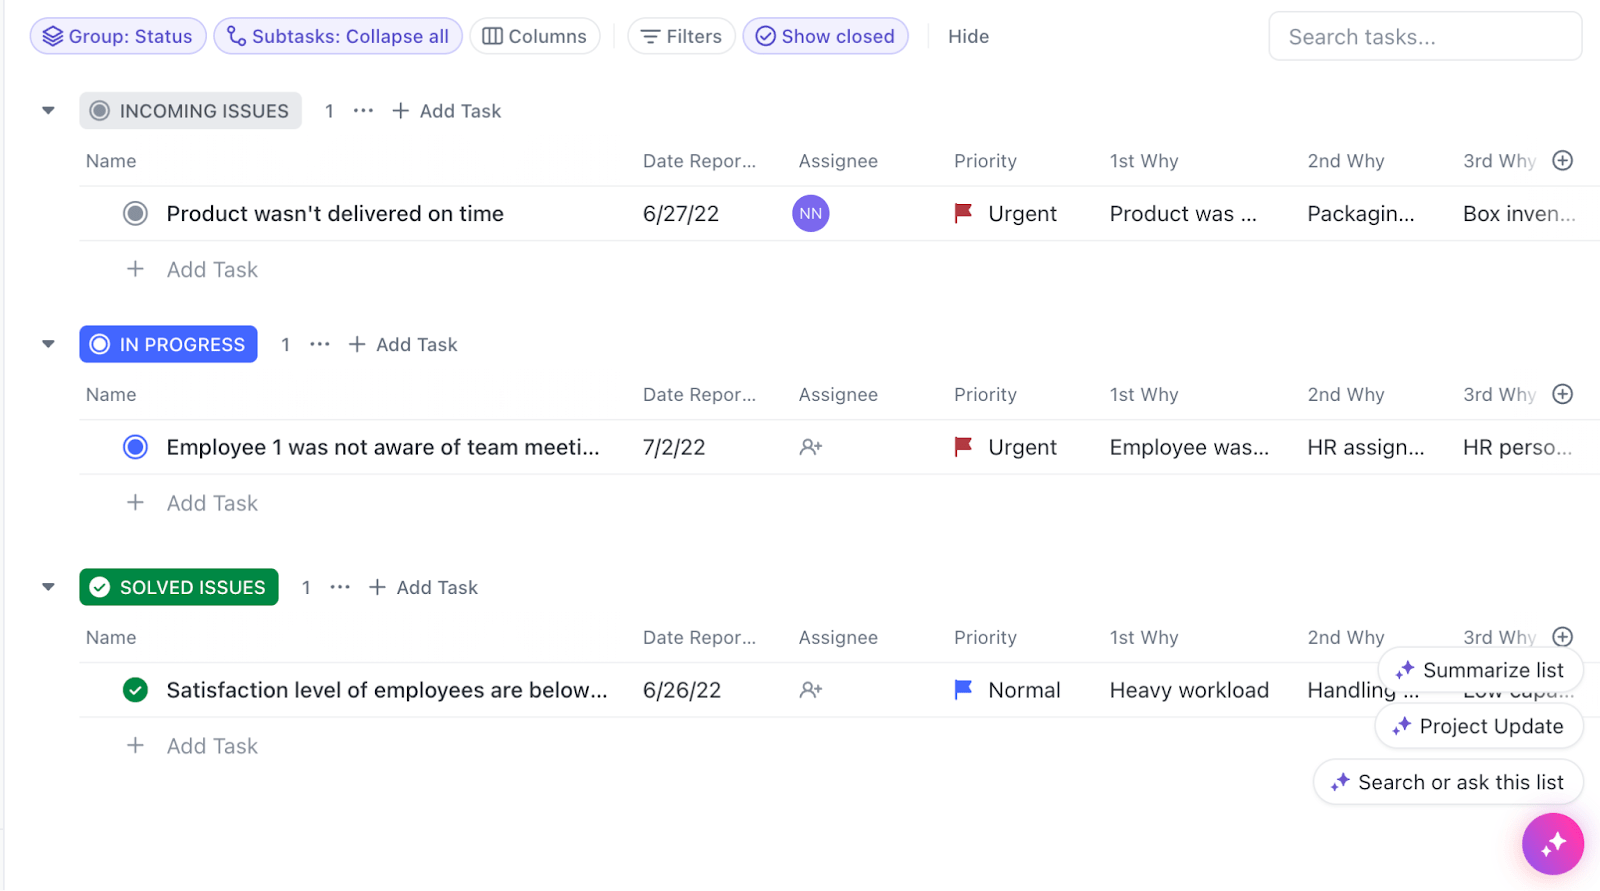
While most templates for analyzing root causes focus on visualization, the ClickUp Root Cause Analysis Template takes a more head-on approach.
It defines the root causes into three categories: incoming issues, in progress, and solved issues. Each category helps you get a clear picture of the issues currently in the pipeline, additional issues that may come up, and the ones you have already dealt with in a single dashboard.
Use this template to determine improvements in your problem-solving process and create a more detailed strategy to deal with it.
This template is best suited to teams seeking a comprehensive approach to root cause analysis, combining various techniques to address complex problems head-on.
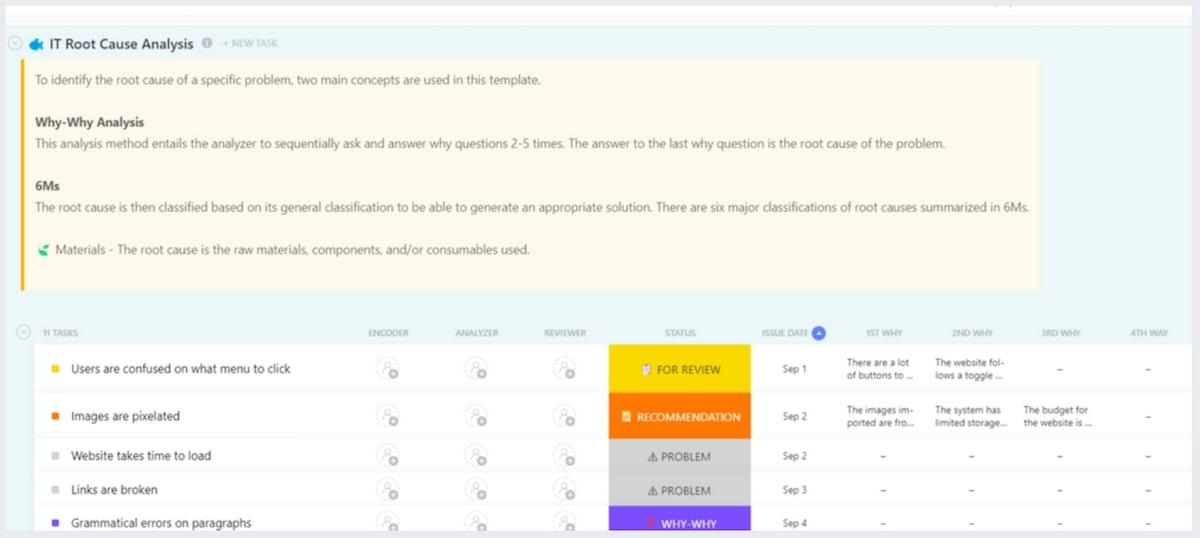
The ClickUp IT Root Cause Analysis Template is designed to help technology leaders, project managers, and teams plan and manage their tech initiatives effectively.
From software updates to infrastructure changes, this template lays out a clear path for problem-solving within the IT environment, ensuring all stakeholders stay aligned on the follow-up tasks and timelines.
As the name suggests, this template is built for IT teams that want to conduct in-depth analyses of their technical issues.
If you are looking for a fishbone diagram template to make your brainstorming sessions more efficient, the ClickUp Cause and Effect Whiteboard Template is your best bet.
This template provides a visual space for teams to brainstorm and create mind maps to understand the relationships between primary and secondary causes in various scenarios. It fosters creativity and collaboration, allowing teams to effectively capture ideas and analyze them visually.
This template is ideal for remote teams that want a cause-and-effect diagram template to facilitate brainstorming sessions, remote collaboration, and situations where a more informal and creative environment works best.
The ClickUp 5 Whys Template is a powerful tool designed to facilitate root cause analysis through a simple yet effective questioning technique.
By using the 5 Whys methodology in your problem-solving, teams drill down into the underlying causes of a problem, moving beyond symptoms to identify the root issues.
This template is perfect for all teams and industries who want to combine the 5 Whys technique with fishbone diagrams to analyze the hidden factors of issues in a structured and systematic method.
The ClickUp Performance Improvement Action Plan Template helps you objectively analyze the performance of a team or a project, identifying areas for improvement.
Use it to identify performance gaps and develop targeted strategies to elevate team and organizational performance.
This template is ideal for project managers, team leaders, and process improvement specialists. For example, this template could be used for performance reviews, quality assessments, or other initiatives aimed at enhancing operational efficiency and effectiveness.
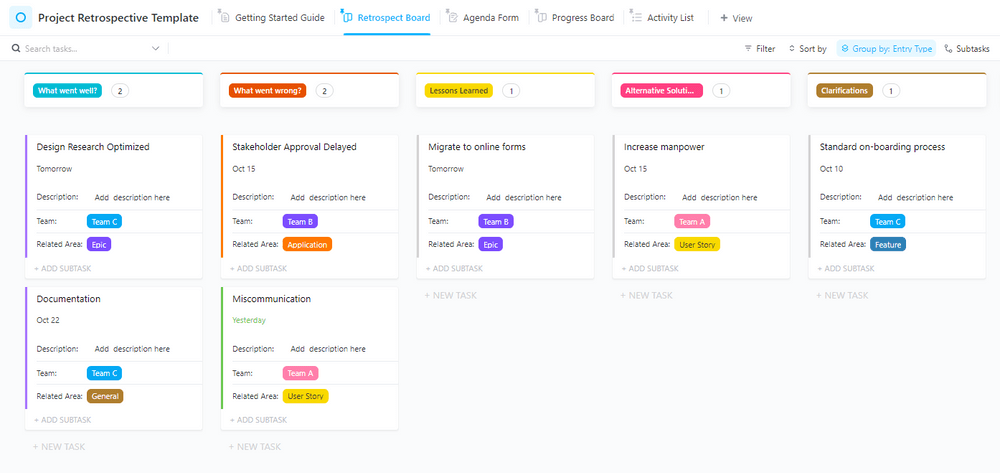
The Project Retrospective Template by ClickUp is an essential tool for teams looking to reflect on their project outcomes and identify lessons learned. This template enables structured discussions about what went well, what did not, and where teams should work to improve future projects.
By capturing insights and feedback, you’ll be able to encourage a culture of continuous learning and improvement within your organization.
This template is suitable for project managers, team members, and stakeholders who evaluate project success and areas for improvement.
Simply put, fishbone diagrams are powerful visual tools for identifying the root causes of problems.
While Excel and Sheets can be used to create these diagrams, they have severe limitations when it comes to real-time collaboration, customizable fields, visualization constraints, and integration issues with other project management tools.
Enter ClickUp’s fishbone diagram templates, which offer a more efficient and collaborative approach, empowering teams to find the answers without going through heaps of data and tables.
So, if you are looking for a comprehensive and collaborative tool for analyzing the data to the last detail, ClickUp is the ideal solution. Sign up for ClickUp today and experience the difference!

© 2026 ClickUp

There’s an easier way. Try a free AI Agent in ClickUp that actually does the work for you—set up in minutes, save hours every week.