


Still downloading templates?
There’s an easier way. Try a free AI Agent in ClickUp that actually does the work for you—set up in minutes, save hours every week.
Sorry, there were no results found for “”
Sorry, there were no results found for “”
Sorry, there were no results found for “”

When you’re designing a new layout, like a building plan or software architecture, things can get messy fast.
One person sketches ideas, another jots changes elsewhere, and soon, no one remembers how it all fits together. 🖌️
A solid adjacency matrix template comes in handy here. It gives you a clear, visual way to map out connections between elements, so you’re not relying on scattered notes or half-remembered discussions.
In this blog post, we’ll walk through 14 free ClickUp adjacency matrix templates that make it simple to set up and customize your own. 💁
Adjacency matrix templates are visual tools that map relationships between elements in a structured grid format. They make it easier to understand how different parts of a system interact, influence, or depend on one another.
Each row and column represents a specific item—such as a team, task, or component. The intersecting cells show where connections exist, how often they occur, or how strong those relationships are. You can spot overlaps, gaps, or potential conflicts at a glance.
These templates simplify complex workflows and map dependencies that often get lost in linear documents.
Here’s a summary table with the best adjacency matrix and relationship mapping templates:
| Template Name | Download Template | Best Features | Ideal For | Visual Format |
| ClickUp Adjacency Matrix Template | Get Free Template | Color-coded, drag-and-drop, visualizes spatial relationships | Space planning, system mapping | ClickUp Whiteboard |
| ClickUp Criteria Matrix Interior Design Template | Get Free Template | Custom fields, multiple views, requirements tracking | Interior design, layout planning | ClickUp List, Board, Matrix |
| ClickUp Entity Relationship Diagram Template | Get Free Template | Drag-and-drop, real-time collaboration, task linking | Database design, data modeling | ClickUp Whiteboard |
| ClickUp Kinship Diagram Whiteboard Template | Get Free Template | Color/shape/line coding, pre-labeled elements | Family trees, lineage mapping | ClickUp Whiteboard |
| ClickUp Traceability Matrix Template | Get Free Template | Custom fields, relationship mapping, multiple views | Requirements tracking, project alignment | ClickUp List, Board, Matrix |
| ClickUp Organizational Chart Template | Get Free Template | Drag-and-drop roles, visual hierarchy, easy updates | Team structure, onboarding | ClickUp Whiteboard |
| ClickUp Family Tree Template | Get Free Template | Photos, milestones, collaborative, multi-gen | Family history, genealogy | ClickUp Whiteboard |
| ClickUp Process Map Whiteboard Template | Get Free Template | Drag-and-drop, custom stages, status tracking | Workflow mapping, process design | ClickUp Whiteboard, List |
| ClickUp User Flow Template | Get Free Template | Labeled steps, shapes for actions/decisions, branching | UX design, product journeys | ClickUp Whiteboard |
| ClickUp Project Network Diagram Template | Get Free Template | Node-and-arrow, critical path, resource assignment | Project planning, dependency mapping | ClickUp Whiteboard |
| ClickUp Blank Mind Map Whiteboard Template | Get Free Template | Color-coded, drag-and-drop, open layout | Brainstorming, idea mapping | ClickUp Whiteboard |
| ClickUp Swimlane Flowchart Template | Get Free Template | Team lanes, standard symbols, process mapping | Role clarity, process mapping | ClickUp Whiteboard |
| ClickUp Dependency Mapping Template | Get Free Template | Assignable dependencies, risk tracking, single source of truth | Project risk management, delivery tracking | ClickUp Doc |
| ClickUp Bubble Map Template | Get Free Template | Radial format, color-coded, concept mapping | Brainstorming, category mapping | ClickUp Whiteboard |
When your system grows—whether it’s a next project, a reshuffled break room, or a redesigned board room—keeping everything connected can feel like solving a puzzle without a guide.
And a cluttered matrix does more harm than good.
The right template makes complex systems manageable, giving you a clear view of how everything connects. Here’s what separates a good one from the rest. ⛏️
🧠 Fun Fact: Mind maps mirror how your brain naturally works. The concept is based on radiant thinking, where ideas fan out from a central point, just like your thoughts do when brainstorming.
Whether you’re working using Carolyn Jean Matthews’ principles on space planning or tagging additional information as input, it all starts with clarity.
ClickUp, the everything app for work, has a solid lineup of adjacency matrix templates to get you started. Here are 14 that are worth a look. 👀
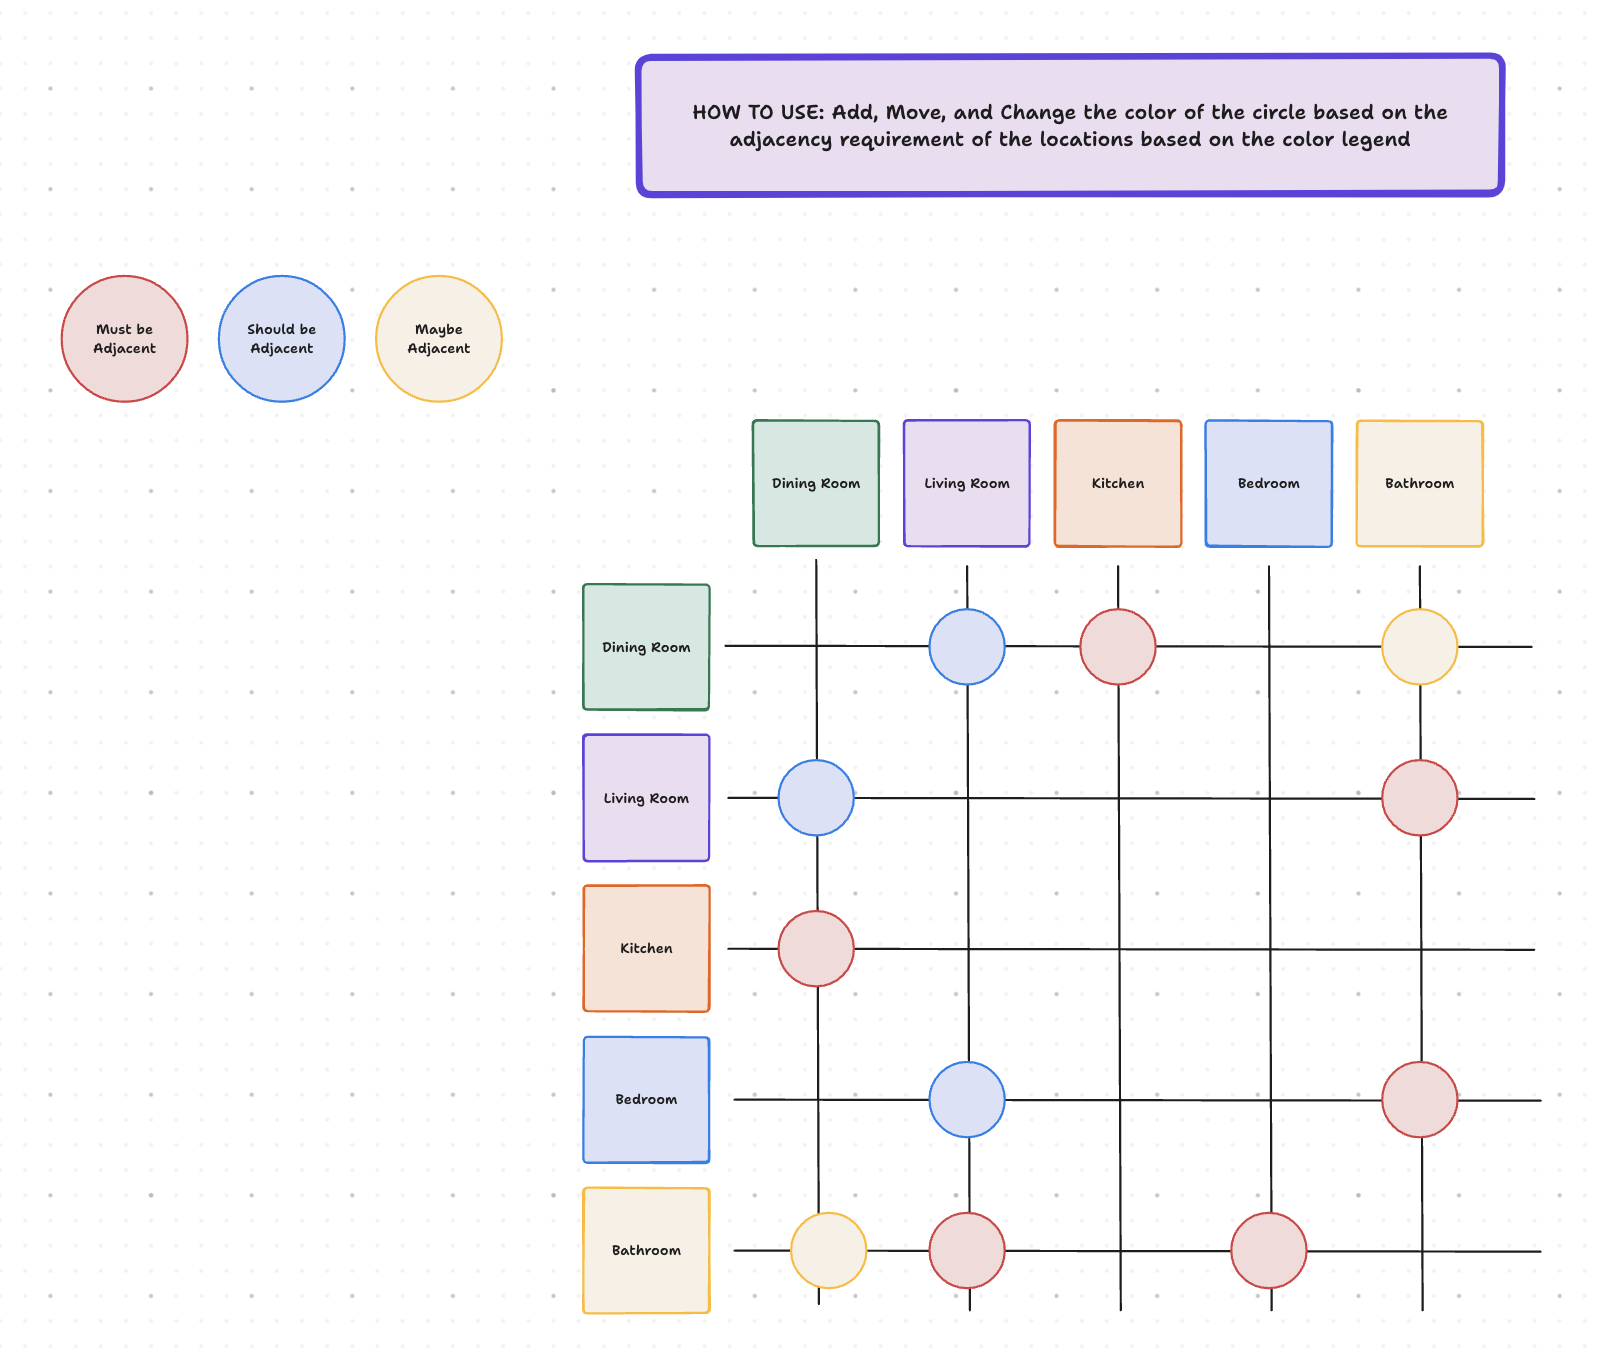
The ClickUp Adjacency Matrix Template helps you visualize how different locations or elements connect within a system. Labels along the X and Y axes form a grid where each intersection represents a potential relationship.
Using simple visual cues to highlight strong, moderate, or optional connections, you can drag and color-code circles to show how closely two points should be positioned. Red = must be next to each other, blue = should be close, yellow = nice-to-have.
📌 Ideal for: Visualizing spatial relationships and positioning elements accurately within an adjacency matrix diagram.
🔍 Did You Know? The global interactive whiteboard market is estimated to expand to $9,706.1 million from 2024 to 2034 with the mass adoption of advanced educational tools and collaborative technologies. The industry is foreseen to register a compound annual growth rate (CAGR) of 9.7%.
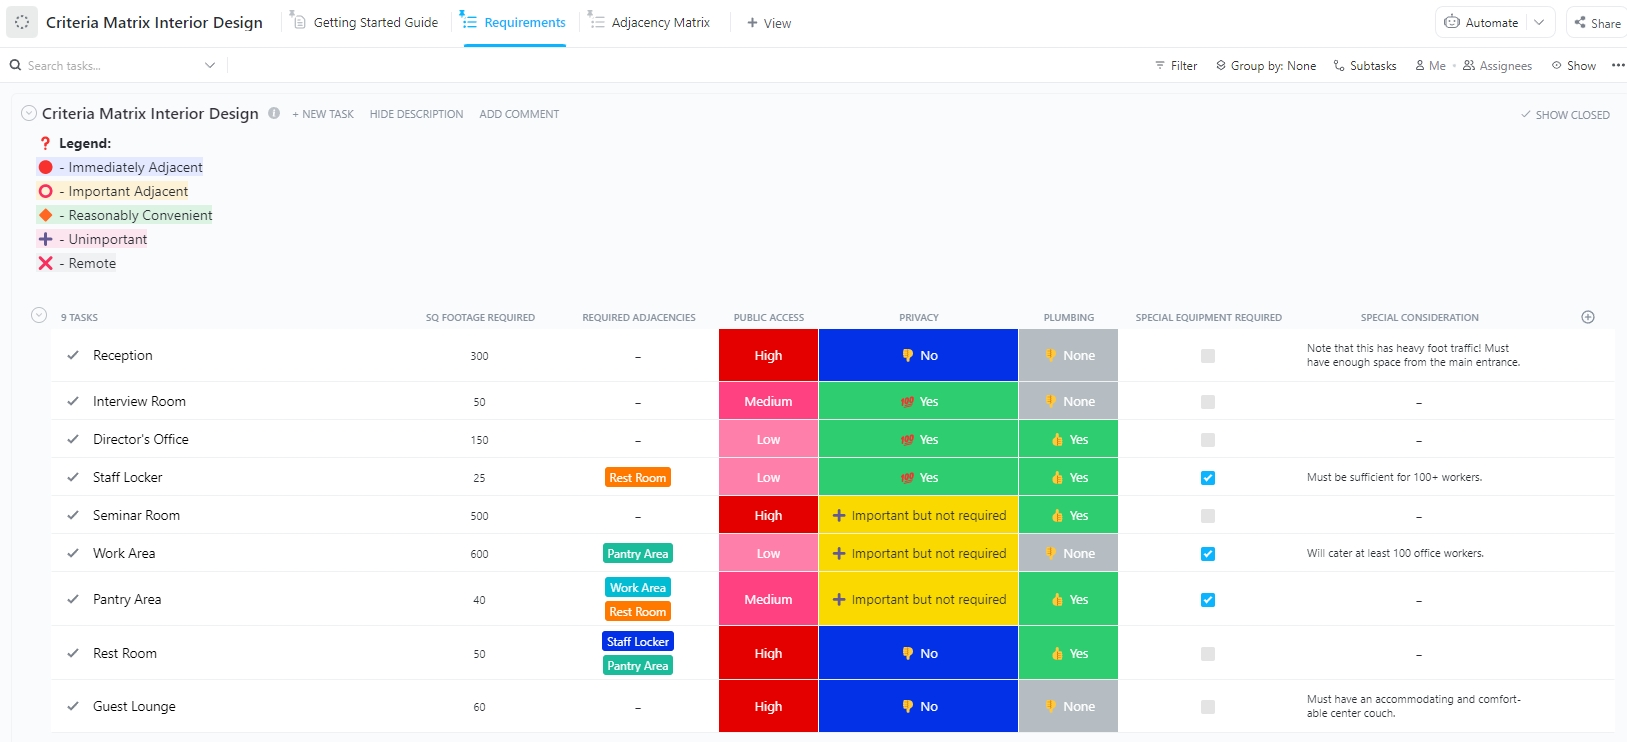
The ClickUp Criteria Matrix Interior Design Template organizes your priorities, design requirements, and progress into one space.
Using pre-set ClickUp Custom Fields, you can document all your design criteria—like square footage needs, required adjacencies, or special considerations. These fields help you sort, visualize, and update information as the project evolves.
You’ll also get access to helpful views like an Adjacency Matrix for layout planning, a Requirements view for quick reference, and a Getting Started Guide to kick things off with clarity.
📌 Ideal for: Organizing design requirements, layout preferences, and project-specific criteria in a structured format.
The ClickUp Entity Relationship (ER) Diagram Template is a handy way to visualize how your data connects before writing any code.
Built inside ClickUp Whiteboards, the template allows you to drag and drop entities, define relationships, and even add tasks or custom fields to each one. It also helps you unlock new insights into your dataset and identify potential issues to improve data modeling accuracy.
Want to mark a status, assign subtasks, or loop in teammates? You can do all that inside the entity relationship diagram as well.
📌 Ideal for: Mapping data relationships, structuring databases, and identifying how entities connect within a system.
The ClickUp Kinship Diagram Whiteboard Template is your go-to tool for mapping family trees without confusion. Use its visual structure to trace multiple generations, highlight complex connections like remarriages or cousin links, and distinguish maternal and paternal lines at a glance.
Plus, you’ll notice how color, shape, and line styles signal gender, marital status, and life status. With pre-labeled elements like ‘uncle,’ ‘cousin,’ and ‘niece,’ you won’t need to fuss about formatting workflow diagrams either.
📌 Ideal for: Outlining complex family trees, tracking lineage, and illustrating generational relationships clearly.
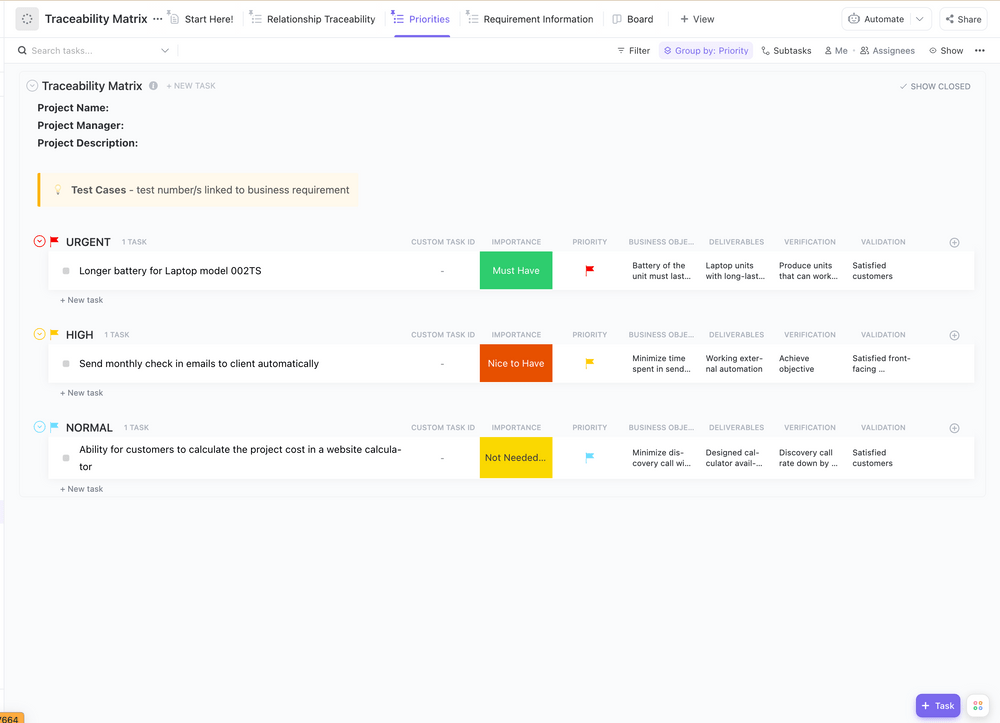
The ClickUp Traceability Matrix Template helps you stay in control of complex project relationships without getting overwhelmed.
Custom Fields such as Business Objectives, Test Cases, Deliverables, and Importance help you document and visualize what really matters. It’s also easy to switch between detailed views like Relationship Traceability, Priorities, Board, and Requirement Information to keep everything structured and transparent.
📌 Ideal for: Tracking project requirements, linking deliverables, and ensuring alignment between goals and outputs.
💟 Bonus: Can’t quite see how things connect? 🤔 Get AI to help you!
Brain MAX, the AI super app from ClickUp, can connect all of it together for you. Just talk to it and it’ll surface the insights you need. 🫡
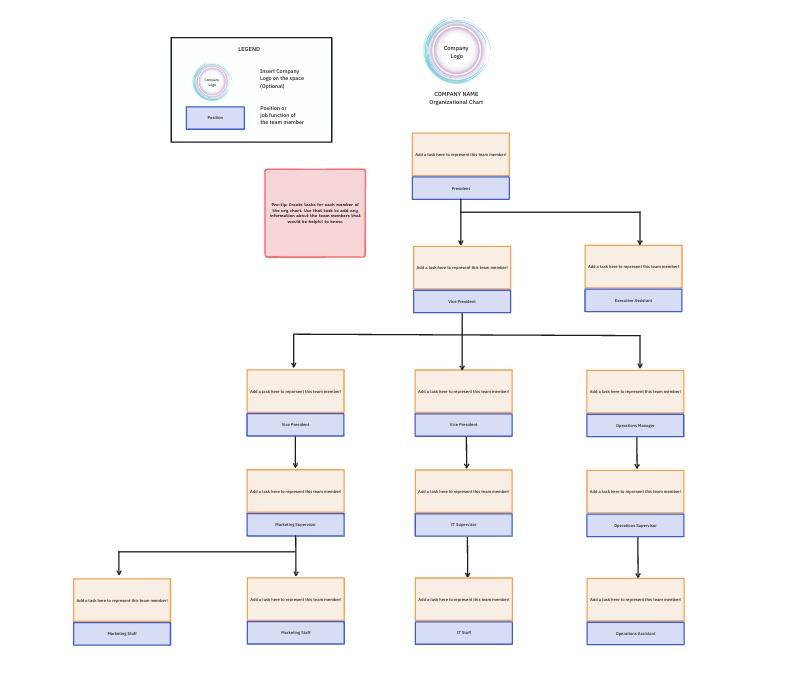
The ClickUp Organizational Chart Template clearly lays out your team’s hierarchy—from the president down to support staff—so everyone knows who’s doing what. This makes it easy to represent roles, update organizational structures, and onboard new team members faster.
The template also includes a drag-and-drop legend for roles and a simple layout to show reporting lines between executives, managers, and staff.
📌 Ideal for: Structuring team hierarchies, clarifying reporting lines, and visualizing organizational roles effortlessly.
🤝 Friendly Reminder: Don’t overlook partial or indirect adjacencies—they can support convenience without cluttering high-traffic zones. Use dashed lines or softer colors in your matrix for these.
The ClickUp Family Tree Template helps you capture your lineage in a clear, visual format.
You can add photos, names, and connections across multiple generations using a structured layout. Each member’s place in the family tree is easy to identify, making tracing relationships and preserving history simple.
The template is built for collaboration so relatives can contribute details, share memories, and build the tree together. It’s ideal for organizing milestones like births, marriages, and family expansions while keeping everything neatly arranged on a customizable Whiteboard.
📌 Ideal for: Capturing family history, preserving generational details, and visually organizing ancestral records in one view.
The ClickUp Process Map Whiteboard Template turns scattered workflows into structured, easy-to-follow visuals. With drag-and-drop functionality, you can map each stage—complete with goals, activities, and action items—across colorful columns that guide your team from start to finish.
The template also includes customizable fields and statuses like Open and Complete and offers multiple views, including a Getting Started Guide, List, and Whiteboard.
📌 Ideal for: Breaking down workflows, mapping process stages, and visualizing step-by-step operational tasks.
📖 Also Read: Relationship Mapping Software for Sales Teams
The ClickUp User Flow Template is a standout visual tool for mapping intuitive and engaging user journeys across websites, mobile apps, or product experiences.
Each flow includes clearly labeled steps with a mix of shapes (rectangles for actions, diamonds for decisions), allowing you to lay out both linear and branching journeys. From designing a new website to creating a mobile app, this template helps you ensure your users stay engaged and keep coming back for more.
📌 Ideal for: Designing intuitive user journeys, visualizing product interactions, and improving the overall customer experience.
The ClickUp Project Network Diagram Template provides a straightforward way to plan, track, and manage task dependencies across any project. It uses a node-and-arrow structure to connect tasks, letting you see what needs to happen and in what order.
You can define durations, track progress, and identify the critical path so you’re always focused. Use built-in Custom Fields to assign resources, flag risks, and outline deliverables. Since the template lives in ClickUp, updates are quick, and collaboration stays seamless.
📌 Ideal for: Planning project tasks, mapping dependencies, and visualizing task sequences and timelines.
The ClickUp Blank Mind Map Whiteboard Template gives you a clean, open layout to expand on a central idea and connect everything that branches out. Start with your main theme, then add related goals, action items, or notes, and link them visually to keep everything aligned.
Color-coded elements, floating tasks, and drag-and-drop editing make it easier to spot gaps, spark new connections, and create structure out of chaos. These mind maps ensure you’re not stuck in a linear process and clarify even the messiest brainstorms.
📌 Ideal for: Brainstorming ideas freely, organizing concepts visually, and building structured mind maps with flexibility.
🔍 Did You Know? The term ‘mind map’ was first introduced to the world in 1974 by Tony Buzan on a BBC TV show called Use Your Head. Watch this video to know more: Use Your Head – Tony Buzan: The Mind Map Inventor (1974)
The ClickUp Swimlane Flowchart Template helps you break down complex processes by assigning tasks across lanes based on ownership. With clearly defined roles—like Assigned A through D—you can map out each step, decision point, and handoff without losing sight of who’s doing what.
This swimlane template includes standard symbols to keep everything easy to follow: rounded rectangles for start and end points, squares for tasks, diamonds for decision checkpoints, and arrows to indicate task flow.
📌 Ideal for: Clarifying roles, dividing responsibilities, and mapping processes across multiple teams or departments.
The ClickUp Dependency Mapping Template provides a structured way to document, assign, and resolve project dependencies. Housed in ClickUp Docs, it combines clarity and accountability, making managing interdependencies across teams and timelines easier.
You can break down each dependency, assign owners, and list targeted action items directly in the doc. This makes it easier to identify potential delays early, align stakeholders on the next steps, and keep delivery on track without relying on scattered updates.
📌 Ideal for: Managing project interdependencies, tracking potential risks, and assigning ownership for seamless delivery.
💡 Pro Tip: Use color coding in your matrix. Differentiate desired, secondary, and undesired adjacencies using distinct colors; this makes interpreting relationships much faster, especially in large layouts.
The ClickUp Bubble Map Template turns abstract concepts into structured visuals. At the center sits your main category, branching into four subcategories—each linked to supporting adjectives.
Color-coded bubbles distinguish between the main idea, subcategories, and descriptors, making the flow easy to follow. The radial format keeps everything connected while highlighting key patterns or gaps.
📌 Ideal for: Organizing core ideas and related details and mapping categories or concepts in a structured layout.
📖 Also Read: Best Mind Mapping Software Tools
Adjacency matrix templates help you visualize your ideas and process.
That means figuring out which elements are adjacent, which are secondary, and how everything—from file and table placements to client or marketing flows—fits together.
They’re great for space planning, workflow design, or even team collaboration strategies.
With ClickUp’s free primary and secondary adjacency matrix templates, mapping your system becomes smarter, simpler, and way more collaborative. Launch your action items directly from the whiteboard or doc and start executing right away!
Sign up for ClickUp today! ✅

© 2026 ClickUp

There’s an easier way. Try a free AI Agent in ClickUp that actually does the work for you—set up in minutes, save hours every week.