


Still downloading templates?
There’s an easier way. Try a free AI Agent in ClickUp that actually does the work for you—set up in minutes, save hours every week.
Sorry, there were no results found for “”
Sorry, there were no results found for “”
Sorry, there were no results found for “”


Remember those overlapping circles you learned about in middle school? Yes, we’re talking about Venn diagrams. They’re great at comparing and contrasting sets of data and forming logical relationships.
As you can expect, they’re used extensively in data analysis and to explore data sets, create visualizations, and support data-driven decision-making. But if we’re being honest—drawing those circles to line up perfectly and adding different symbols is not the easiest thing to do.
In this blog, we’ll explore how to create Venn diagrams while explaining the multiple Venn diagram symbols that go with them. As a bonus, we’ll also share additional resources and templates to help you level up your data visualization skills.
⚠️Warning: Some math ahead!
Each circle in a Venn diagram represents a set, which is a collection of distinct objects. Venn diagram symbols break down complex ideas by showing the connections between different sets. That’s why they’re also considered an important part of set theory.
Now here comes the fun part—Venn diagrams can be made of multiple circles.
Two-circle Venn diagrams are great for understanding the union, intersection, and differences between two sets.
Three-circle Venn diagrams are even more detailed, as they show relationships between three sets and can help find correlations within different sets of data.
With so much information circling in these diagrams, it is helpful to have symbols that represent the different relationships between these sets. This is where Venn diagram symbols come in.
Did You Know: John Venn, an English logician, made the Venn diagram famous in the 1880s. You’ll see them a lot in probability, logic, statistics, linguistics, and computer science to illustrate the logical connections between sets.
Among all the different nomenclatures, three main Venn diagrams are most commonly used: union, intersection, and complements.

The union of sets in a Venn diagram is represented by the union symbol ( ∪ ). It shows all elements present in either set. When using Venn diagram symbols, the union symbol illustrates the combination of elements from two or more sets.
Consider this example.
Two sets:

The union of sets A and B (A ∪ B) includes all the elements from both sets:
i.e. A ∪ B = {1, 2, 3, 4, 5}

In a two-circle Venn diagram, the union would be the entire area covered by both circles, including the overlapping region.
Example: Imagine a school cafeteria offering two meal plans:
Using Venn diagram sets symbols, we can represent these meal plans as:
The union of these sets (A ∪ B) represents all the food options available to students who have either Plan A or Plan B, or both.
So, A ∪ B = {pizza, salad, fruit, pasta, dessert}
A Venn diagram would show two overlapping circles: one circle for Plan A, one for Plan B. The overlapping part would contain “salad,” as it’s offered in both plans. The entire area covered by both circles would represent the union of the sets—all possible food options, which are pizza, salad, fruit, pasta, and dessert.
Friendly note: If you’d like to pause, go ahead and hydrate yourself, look outside the window, or hug your family so we can comfortably move on to more Venn diagram examples.
The intersection of sets is represented by the intersection symbol ( ∩ ). It shows elements common to both sets and is highlighted with overlapping circles.
Let’s have a look at the same example from above.
The intersection of sets A and B (A ∩ B) includes only the common elements:
Therefore, A ∩ B = {3}

The example above is a two-circle Venn diagram. The intersection is the shaded region “C”, where the circles overlap. It represents the element common to both sets.
Example: Imagine a tech company with two departments:
The intersection of these departments would include roles or employees who work in both areas. For example, a product manager might be involved in both software development and product marketing.
Again, by using Venn diagram sets of symbols, we can represent the departments:
A Venn diagram would visually represent this overlap, with “product management” in the overlapping section of the two circles.
The complement of a set is represented by the complement symbol (Ac) or (A’). It includes all elements in the universal set (U) that are not in the particular set. Using Venn diagram symbols, the complement highlights areas outside the set in question.
For example, if:

The complement of set A (Ac) includes elements in U that are not in A:
Hence, Ac/A’= {4, 5}

In a three-circle Venn diagram, the complement would be the area outside circle A. The example below clearly shows what is excluded from set A.

Example: Imagine a marketing campaign targeting a specific demographic.
The complement of set A (A’) would include all individuals in the city who are either:
Now that we’ve gone over the basic symbols, let’s look at a few of the more complex Venn diagram symbols and their meanings:
The ∈ symbol means “is an element of” a set.
For example, if 3 ∈ A, it means 3 is in Set A. In Venn diagrams, this symbol helps us see which elements are inside the circles.
In computer science, we often use it to show membership, like “x ∈ A” to indicate that x is part of Set A.
The ∉ symbol means “is not an element of” a set.
If 4 ∉ B, it means 4 isn’t in Set B. In Venn diagrams, this symbol shows elements outside the circles.
Imagine a Venn diagram example: elements outside the circles aren’t part of those sets. It’s like saying, “4 doesn’t belong to Set B.” The symbol is key in set theory for showing exclusion.
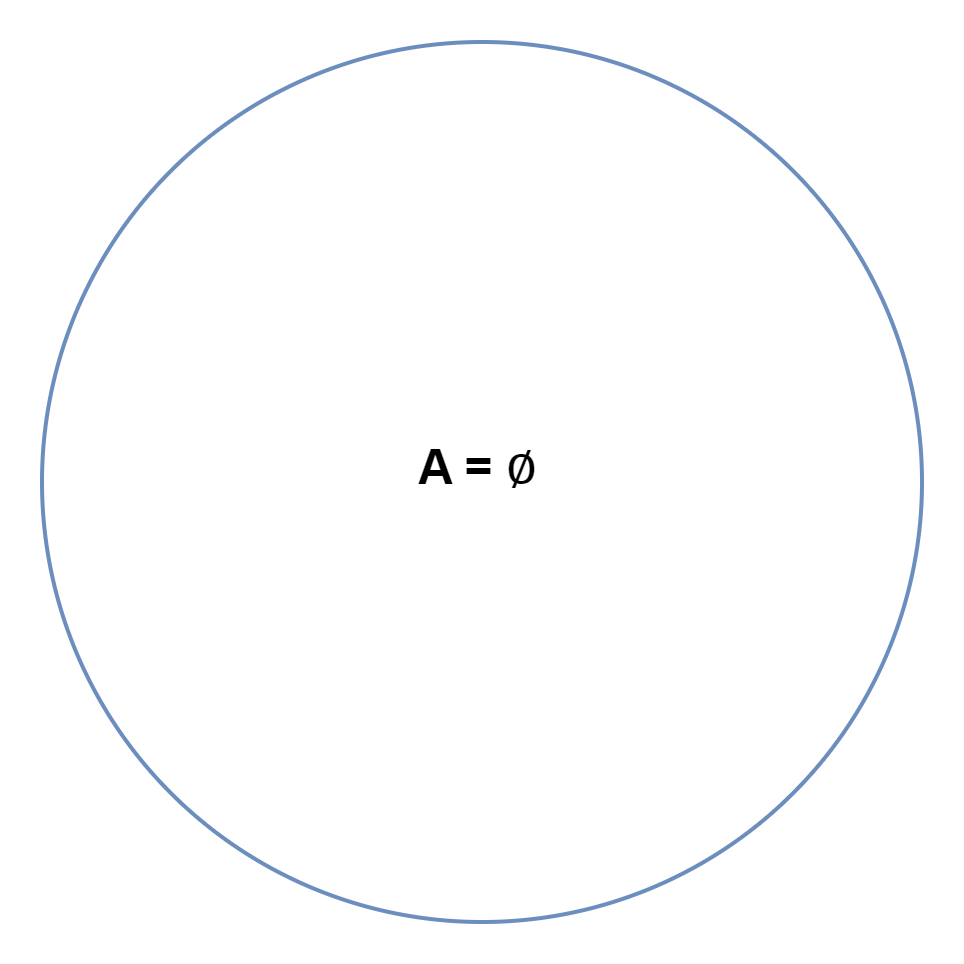
The Ø symbol represents the empty set, which has no elements. If A = Ø, Set A has nothing in it. In Venn diagrams, it shows a set without members.
In computer science, Ø appears in algorithms dealing with empty data sets, showing non-existence. It’s a way to say, “There’s nothing here.”

The ⊂ symbol means one set is a proper subset of another. If A ⊂ B, all elements of A are in B, but A isn’t equal to B.
In Venn diagrams, this shows one circle completely inside another. Think of a set diagram: a smaller circle within a larger one is a proper subset.
In a logical diagram, “C ⊂ D” means C is a subset of D, highlighting hierarchical relationships.
The ⊄ symbol means one set isn’t a subset of another. If A ⊄ B, some elements in A aren’t in B.
In Venn diagrams, it is shown by circles that don’t fully overlap. Picture a Venn diagram example with partial or no overlap between circles.
To show that A is not a subset of B, we need to show an element x that belongs to A but not B.
There are three possibilities:

This symbol is crucial in set theory for emphasizing non-inclusion.
The ⊇ symbol means one set is a superset of another. If A ⊇ B set A contains all elements of set B.
In two-circle Venn diagrams, it appears as one circle encompassing another.

In a three-circle Venn diagram, a larger circle containing a smaller one is a superset.

This symbol is important in set theory for showing full inclusion.
The ⊃ symbol indicates a proper superset. If A ⊃ B, Set A has all elements of B and more.
In a two-circle Venn diagram, a larger circle encompassing a smaller circle is a proper superset. For a three-circle Venn diagram, the larger circle encompasses the remaining two circles.
The basic depiction would be:

This symbol is essential in set theory for showing full but non-equal inclusion. In a logical diagram, “I ⊃ J” means I includes all elements of J and additional ones.
The ⊅ symbol means one set isn’t a proper superset of another. If A ⊅ B, Set A doesn’t fully contain B with additional elements.
In a Venn diagram example, circles that don’t fully contain others represent this concept.
Venn diagrams may seem like a long-forgotten remnant from middle school math class, but they are incredibly powerful at conveying data insights. Here’s how you’d use them for work.
Venn diagram use cases:
Now, let’s look at how you can create Venn diagrams. But before that, you should also know how set notation and shaded regions work.
Set notation is the language used to define sets, their relationships, and operations. This includes Venn diagram symbols like ∪ (union), ∩ (intersection), and ‘ (complement).
The idea of these symbols is to express complex logical statements. It’s essentially a way to condense a lot of information into an easy-to-understand format.
Similarly, shaded regions in Venn diagrams offer a visual counterpart to set notation.
Shaded regions allow us to perceive patterns, overlaps, and exclusions. By shading specific areas, we can highlight the outcomes of set operations, making complex relationships easily understandable.
Now that we’ve been through a math minefield and survived, let’s get to the easy bit: creating diagrams. We’ll cover both two and three-set Venn diagrams here.
Step 1: Identify the sets and elements
Example: Set A contains {1, 2, 3}, and Set B contains {3, 4, 5}.
Step 2: Draw two overlapping circles

Step 3: Add elements to the circles
Example: Place 1, 2 in Set A’s circle, 4, 5 in Set B’s circle, and 3 in the overlapping area.

Step 4: Shade regions for specific operations
Example: Shade the entire area of both circles for A ∪ B (union). Shade only the overlapping area for A ∩ B (intersection).

Step 5: Review and adjust
Step 1: Identify the sets and elements
Example: Set A contains {1, 2}, Set B contains {2, 3}, and Set C contains {1, 3, 4}.

Step 2: Draw three overlapping circles
Step 3: Add elements to the circles
Example: Place 1 in Set A and Set C’s overlapping area, 2 in Set A and Set B’s overlapping area, and 3 in Set B and Set C’s overlapping area. Place 4 in Set C.

Step 4: Shade regions for specific operations
Example: Shade the entire area of all circles for A ∪ B ∪ C (union). Shade only the central overlapping area for A ∩ B ∩ C (intersection).

Step 5: Review and adjust
Three-circle Venn diagrams showcase more complex relationships and set differences. They also illustrate how elements are distributed across multiple sets.
Also Read: How to Create a Venn Diagram in Google Docs
Creating custom Venn diagrams is easy. They can be made in MS Word, PowerPoint, and even Paint. There are lots of other free and paid Venn diagram templates available on the internet as well. Whatever you choose, it’s recommended to watch tutorials and double-check the functionality of any templates before considering them.
Topping the list of options, though, is ClickUp, a tool that makes creating Venn diagrams and data visualization a breeze. And the best part? It comes with amazing free templates.
Bonus: Free Venn Diagram Templates
ClickUp’s Venn Diagram Template helps create beautiful diagrams that are easy to understand and even easier to use. With its intuitive interface, you can visualize relationships between sets and identify common elements.
This flexible template helps users create two-circle or three-circle Venn diagrams to show intersecting elements and set differences.
Users can customize the diagram symbols and shaded regions, and set notations to suit their needs. Whether analyzing complex problems in computer science or exploring mathematical concepts, this template offers a visual way to understand set operations.
With features like Custom Statuses and Custom Fields, you can design informative diagrams with a minimal learning curve.

With ClickUp Whiteboards, you can create your canvas and use visual elements to collaborate with your team and brainstorm ideas in real time.
You can even create tasks on ClickUp directly from your Whiteboards, and link to relevant documents and media that add more context.
For example, product teams can set up one of these product comparison templates on a Whiteboard and use Veen diagrams to conduct a thorough competitive analysis with overlapping features and capabilities.

ClickUp’s Mind Maps lets you streamline complex ideas and workflows into intuitive flowcharts.
What makes ClickUp one of the best mind-mapping tools out there is the functionality it brings you beyond just creating visual workflows: you can hit the “re-layout” button to automatically re-align a messy flowchart. Plus, your mind map notes can also be converted into actionable tasks.
💡Pro Tip: Got a blank mind map canvas set up on ClickUp but don’t know where to begin? Explore these helpful mind map flowchart examples and find a great starting point!
To work with Venn diagrams effectively, you should be able to read and interpret Venn diagrams well. Here’s how you do it.
📮ClickUp Insight: When a goal falls short, only 34% of our survey respondents revise their strategy and 33% just give up. 🫢
But failure isn’t the end; it’s feedback.
You can easily unpack what went wrong with ClickUp Mind Maps and Whiteboards, explore new ideas, and chart a smarter course forward. Think of it as your built-in bounce-back plan.
💫 Real Results: ClickUp users say they can take on ~10% more work—because setting realistic goals means more wins and fewer meltdowns
Now we know how Venn diagrams work and how you can create them. But what real-world problems can these diagrams solve? A lot of them!
In computer science, they’re great for logical operations. In data analysis, they’re perfect for visualizing set operations. Businesses love them for spotting market overlaps. Similarly, professionals like environmental scientists regularly use Venn diagrams to analyze ecosystems and biodiversity.
Let’s go over a few more such use cases.
In social science and scientific research, Venn diagrams are useful for seeing the connections between different sample groups.
A three-circle diagram shows the overlap between the three survey groups and makes it easier to identify shared and unique responses.
For example, in a college student survey, a Venn diagram can show which students participate in sports, clubs, or volunteer work and where these groups overlap. This helps researchers identify shared interests and popular recreational programs.
If you thought you could not use Venn diagrams to make decisions in your everyday life, think again!
For example: Let’s say you’re deciding between three smartphones. Create a Venn diagram with three circles: one for each phone. In each circle, list the phone’s key features. Where the circles overlap, list shared features.
This visual comparison helps you see which phone best fits your needs based on factors like camera quality, battery life, and price. You’ll also be able to narrow down features that are non-negotiable for you, and you can then make your final selection on other factors like price or look-and-feel.
Also Read: Diagram Examples for Any Type of Project
Venn diagrams have long been a favorite way to visually compare two or more data sets and draw logical conclusions, whether you’re a data scientist, a student, or a social media marketer. And with ClickUp, creating and extracting value from Venn diagrams becomes so much more intuitive and easy (especially with templates)!
But, of course, Venn diagrams aren’t the only way you can visualize data on ClickUp. You can consider Venn diagram alternatives like Euler diagrams and scatter plot graphs to make better sense of complex data sets.
ClickUp is also one of the best flowchart tools and lets you turn even the messiest of workflows and fragmented ideas into coherent mind maps.
Have your data cleaned and ready? Get started with ClickUp today!

© 2026 ClickUp

There’s an easier way. Try a free AI Agent in ClickUp that actually does the work for you—set up in minutes, save hours every week.