Sorry, there were no results found for “”
Sorry, there were no results found for “”
Sorry, there were no results found for “”
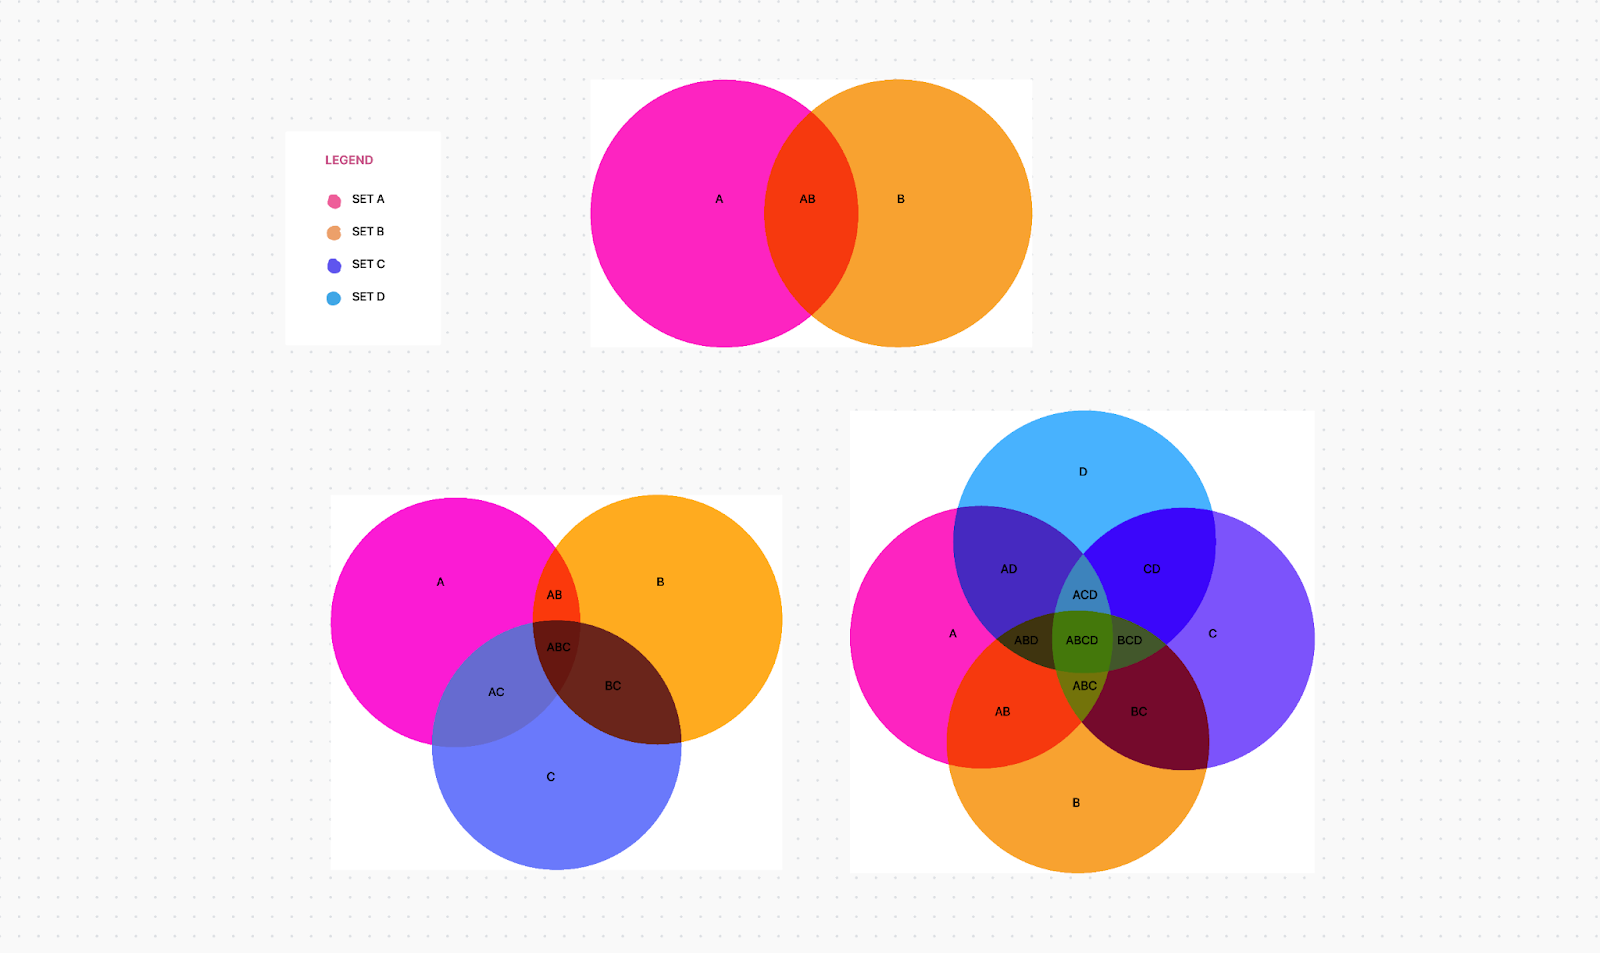
From classrooms to boardrooms, Venn diagrams have been helping people visualize and understand relationships between distinct data groups since the 1880s. Named after its creator, British mathematician John Venn, this type of diagram uses intersecting and non-intersecting shapes, typically circles, to show the logical links between various elements of data sets.
These diagrams set the stage for visual data comprehension. Each circle in a Venn diagram represents a separate set or category. The overlapping area shows what the two groups have in common, while the non-overlapping area reveals what sets them apart.
Venn diagrams possess a versatile quality and can be used in virtually any field where data comparison and interrelationships are needed—from sciences and humanities to business and daily decision-making.
In this article, we’ll explore five free Venn diagram templates that make creating these charts a breeze, saving you time and helping you present your data in a smooth and professional way.
A Venn diagram template is a pre-designed, often customizable layout that simplifies the process of creating a Venn diagram. It provides the basic framework, so you don’t have to draw the diagram from scratch or use additional diagramming software.
The template is more than a tool to draw a couple of circles or pinpoint shared traits between groups. It saves you time and effort as you handle complex data sets with multiple variables.
Venn diagram templates may support problem-solving at any difficulty level. Whether you’re navigating a simple two-set (circle) model or drawing elaborate charts involving three or more sets. They can assist with the following structures:
These complex types allow for more detailed and precise visual representation of data, making them adaptable to different fields, from statistics and economics to business and logic studies.
A good Venn diagram template is simple yet versatile and visually appealing. Here are the key features you should look for:
Whether you want to collaborate on a project with your team, create an engaging presentation, or test your students, we’ve rounded up five top-notch free Venn diagram templates that cater to different concepts. Each brings unique flair and functionality, so let’s get started!
The ClickUp Venn Diagram Template gives you the tools to present complex, disorganized information in an approachable manner. The Venn diagram maker helps you define what you want to visualize and facilitates efficient brainstorming.
The first thing to remember is that this is a highly scalable Whiteboard template, and ClickUp Whiteboards go beyond mere sketching. They provide a platform for real-time collaboration, allowing team members to capture ideas instantaneously without confusion or overlap, whether they’re collaborating remotely or in the same physical space.
You can assign tasks to your team members to gather data, compare all the elements, and visualize connections, all in one place. Create a ClickUp Doc to define the purpose of the Venn diagram and share it with your team.
Once you have your data, start by drawing circles that intersect in the middle. This basic structure represents the commonalities and differences between groups. It sets this template apart from similar visual tools like flowchart templates (that outline a process) or mind map templates (for creative brainstorming).
Label each circle with one of the data sets you’ve collected, and navigate to the Board view to map them out. By adjusting the size of the circles, ensure that the relative importance of the category they represent is instantly recognized.
Finally, switch to the Table view to add specific data points to your diagram. This mapping method might remind you of matrix templates or their more tabular cousin, database templates. However, the end result is different because there are no grids, rows, or columns. Place the data points within the circles to represent the individual elements of each set, and put shared points in the overlapping area.
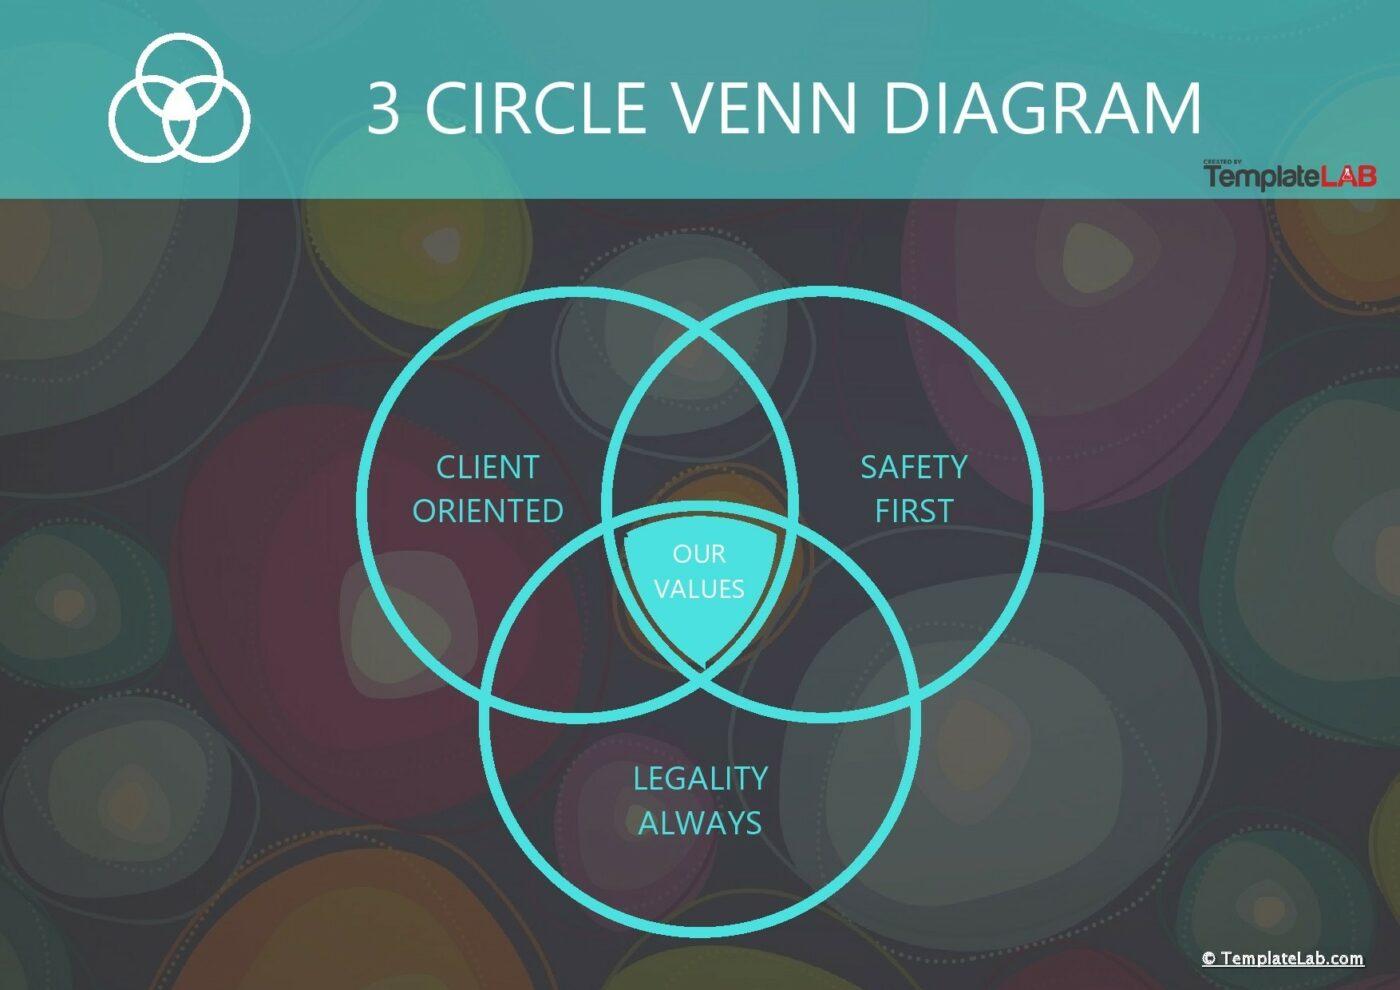
Microsoft Word 3 Circle Venn Diagram Template by TemplateLab might look busy at first, but don’t worry—it’s entirely customizable. Except for the number of circles, you get that from the name!
You’ll need to use this template with your Microsoft Word app because Word’s online version doesn’t support it yet. Since the template can’t be used online, you might have to resort to other collaborative tools to gather ideas or data from your team.
First things first, decide what three sets you want to compare in the diagram and identify what they have in common. Open the template in your Word app, and start filling in the text boxes in each circle and the overlapping area.
Keep in mind that this basic template lets you fill in only the space common to all three circles. So, if you want to present more complex findings involving two groups but exclude the third, you might want to look elsewhere.
Once you’ve entered your data and checked for mistakes, it’s time to have fun with customization. You can change everything except the basic shape. But be warned, messing with the text boxes too much might make the design look a bit shabby. If the original design isn’t quite your style, it’s best to keep the default outline but feel free to change the background and header to make it unique. ✨
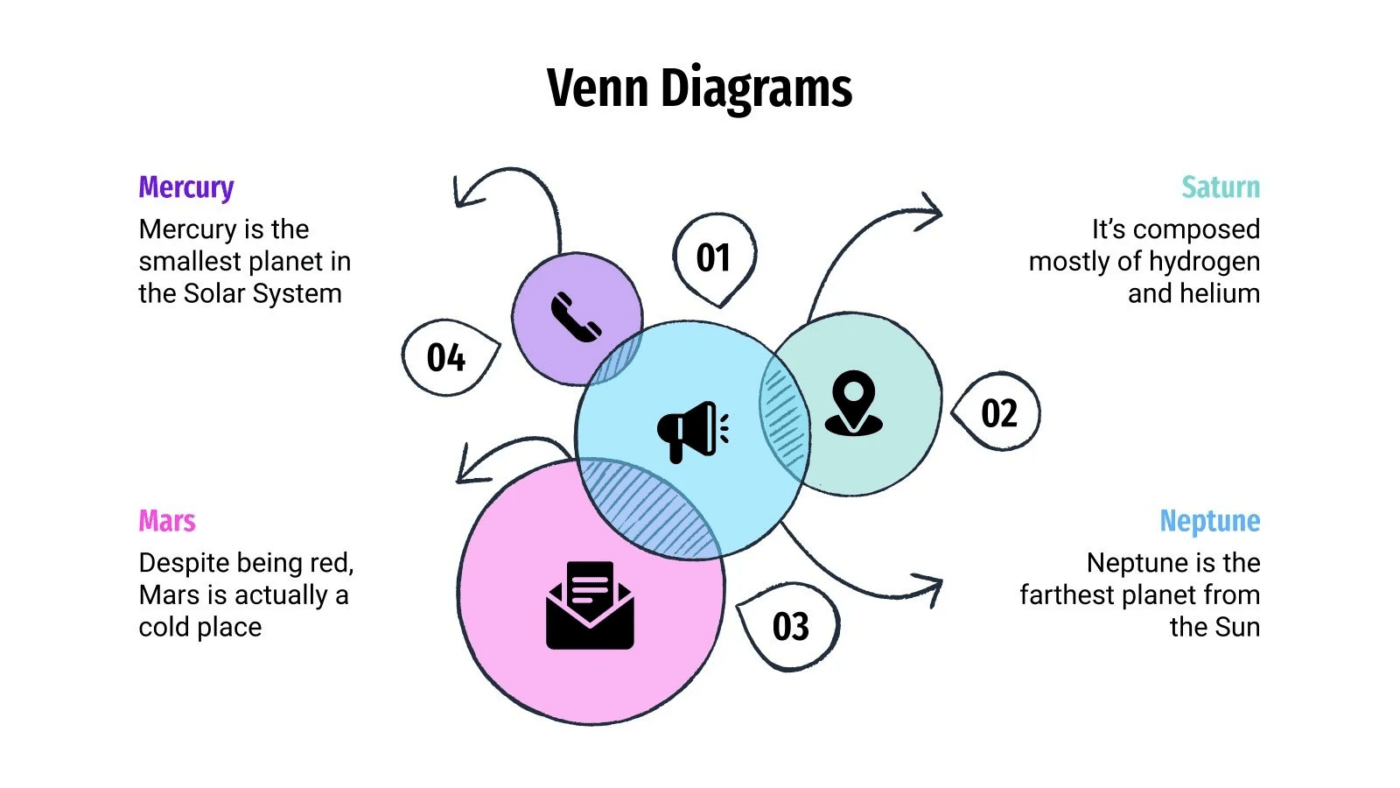
Google Slides Venn Diagram Template by Slidesgo offers a significant advantage over the previous contender. It can be used online in Google Workspace. Additionally, the Venn diagram consists of 29 editable slides, so you’re bound to find at least a few likable designs. However, some may be a bit complex to grasp at first glance, somewhat counteracting the purpose of using a Venn diagram for clear data visualization.
Customizing the presentation is generally a straightforward process. You’re offered a variety of options to make the design truly your own:
The presentation can be saved to your Google Drive, allowing customization and access whenever needed. Additionally, you can save PDF files for offline use.
While you can delete any slides you don’t need, free users must remember to keep the “credits” slide to correctly attribute the design.
📌Also Read: How to Create a Venn Diagram in Google Docs
📮ClickUp Insight: Our survey found that knowledge workers maintain an average of 6 daily connections at their workplace. This probably entails multiple pings back and forth across emails, chat, and project management tools. What if you could converge all these conversations in one place? With ClickUp, you can! It’s the everything app for work that combines projects, knowledge, and chat in one place—all powered by AI that helps you and your team work faster and smarter.
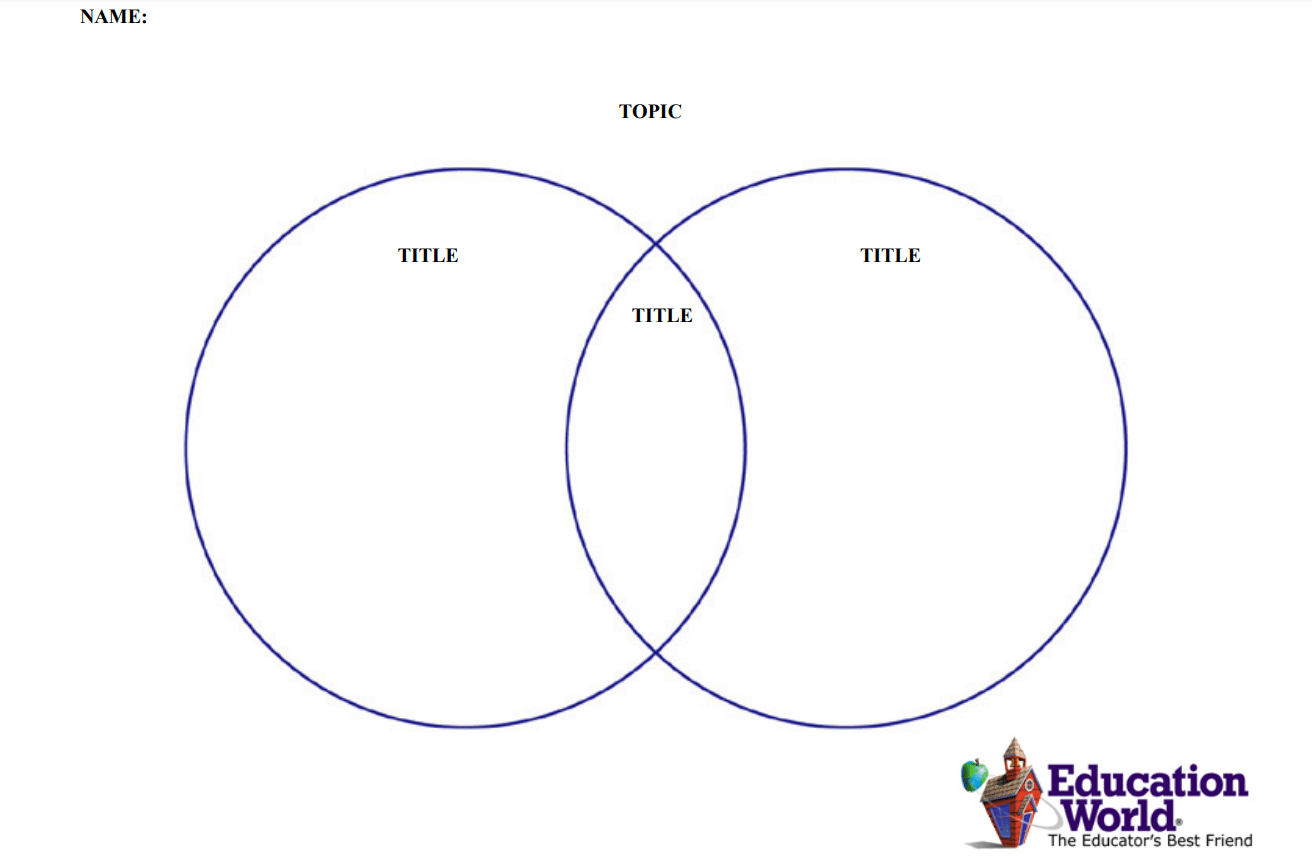
Education World is an award-winning online resource for educators, offering various content and tools to enhance teaching and learning experiences. Its Microsoft Word Two-Circle Venn Diagram Template is a basic framework teachers can use for tests.
It doesn’t allow any confusion about what’s what—it contains two circles, an overlapping area, and three textboxes to fill in with data points, making it perfect for students just discovering this concept.
The template can be edited in the Microsoft Word app but not in Word online. However, its design suggests it was never meant to be used online anyway. If you’re a teacher looking for an easy-to-print, simple Venn diagram template to distribute to your class, look no further.
While some customization is possible in the Word app, it’s best to keep it simple and only change the text as needed—most teachers find that the template in its original form is all they need.
PowerPoint Venn Diagram Template by SlideBazaar is fully customizable in the PowerPoint app and online. It comes in two sizes, 4×3 and 16×9, each with a light and dark mode.
The template features three differently colored circles, but you can tweak the format by deleting one or adding more circles to create a more complex Venn diagram. Want to spice things up? The shapes you add don’t have to be circles! Let your imagination unfold—you can experiment with stars, clouds, or even three-dimensional shapes like cubes or cylinders.
It’s easy to change the size of the shapes for a weighted Venn diagram. You can also rearrange their positioning so that some don’t overlap, which is ideal for representing exclusive sets.
The background is also customizable, allowing you to import custom images like a logo. You can customize all colors and fonts to reflect your brand as well.
Share your diagram through Microsoft SharePoint if you’ve uploaded the template to PowerPoint online. Alternatively, save it to your computer as a PPT, PTD, or JPEG file.
Whether you’re a professional aiming for efficiency, an educator engaging students, or an individual seeking a visually appealing way to present information, our selection of Venn diagram templates offers something for everyone. However, for those looking for an intuitive tool enhancing creativity and collaboration, ClickUp’s Venn Diagram Template emerges as a top-notch choice that beautifully balances functionality and flair.
ClickUp’s Whiteboard feature transcends traditional Venn diagramming, offering real-time collaboration capabilities, task assignment, customizable views, and seamless integration with other ClickUp tools.
Sign up for a free account in ClickUp and enjoy a collaborative and analytical approach to diagramming suitable for remote and in-person teamwork, revolutionizing how you work with data.

PMO Team
Max 9min read

Praburam Srinivasan
Max 16min read
Praburam Srinivasan
Max 21min read

© 2026 ClickUp