


Still downloading templates?
There’s an easier way. Try a free AI Agent in ClickUp that actually does the work for you—set up in minutes, save hours every week.
Sorry, there were no results found for “”
Sorry, there were no results found for “”
Sorry, there were no results found for “”

There’s 180 trillion zettabytes of raw data spread across databases, spreadsheets, and business tools.
Putting it in another perspective: It’s equivalent to streaming Spotify non-stop for 900 billion years. 🤯
It’s true that data holds a goldmine of information. But data without analysis is just numbers.
A question worth answering is: Can AI help with data analysis? Is it possible to make sense of this unstructured data without turning into a data scientist or building BI infrastructure?
Ahead, we show you how to use Claude for data analysis.
In day-to-day work, data analysis boils down to transforming raw data into clear, actionable insights that drive business decisions.
You dig through the business data to uncover hidden patterns, trends, opportunities, and signs of trouble that could cost your business monetarily and competitively. Understanding what the data means and reasoning through it helps you make evidence-backed business decisions.
Here are a few instances of how different business departments use Claude AI for data analysis in everyday work:
| Department | How Claude Supports Day-to-Day Data Analysis |
| Product management | Synthesizes user feedback and experiment results, compares cohorts, and helps explain product trends and trade-offs |
| Marketing | Identifies patterns across campaign reports, compares time periods, and turns performance data into clear narratives |
| Operations | Analyzes before-and-after changes, surfaces inefficiencies, and helps reason through cost and process optimizations |
| Sales | Summarizes CRM notes, compares deal cohorts, and explains conversion differences across segments |
| Customer support | Groups similar tickets, highlights recurring issues, and surfaces sentiment trends at scale |
| Finance | Compares forecasts and scenarios, stress-tests assumptions, and explains budget or cost variance |
| Programming assistance | Analyzes logs, error patterns, and release changes to help identify root causes and recurring failures |
| Strategy | Synthesizes cross-functional inputs and helps reason through risks, opportunities, and strategic choices |
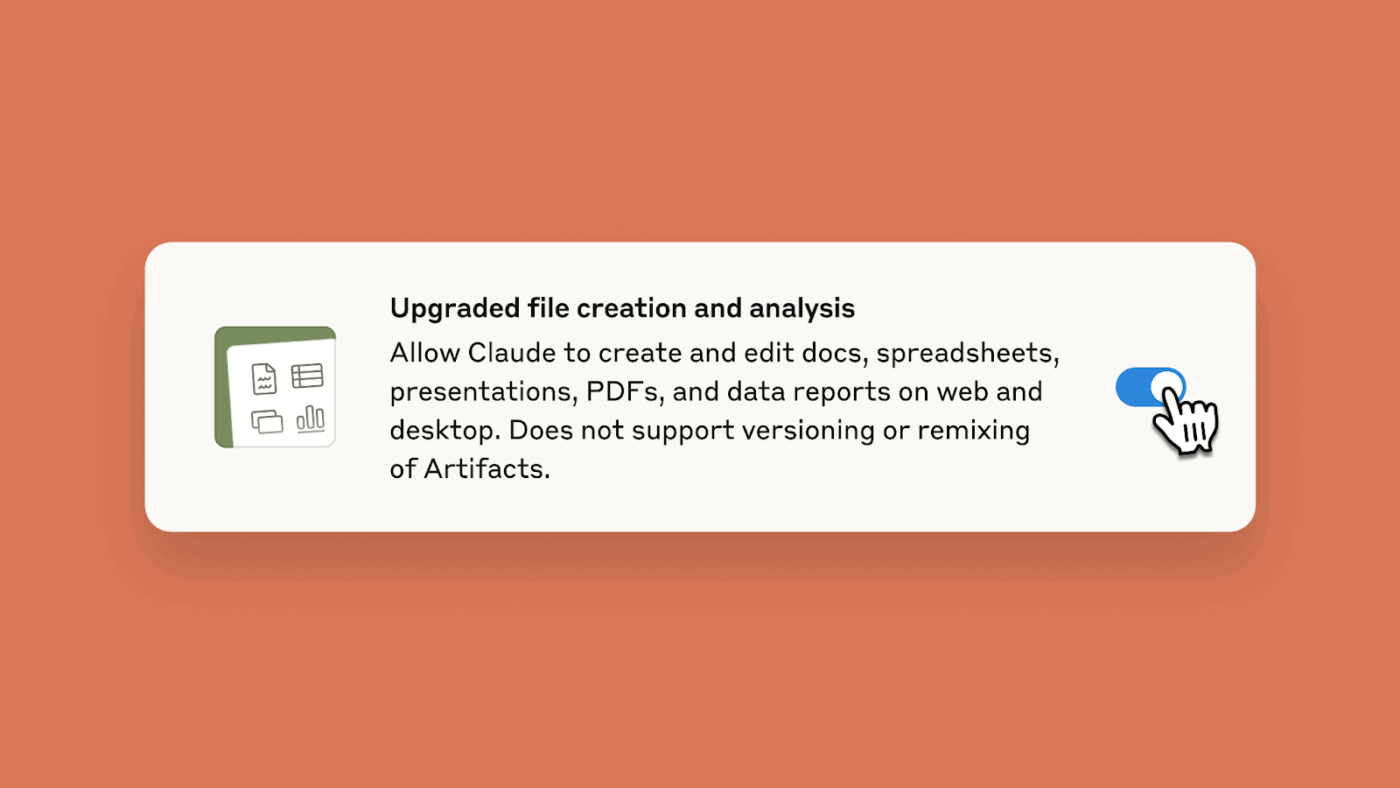
Claude can create and edit Excel spreadsheets, documents, PowerPoint slide decks, and PDFs right inside Claude.ai and the desktop app.
All you need to do is upload relevant data and describe what you need. And voila, you get ready-to-use files.
📌 Let’s put this in perspective with some examples:
Claude’s ability to explain insights in plain language makes it accessible to everyone, even those with no technical background or coding experience.
Here’s how Claude supports your data analysis process:
Data analysis rarely looks like a single, neat spreadsheet column. It looks like:
Claude, as your reasoning partner, helps you make sense of these fragmented conversations. Below, we show you the types of data analysis where Claude excels:👇
Claude can dig through messy, lengthy qualitative data to identify nuances and organize it into structured formats (tables, CSV files, spreadsheets, etc.).
📌 Example: Your product team exports 800 open-ended survey responses and support tickets after a feature launch. The feedback is inconsistent, emotional, and repetitive.
Some users report confusion with the setup. Others mention too many steps to get started. There are many more edge cases in paragraphs.
Claude helps with qualitative data analysis.
It can cluster similar themes, surface recurring language, and organize the feedback into a structured table. Everything is neatly organized into categories (onboarding friction, missing guidance, and unexpected behavior).
You get a clear picture of what users are struggling with and which issues occur most often—without losing the nuance of how customers describe their experience.
🧠 Fun Fact: Claude AI is named after Claude Shannon, the mathematician and engineer known as the father of information theory.
His work laid the foundation for how information is measured, transmitted, and preserved—fitting for an AI designed to reason across large volumes of context. Claude was first released in March 2023.
📚 Read More: Data Collection Methods for Business Insights
For initial data dives, you don’t have a thorough investigative direction. In such cases, use Claude to explore different angles. There’s no need to write queries for each exploration path. Claude can analyze data structure, identify missing values, and suggest cleaning steps just by processing your CSV file.
📌 Example: You want to figure out why conversions on your website are dropping. After uploading your CSV file, Claude can run a health check on it and surface reasons/patterns behind dropping conversions, e.g., mobile bounce rates are doubling while desktop bounce rates remain flat.
This is a rough lead. Based on this, you can iterate further:
In simpler terms, use this iterative process to build and test assumptions in real time.
👀 Did You Know? According to McKinsey’s research, 82% of information skills—like data analysis and research—face moderate to high automation exposure by 2030.
Claude handles multiple datasets simultaneously, giving you side-by-side comparisons without any complex formulas.
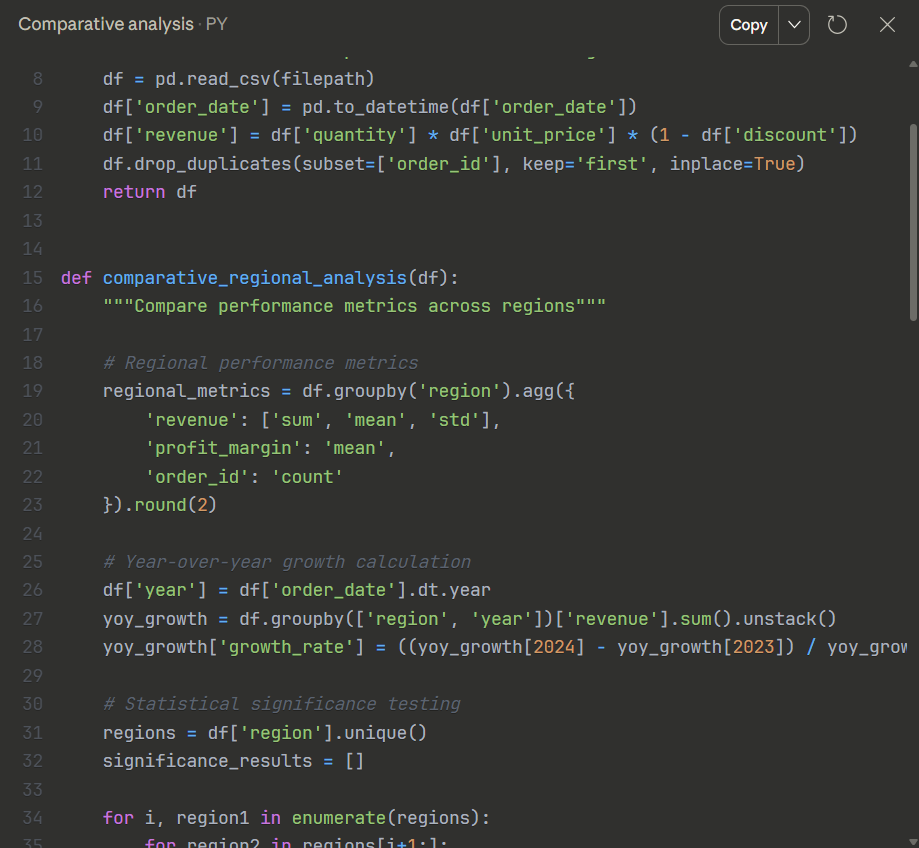
When you upload files and ask comparative questions, Claude activates its analysis mode—writing and running JavaScript code in real time. You’ll see the data processing, and often a “View analysis” button appears, letting you inspect the exact code it used to arrive at its conclusion.
You can use Claude to find answers to your different comparison questions. Some examples include 👇
| Comparison type | What you can do | Example |
| Time period | Compare metrics across weeks, months, quarters, or years | Analyze Q4 2024 vs Q4 2023 to see if holiday sales grew or if traffic sources shifted |
| Customer segments | Break down performance by customer type, size, or any other metric | Compare enterprise vs SMB churn rates to identify which segment needs retention focus |
| Before/ After | Measure the impact of changes like feature launches, pricing updates, or process shifts | Upload data from before and after a pricing change to see if conversions dropped in specific tiers |
| Scenario modeling | Test different assumptions or budget allocations side-by-side | Model revenue impact if you cut marketing spend by 15% vs 30% to find the breaking point |
👀 Did You Know? Spotify processes over 1 trillion events daily through its AI-driven recommendation engine. Using collaborative filtering, natural language processing, and raw audio analysis, it dissects listening habits, scans music blogs, and analyzes audio files to suggest tracks you’ve never heard—making discovery feel eerily personal.
Claude helps you articulate assumptions, explore alternative outcomes, and reason through second-order effects.
📌 Example: Your growth team is debating whether to reduce paid acquisition spend after noticing flattening ROI.
They outline competing hypotheses: conversions might be plateauing due to creative fatigue, rising CPCs, or slower downstream activation.
They ask Claude to model different scenarios:
The output is not a single right answer. But it makes the trade-offs explicit, showing which assumptions matter most and where risk concentrates.
💡 Pro Tip: Ask Claude to state its assumptions explicitly before reasoning forward, then rerun the same scenario with one assumption changed at a time. You will get the variables that drive the outcome and which ones are just noise, making your decision far more robust.
Synthesis is where analysis turns into understanding. Claude helps you connect dots across inputs, timeframes, and perspectives—so insights don’t stay trapped inside documents.
📌 Example: An operations lead is preparing for a quarterly review. Insights are scattered across weekly reports, meeting notes, support escalations, and experiment summaries. Each document makes sense on its own, but together they’re noisy and hard to reason about.
Claude helps synthesize these inputs into a single, coherent view. You can see:
Equipped with this data, you can see the patterns, contradictions, and decision-relevant takeaways.
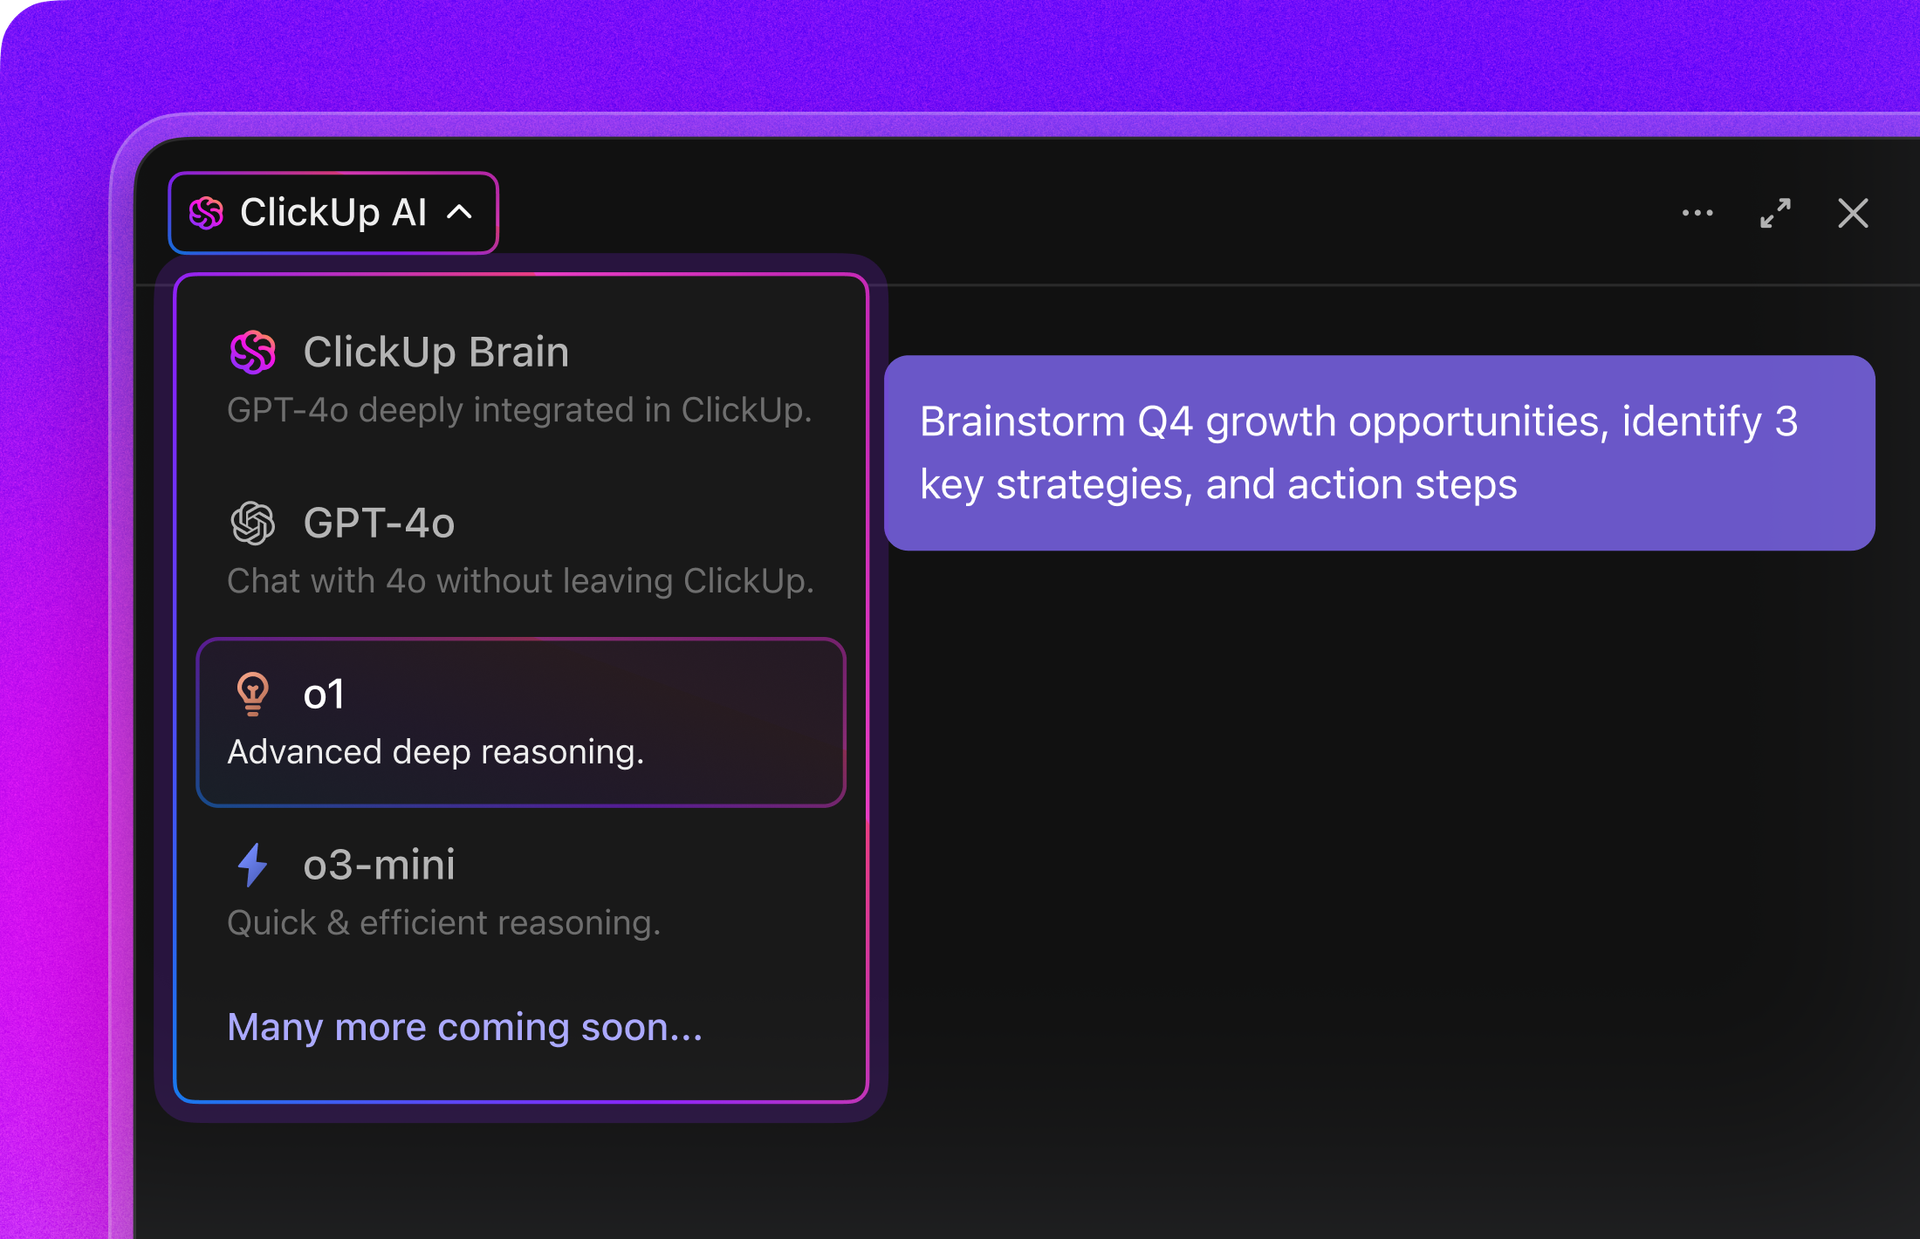
📮 ClickUp Insight: 62% of our respondents rely on conversational AI tools like ChatGPT and Claude. Their familiar chatbot interface and versatile abilities—to generate content, analyze data, and more—could be why they’re so popular across diverse roles and industries.
However, if a user has to switch to another tab to ask the AI a question every time, the associated toggle tax and context-switching costs add up over time.
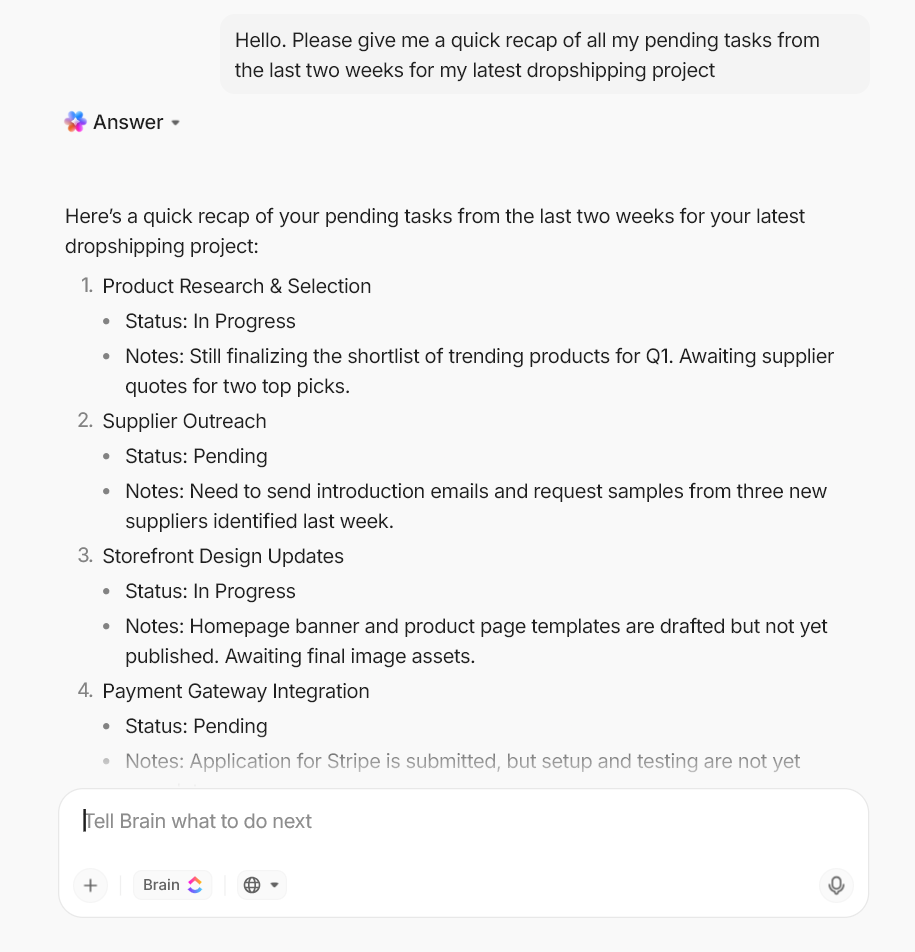
Not with ClickUp Brain, though. It lives right in your Workspace, knows what you’re working on, can understand plain text prompts, and gives you answers that are highly relevant to your tasks! Experience 2x improvement in productivity with ClickUp!
You don’t need a technical setup or integrations to analyze data with Claude.
Begin by giving Claude your data or context. Then refine your prompts as your understanding improves.
Remember that it’s a conversation, not a one-shot query.
Claude can analyze unstructured data, but it works significantly better with structured datasets. So before uploading CSV files, take some time to clean and organize your data. It will help you get precise and reliable responses.
| Aspect | Guidelines |
| File format | Use CSV or Excel (.xlsx) for numeric data and structured tables Plain text (.txt) or Word documents (.docx) for text-heavy qualitative data JSON for nested or hierarchical data structures like API responses or configuration files |
| File size | Claude can analyze up to 30 MB of data or 20 files at once, but keep your dataset within 10 MB or 50,000 rows for detailed, accurate analysis |
| Clear field names | Use descriptive column headers like “Customer_ID,” “Purchase_Date,” “Revenue,” instead of vague labels like “X,” “Col1,” or “Field A” |
| Consistent date formats | Standardize dates to one format (YYYY-MM-DD or MM/DD/YYYY) across the entire dataset to avoid parsing errors |
| Single dataset per sheet | Keep one clean dataset per worksheet rather than mixing multiple tables or summary sections |
If your data is riddled with duplicates and missing values, use Claude to clean and prepare your data.
But before that, understand the underlying structure of your dataset, i.e., what each column represents and how different fields relate to each other. Here’s how Claude acts as a data extraction tool:
Prompt: Inspect this dataset for outliers and data quality issues
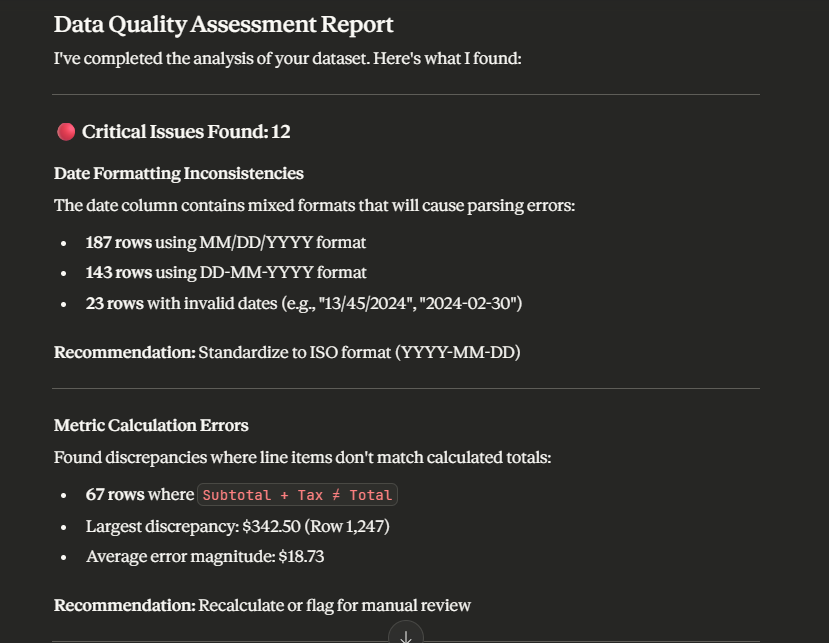
Here, Claude loads the CSV into its Claude Analysis tool, runs JavaScript code to scan the data, and generates a report based on what it finds.
If Claude’s assessment seems accurate, ask it to “Clean this data and provide a statistical summary of the cleaning operations performed.” You’ll get back a cleaned file ready for analysis, along with a breakdown of what changed.
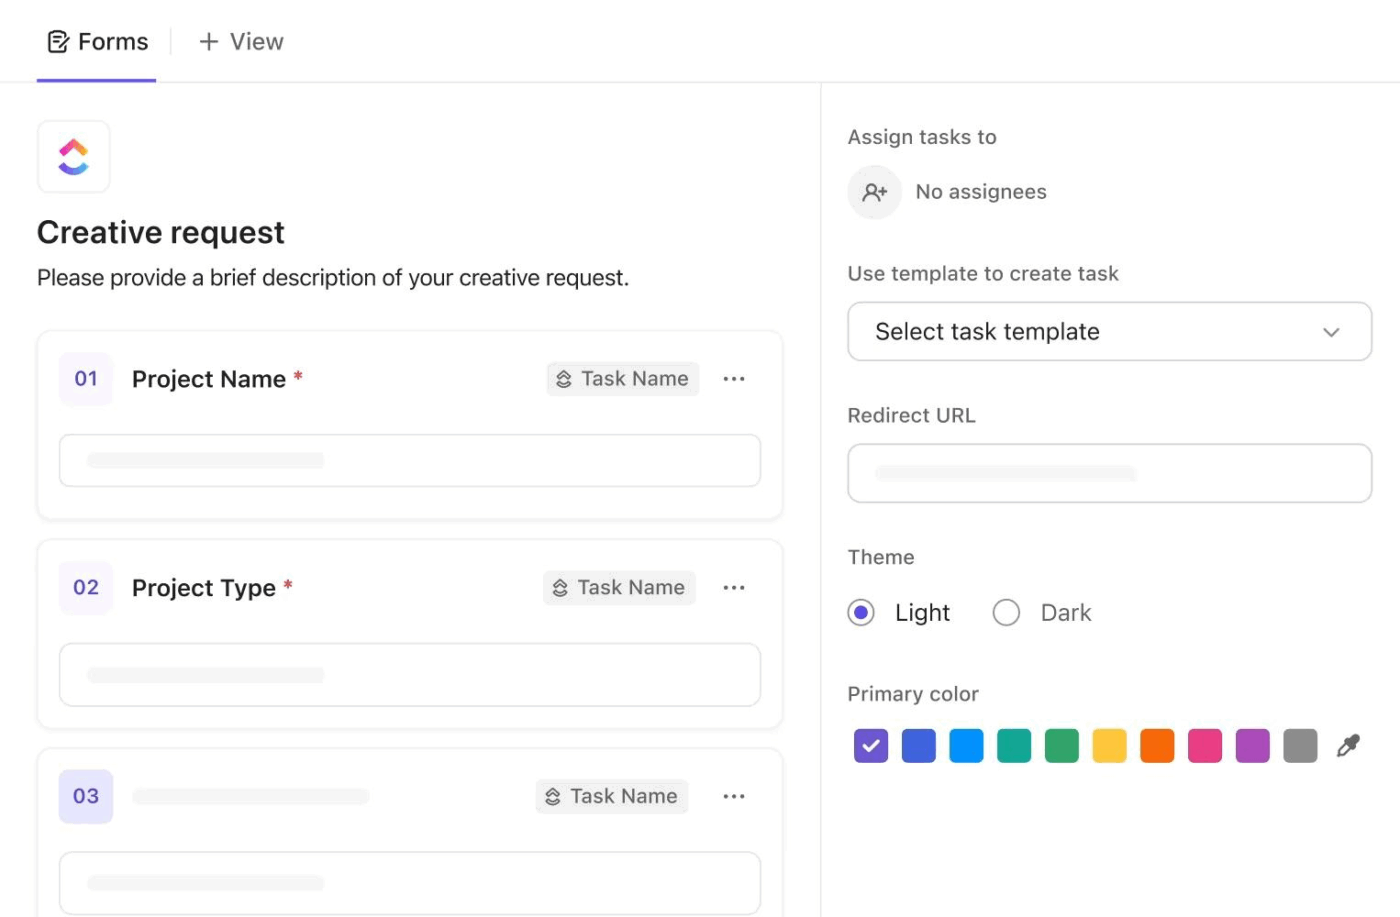
💡 Pro Tip: Use ClickUp Forms to capture structured data from the start—predefined fields and validation rules ensure clean datasets. You can also automate forms with AI to extract information from emails, documents, or messages and populate form fields automatically.
You can start asking questions as soon as you upload the file. Use simple conversational language to gain broad overviews or drill down to capture micro-level insights.
Claude handles a variety of question types well:
The idea is not to overload the Claude with multiple complex requests in a single go. Build on each question and identify patterns and relationships through conversation and exploration.
For instance:
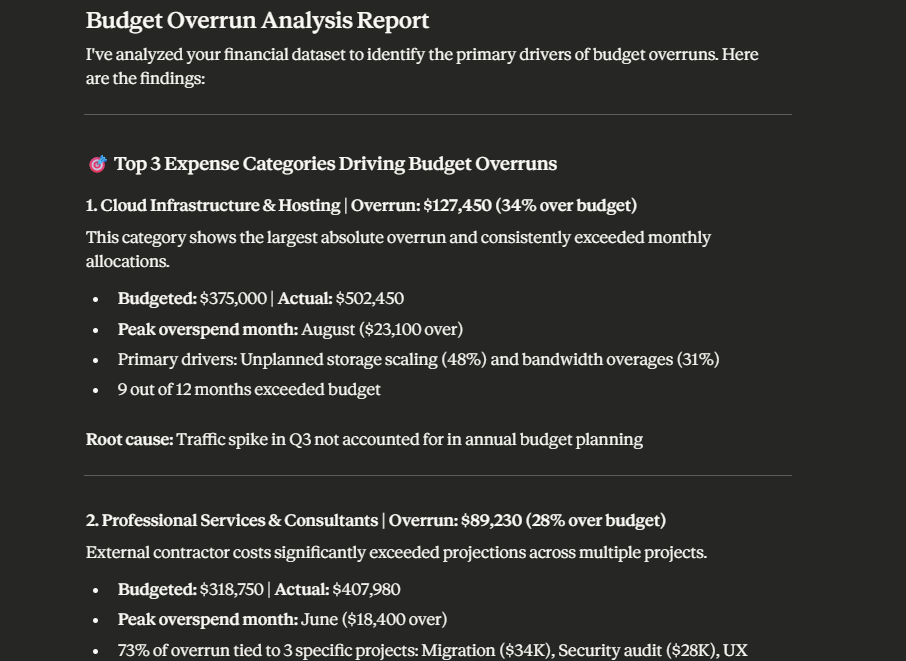
Analyze this financial dataset and identify the top three expense categories driving budget overruns.
Now, break down those expense categories by department and flag which teams are furthest over budget.
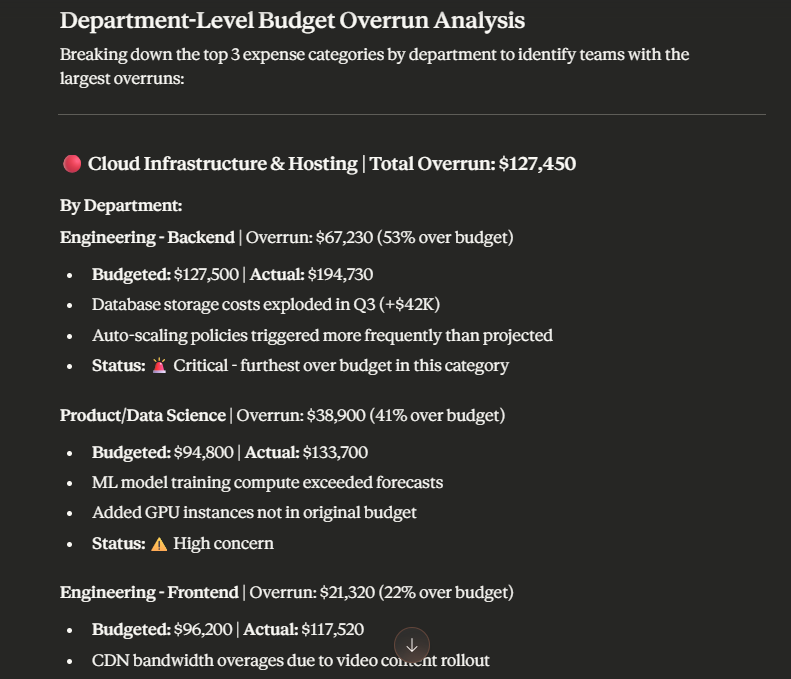
When done with this step-by-step iteration, Claude’s analysis can be read and used as if it were the report of a human data analyst. You can walk through its thought process and the data that it factored into its decision.
📌 Analysis workflow example in action:
Upload customer feedback from multiple channels → ask Claude to categorize by theme and sentiment → export a summary table showing which issues appear most frequently across support tickets, reviews, and survey responses
💡 Pro Tip: Build a shared prompt library for common analysis tasks in ClickUp Docs, so your team doesn’t start from scratch every time. You can include prompts for cleaning sales data, categorizing feedback, identifying churn patterns, and more. This way, you can standardize workflows and eliminate the guesswork for repetitive analysis tasks.
After analyzing your data, Claude can visualize it directly in the chat using Claude and React JS artifacts. It can generate charts, data dashboards, 3D simulations, and technical diagrams from your data files.
Supported chart types include bar, line, scatter, pie, TreeMap, and funnel charts.
To guide the visualization process, be specific about what you want to see:
Again, here you would keep iterating to refine the focus, chart type, rendering style, labels, and data ranges of the visualized output. Claude adjusts based on your feedback without having to start from scratch every time.
Your Claude analysis needs a place to live beyond the chat. Somewhere, your team members can easily access it, review the findings, and convert those insights into strategies and trackable tasks.
Claude lets you export analysis outputs in formats that fit into your existing workflow:
⚡ Template Archive: Free Target Audience Templates to Define and Refine Your Ideal Customer
🎥 If you’re looking to use AI to save time and ship products faster, we’ve created this video for you.
Structuring your prompts with clear parameters helps Claude deliver precise and accurate analysis that aligns with your objectives.
Here are prompting patterns you can follow for different use cases:
When you want Claude to draw summaries from unstructured and messy datasets—or even large, clean ones—don’t just ask it to offer top insights from the file.
Here’s the prompting pattern to follow:
🤖 Example prompt: This CSV contains 8,000 customer support tickets from Q4. Summarize the top five complaint categories by frequency and flag any issues that spiked suddenly.
Strong comparative prompts clarify the goal of comparison and the dimensions that are being compared. This is important when you don’t want Claude to simply list down the differences but dig deeper into what’s driving those changes.
Here’s the prompting pattern to follow:
🤖 Example prompt: Compare customer retention rates between users who onboarded in Q1 versus Q2. Focus on 90-day retention and highlight any behavioral differences in product usage during their first month.
When you need Claude to flag data points that don’t fit the pattern, here’s the prompting pattern to follow:
This interactive approach helps you understand the reason behind the outlier and how it impacts your projections or operations.
🤖 Example prompt: Analyze this sales dataset and flag any months where revenue dropped more than 15% below the quarterly average. For each outlier, identify which product lines were affected and whether it coincides with any operational changes.
When you need Claude to explain an analysis to a specific audience, it’s important to specify who the explanation is for and what they need to know. When you’re running short on time and need executive summaries, it works best.
Here’s the prompting pattern to follow:
🤖 Example prompt: Take this churn analysis and explain the findings to our marketing team while focusing on what’s driving customer churn and practical measures we can take to improve retention.
When you want Claude to challenge your analysis or identify what’s missing, explicitly ask it to question your conclusions and flag areas where data might be incomplete.
Here’s the prompting pattern to follow:
🤖 Example prompt: Review this revenue forecast and identify any assumptions I’m making that could be wrong. Flag any data gaps that might affect accuracy and suggest what additional information would strengthen this analysis.
Below are some beginner-friendly best practices you must be aware of:
👀 Did You Know? Danone uses AI to forecast raw material costs across 500+ commodity models. By continuously iterating models based on commodity movements, the company generates cost-of-goods-sold forecasts fast enough to keep business planning agile and responsive to market shifts.
Here are a few mistakes to avoid when using Claude for data analysis and what to do instead:
| ❌ Mistake | ✅ What to do instead? |
| Asking too broad and vague questions | Build specificity into your prompts by defining scope and desired output Instead of “Summarize this sales data,” ask questions with specificity, i.e., identify which product categories saw the biggest revenue drop in Q3 |
| Not offering context | Always provide a brief explanation clarifying what the dataset represents, what each field means, what data types to expect, and how fields relate to each other |
| Accepting the first answer as it is | Treat Claude’s initial response as a starting point and iterate with follow-up questions to refine findings and test assumptions |
| Feeding extremely large datasets | Preprocess data and condense it into manageable chunks—summarize by time period, filter to relevant segments, or aggregate before uploading to avoid parsing errors |
| Sharing datasets with personally identifiable information | Edit the dataset before uploading—remove or anonymize names, email addresses, phone numbers, social security numbers, and any other sensitive personal data |
| Results that overlook assumptions and biases | Prompt Claude to “List all potential biases in the dataset and any data gaps that could affect conclusions“—to surface correlation-causation errors, sampling bias, or overlooked subgroups in its data |
Claude works fine for data analysis. But once projects move from planning to action, you’ll start to notice these limitations 👇
Claude can help you analyze datasets and draw patterns that aren’t immediately visible. But once you have those insights, what next?
You still need a separate system to execute on those insights. Enter: ClickUp.
This Converged AI Workspace offers a single platform where projects, documents, conversations, and AI intelligence work together. Its context-aware AI knows and understands your work. You spend less time copy-pasting data and more time moving work forward.
Below are the key features of ClickUp that make it the best Claude alternative:
ClickUp Brain works as a contextual AI layer inside your workspace, with awareness of how your work is actually structured. Instead of reasoning in isolation, it can reference:
Because Brain operates within ClickUp’s permission model, it only surfaces information you’re allowed to see.
Most importantly, insights don’t stay trapped in documents. Brain reasons over live workspace data and returns answers grounded in the current execution state. As a result, analysis connects directly to decisions, follow-ups, and outcomes.
When your information is fragmented across projects, teams, and tools, searching for data and relevant answers becomes a struggle.
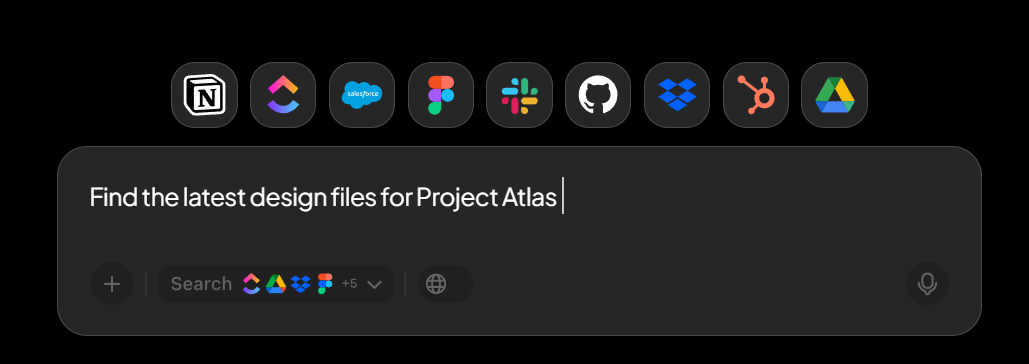
ClickUp’s Enterprise Search makes it easier to search across your workspace and connected systems in natural language.
See how you can search across files, tasks, conversations, and dashboards without digging through folders or switching between tools. The AI-powered returns answers and related files from across your workspace and integrated third-party apps.
With ClickUp, you can build a structured database directly into your workflows. ClickUp Custom Fields lets you add highly customizable, user-defined data fields to your workspace locations (spaces, folders, lists) and tasks in over 20 different formats.
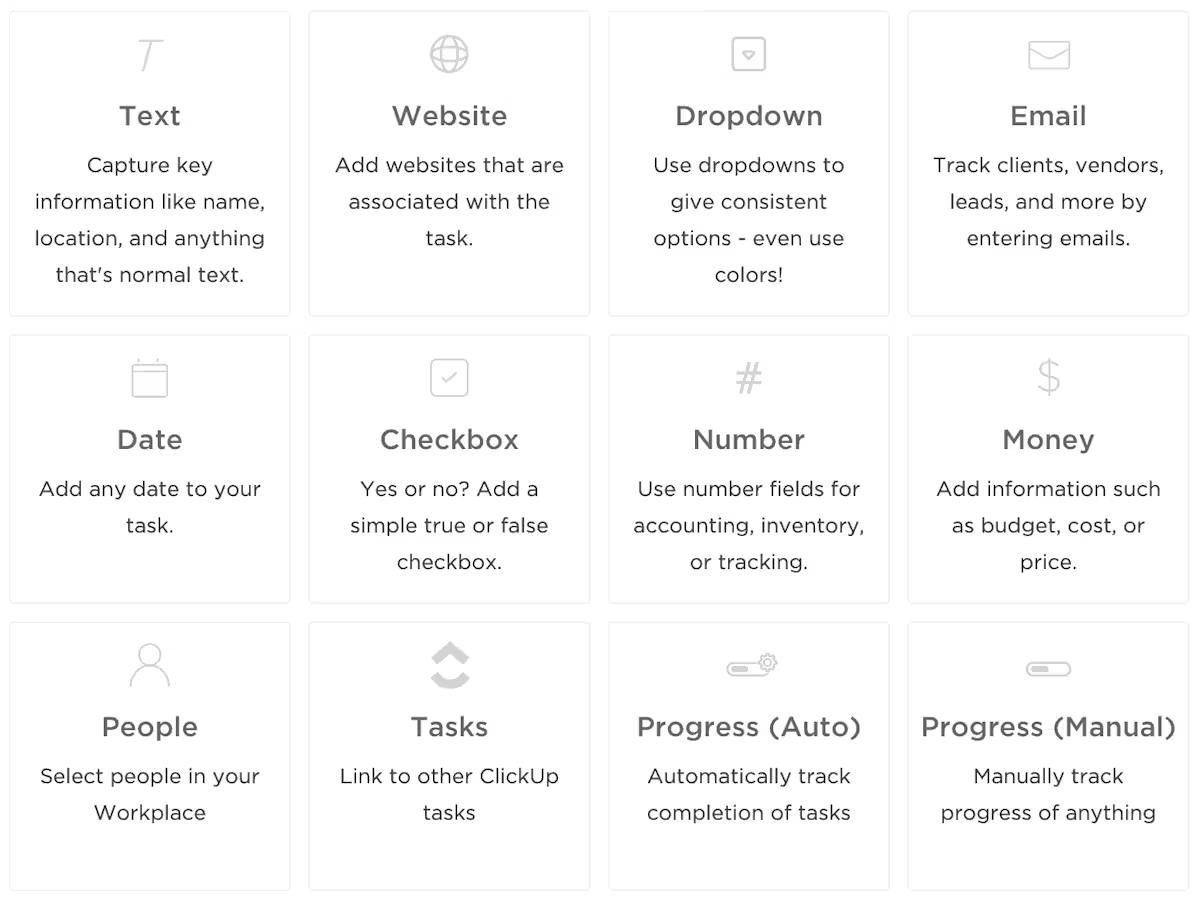
Here’s what makes it powerful for data management:
ClickUp Brain and ClickUp BrainGPT give you access to multiple AI models, including Claude Sonnet 4, directly inside your workspace. You don’t need separate subscriptions or logins to experiment with different models for analytical tasks.
You can run your analysis where your work already lives.
No more analyzing a dataset in Claude, then manually transferring insights back into your project management tool to create tasks. Your team can collaborate on findings in real time and turn insights into action without context switching.
💡 Pro Tip: Different AI models have different analytical strengths. Here’s when to use which:
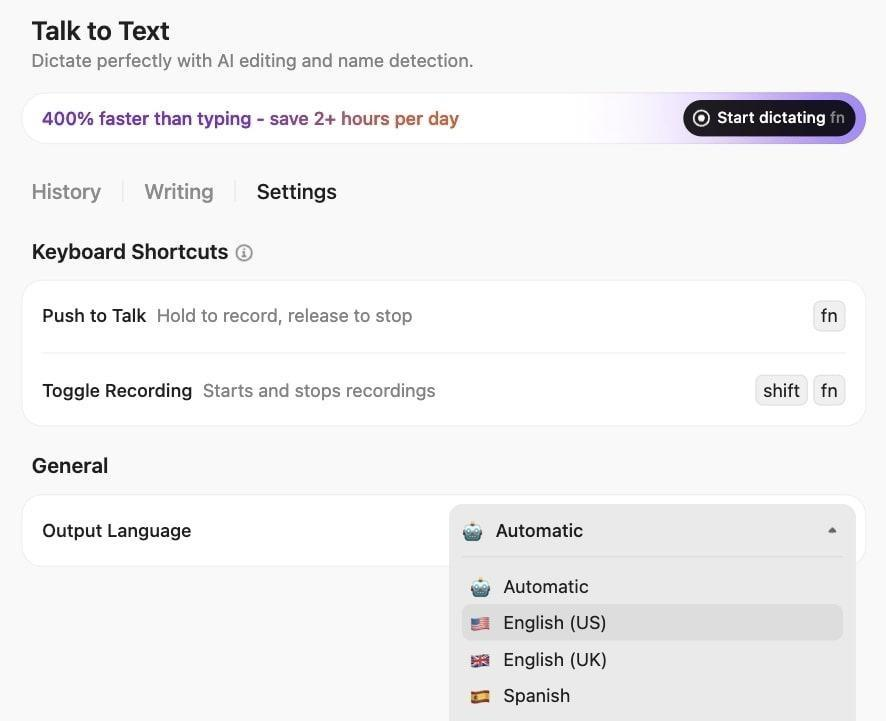
Use ClickUp Talk to Text to dictate your analysis guidelines without losing the train of thought.
Speak naturally, clarifying what the dataset means, explaining the correlation between different variables, and specifying what you expect the AI model to analyze.
Also, define how to structure the output, all with its hands-free approach.
Talk to Text further streamlines your analysis workflow by:
Once you’ve analyzed your data and identified patterns, you need a place to monitor how those insights translate into real business outcomes. Static reports lose relevance the moment conditions change.
You need post-campaign visibility into whether the trends you identified are holding, improving, or deteriorating.
ClickUp Dashboards give you that real-time view. They pull data directly from your workspace—tasks, Custom Fields, project timelines, team activity—and display it in charts, graphs, and widgets that automatically update as work progresses.
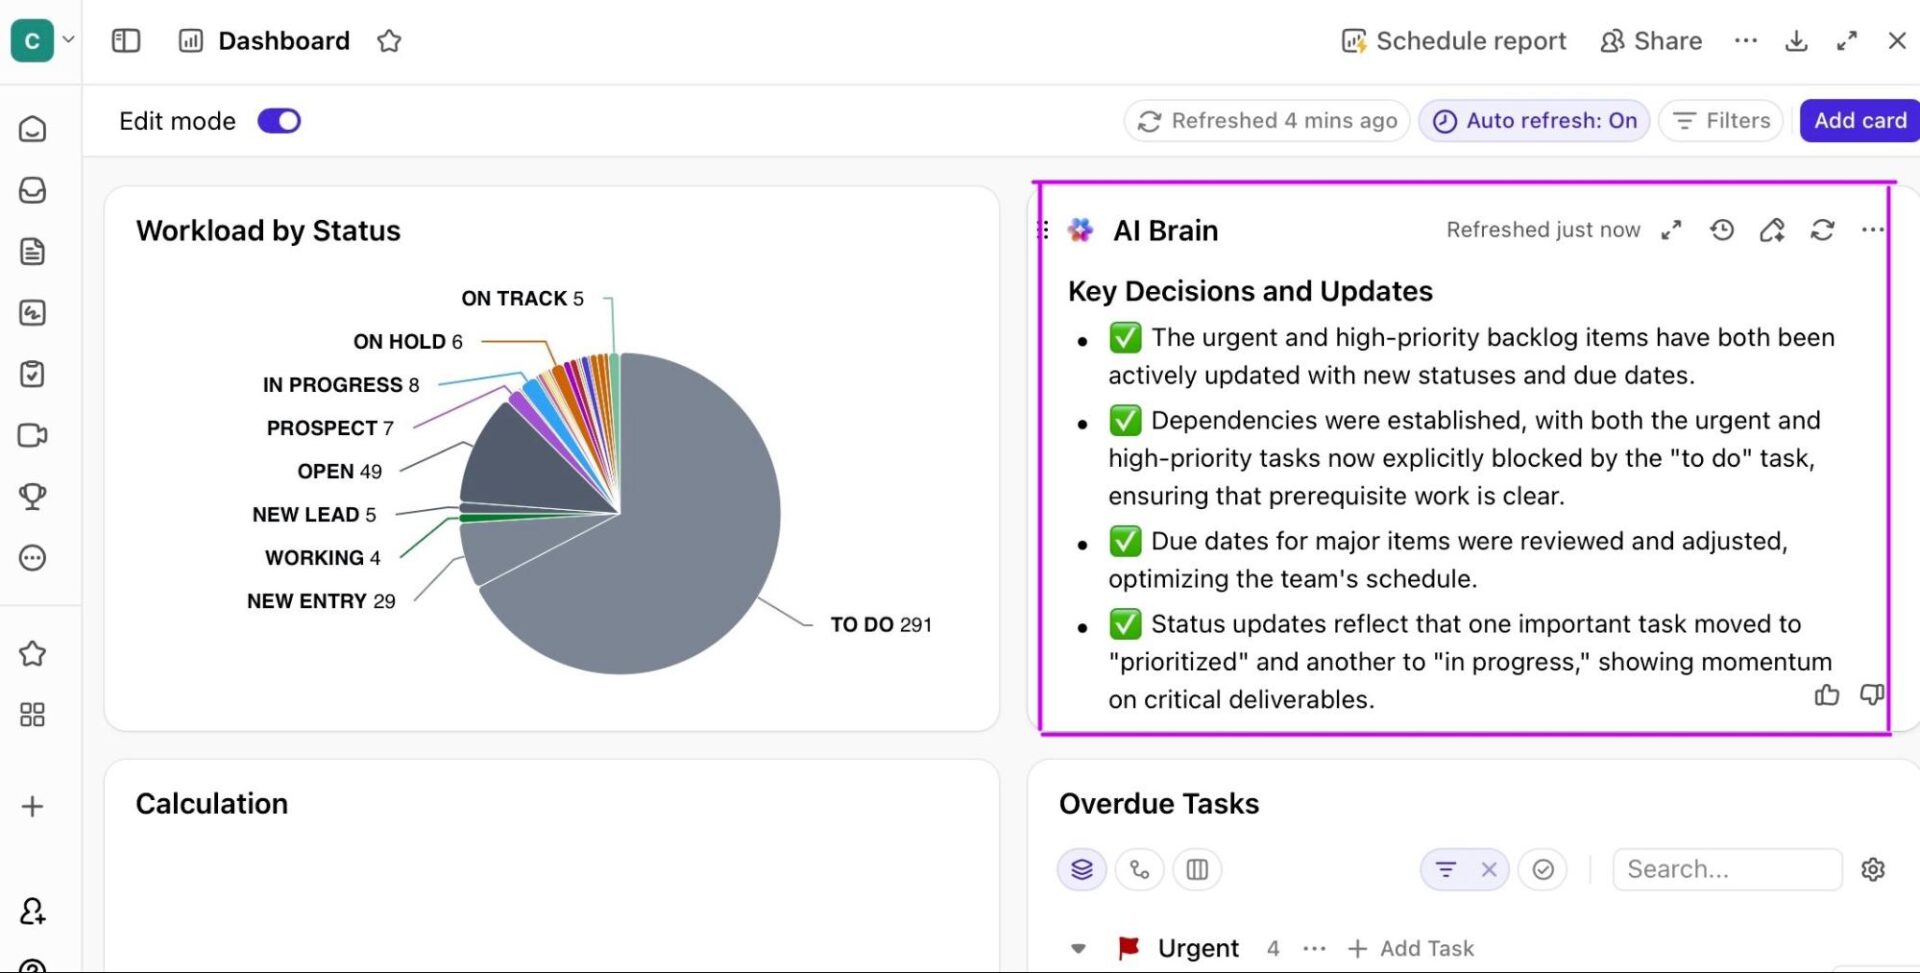
Here’s how Dashboards support your data analysis workflow:
⭐ Bonus: Pair Dashboards with AI Cards to summarize the data intelligently. Here’s how to use this combo 👇
Super Agents are AI assistants that operationalize your analytical insights. They run in the background, catching issues and executing workflows while you focus on strategic decisions.
These AI agents for data analysis are your ambient monitors, tracking changes in tasks, timelines, dependencies, and data patterns without waiting for you to prompt them.
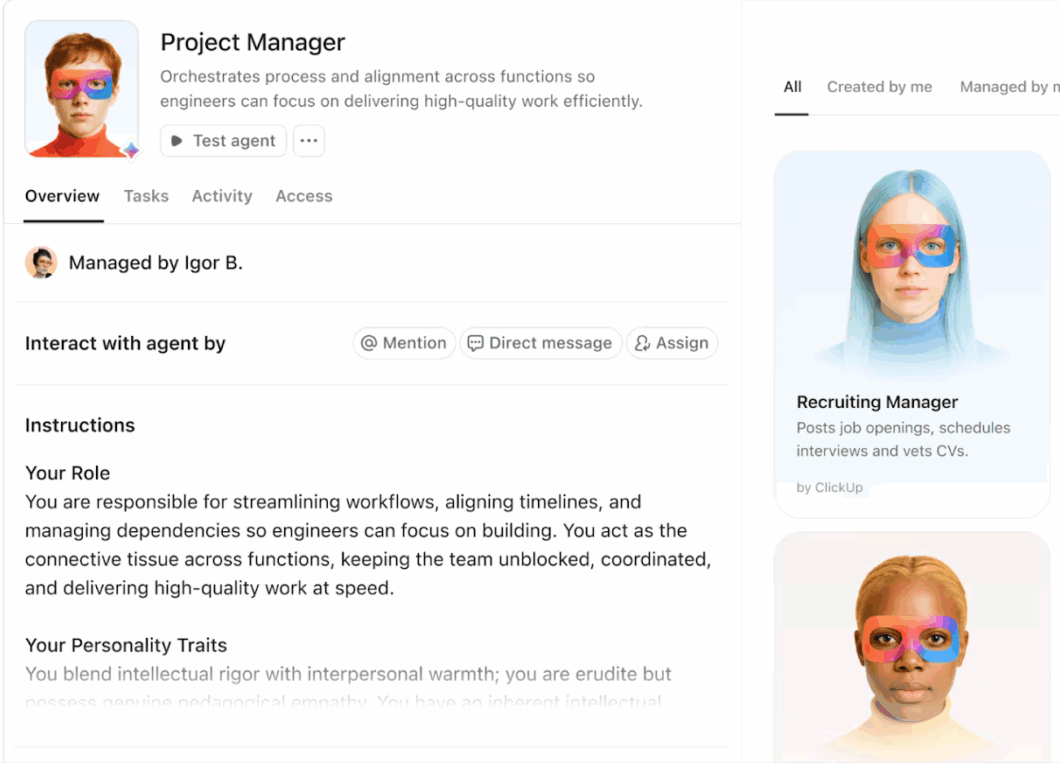
Here’s what Super Agents can do with your data:
Most tools for data analysis sit next to your work. ClickUp’s converged AI sits inside it.
ClickUp combines AI with your projects, tasks, documents, and conversations. The AI understands what you’re asking as well as what’s happening, what’s blocked, and what needs to move next.
The edge comes from convergence:
Ready to explore the power of a converged AI workspace? Sign up on ClickUp for free.
Claude handles both structured data (CSV, Excel, JSON) and unstructured text (customer feedback, survey responses, interview transcripts).
Claude delivers high accuracy for descriptive stats, pattern recognition, exploratory analysis, and qualitative insights. It’s considered to be equivalent to a junior data analyst. However, its precision dips on noisy/ large unstructured files and edge cases—requiring human verification.
No. Claude excels at one-off analysis and reasoning through messy datasets, but it lacks the automated dashboards, scheduled reporting, and data pipeline integrations that BI tools provide. It’s suitable for exploration, not production analysis.
Ask Claude to show its work and review the actual code it ran. Check sample sizes, verify calculations against a subset of data you understand, and test conclusions against your operational knowledge of the business.
Claude shines during initial exploration and while translating complex findings into plain language for stakeholders. It’s best for making sense of your messy dataset quickly without replacing your analytics infrastructure.

© 2026 ClickUp

There’s an easier way. Try a free AI Agent in ClickUp that actually does the work for you—set up in minutes, save hours every week.