


Still downloading templates?
There’s an easier way. Try a free AI Agent in ClickUp that actually does the work for you—set up in minutes, save hours every week.
Sorry, there were no results found for “”
Sorry, there were no results found for “”
Sorry, there were no results found for “”
In business, the experience you deliver is often larger than the product or service itself, and can influence client relationships.
Clients remember how you communicate, how quickly you act, and whether you provide context that makes their decisions easier. According to many studies and reports, companies that focus on customer service experience a 3.5x increase in revenue. That is how much it matters.
But good service is not a grand gesture. It is the small, steady habits. For agencies, standardizing client reporting is one of those small habits that changes everything.
In this guide, we will walk you through a simple process for effective client reporting that you can repeat across multiple client accounts.
The Client Success Template by ClickUp gives you a ready-to-use folder with the core pieces you need to run each account in one place. You get all the features you need to standardize follow-ups, spot risks early, and share simple, client-friendly updates.
Clients don’t just want numbers. They want context. A good report highlights KPIs, explains why trends happened, and gives next steps.
This comment from Reddit stuck out. It’s true: Numbers are not a story without context. This is why standardization of marketing data matters.
Standardizing client reporting also saves everyone time. Instead of rebuilding files and stitching figures, account managers can manage data with care.
Most of all, a steady format builds trust. Here are a couple of key reasons why standardized client reporting helps:
More than half of customers will switch after just one poor experience. That’s a sharp reminder that trust is fragile and clarity matters.
Standardized client reporting strengthens trust.
When clients receive reports in the same format, frequency, and structure every time, they know what to expect. This predictability signals that your team is organized, professional, and dependable, which reinforces confidence over time.
Also, well-structured reports signal that you value the client’s time and have a clear process in place. That professionalism goes a long way in building long-term relationships.
Here are a few simple touches that deepen trust and transparency:
📮 ClickUp Insight: 24% of workers say repetitive tasks prevent them from doing more meaningful work, and another 24% feel their skills are underutilized. That’s nearly half the workforce feeling creatively blocked and undervalued. 💔
ClickUp helps shift the focus back to high-impact work with easy-to-set-up AI agents, automating recurring tasks based on triggers. For example, when a task is marked as complete, ClickUp’s AI Agent can automatically assign the next step, send reminders, or update project statuses, freeing you from manual follow-ups.
💫 Real Results: STANLEY Security reduced time spent building reports by 50% or more with ClickUp’s customizable reporting tools—freeing their teams to focus less on formatting and more on forecasting.”
Microsoft’s Work Trend Index shows people lose time hunting for information, which makes routine reporting even harder. Standardizing reports reduces that drag by cutting the copy-paste work that invites mistakes.
Just connect your marketing tools (like Google Ads or Facebook) once and schedule automatic pulls of your data. It handles all the annoying bits for you—like sorting out different currencies, lining up dates, and matching tracking codes (UTMs).
Automation also adds quiet guardrails. Simple validations catch missing tags, odd spikes, and empty campaigns before a client sees them.
This year’s privacy news significantly altered the landscape of campaign reporting. Google stepped back from fully deprecating third-party cookies in Chrome and doubled down on Privacy Sandbox, while Consent Mode v2 became the rule for ad measurement in Europe.
If your setup is not aligned, cross-channel results will not line up either.
Standardized client reporting gives you one view across marketing channels through data aggregation. A light data warehouse or hub, plus steady data mapping, lets you track a visitor from first click to revenue and compare creatives across platforms without apples-to-oranges errors.
Pair website traffic and engagement metrics with downstream conversion paths, and you get relevant data that tells a clear story, not a collage of charts.
It also solves small, costly problems agencies see all the time. A platform changes default attribution, a promo code fires twice, or a paid channel reports conversions a different way after a setting tweak. A consistent template and a tiny change log make those shifts visible.
Think Ocean’s Eleven. The plan works because everyone knows their role, the timing, and the handoffs. Standardized client reporting does the same for agency teams.
When every account follows the same outline, collaboration feels lighter. When every report follows a consistent format for goals, KPIs, and results, it becomes easier to track commitments and follow through.
The executive summary shows the goal, key metrics, and business outcomes. Owners and dates sit under each recommendation.
Notes on data sources and reporting cadence live in the same spot every week. Creative, media, and analytics can comment in context, agree on the next test, and move on.
Disconnected tools create more noise than clarity. That is work sprawl, and it strips away the context you need to explain what changed and why.
The fix is to keep objectives, metrics, notes, and updates inside one converged workspace so the report writes itself.
With ClickUp, you can standardize client reporting without extra lift and keep everyone on the same page. Let’s build it together, step by step.
Start by agreeing on the client’s business objectives in plain words. Choose the few key metrics that prove progress and avoid a long list that blurs the story, such as qualified leads, demo requests, or cost per opportunity.
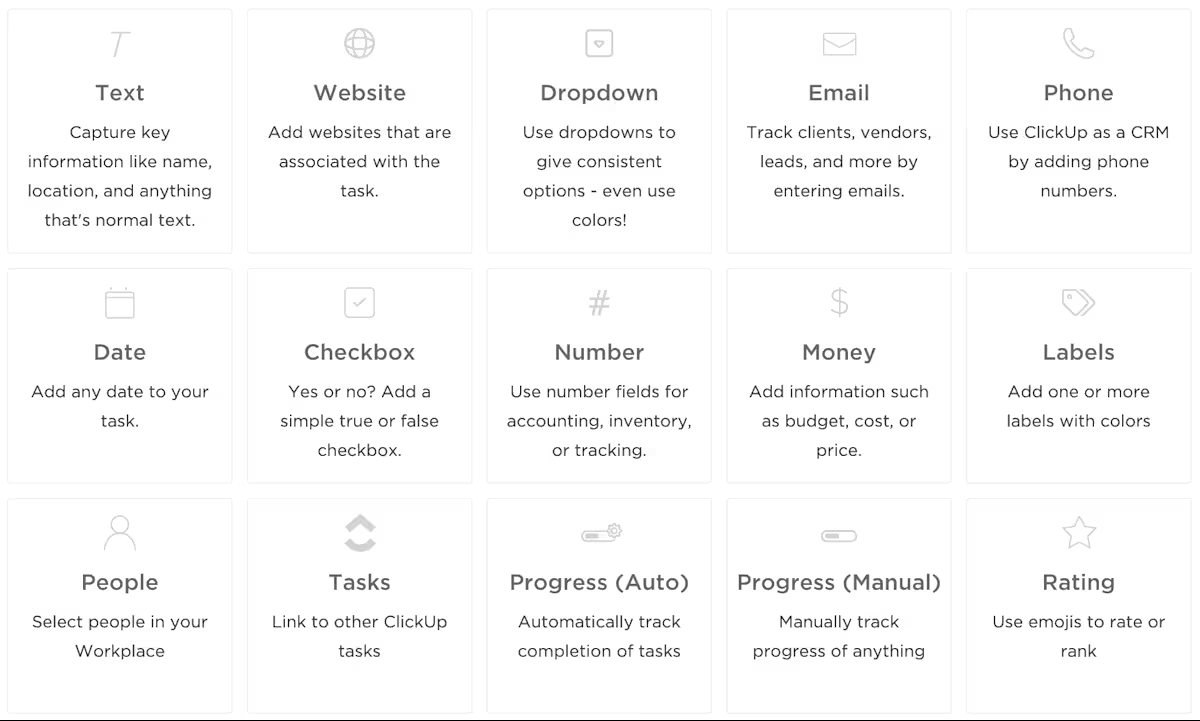
Create Custom Fields in your tasks inside ClickUp Tasks to add the level of detail you need—budget, daily spend, target audience, and so on. With Formula Fields, you can add calculations to further enrich your reports.
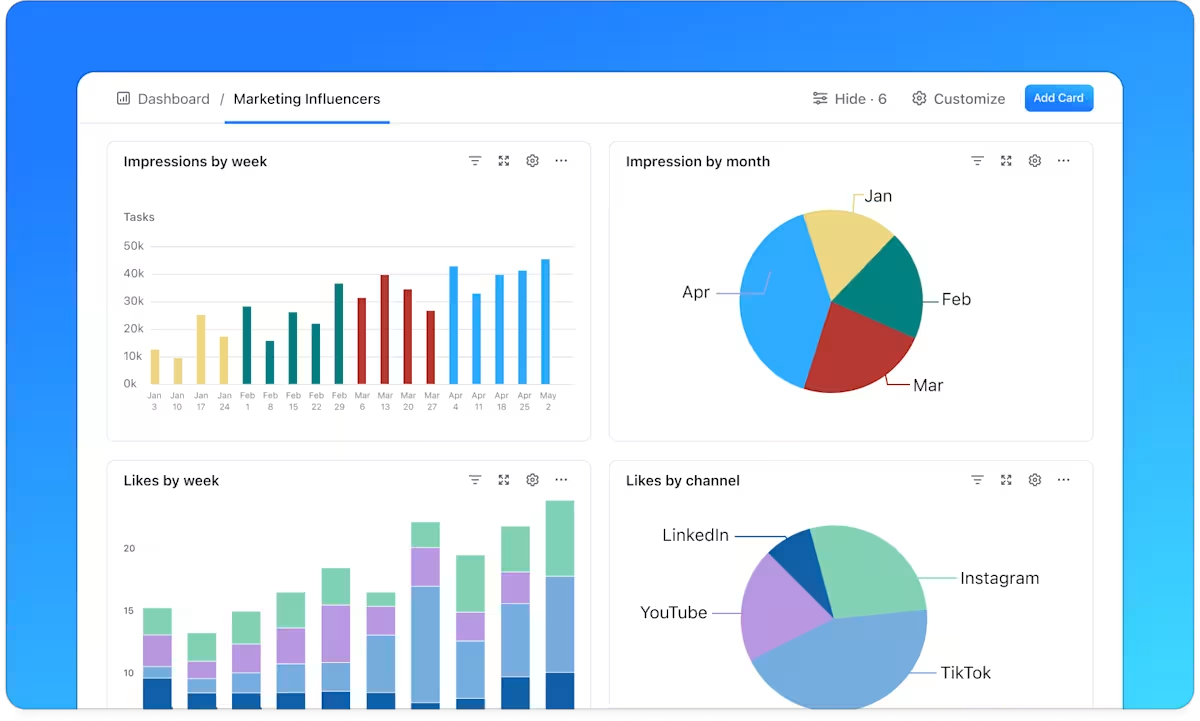
Link tasks and lists so progress rolls up automatically and lines up with your reporting cadence. Build a dashboard with a progress widget via ClickUp Dashboards beside a simple number card, so the executive summary almost writes itself.
Ensure accuracy by creating a shared glossary. Use ClickUp Docs to create a Data Mapping document with sections for sources, UTM parameters, conversions, and attribution windows, ensuring that you use client-specific language and provide concrete examples.
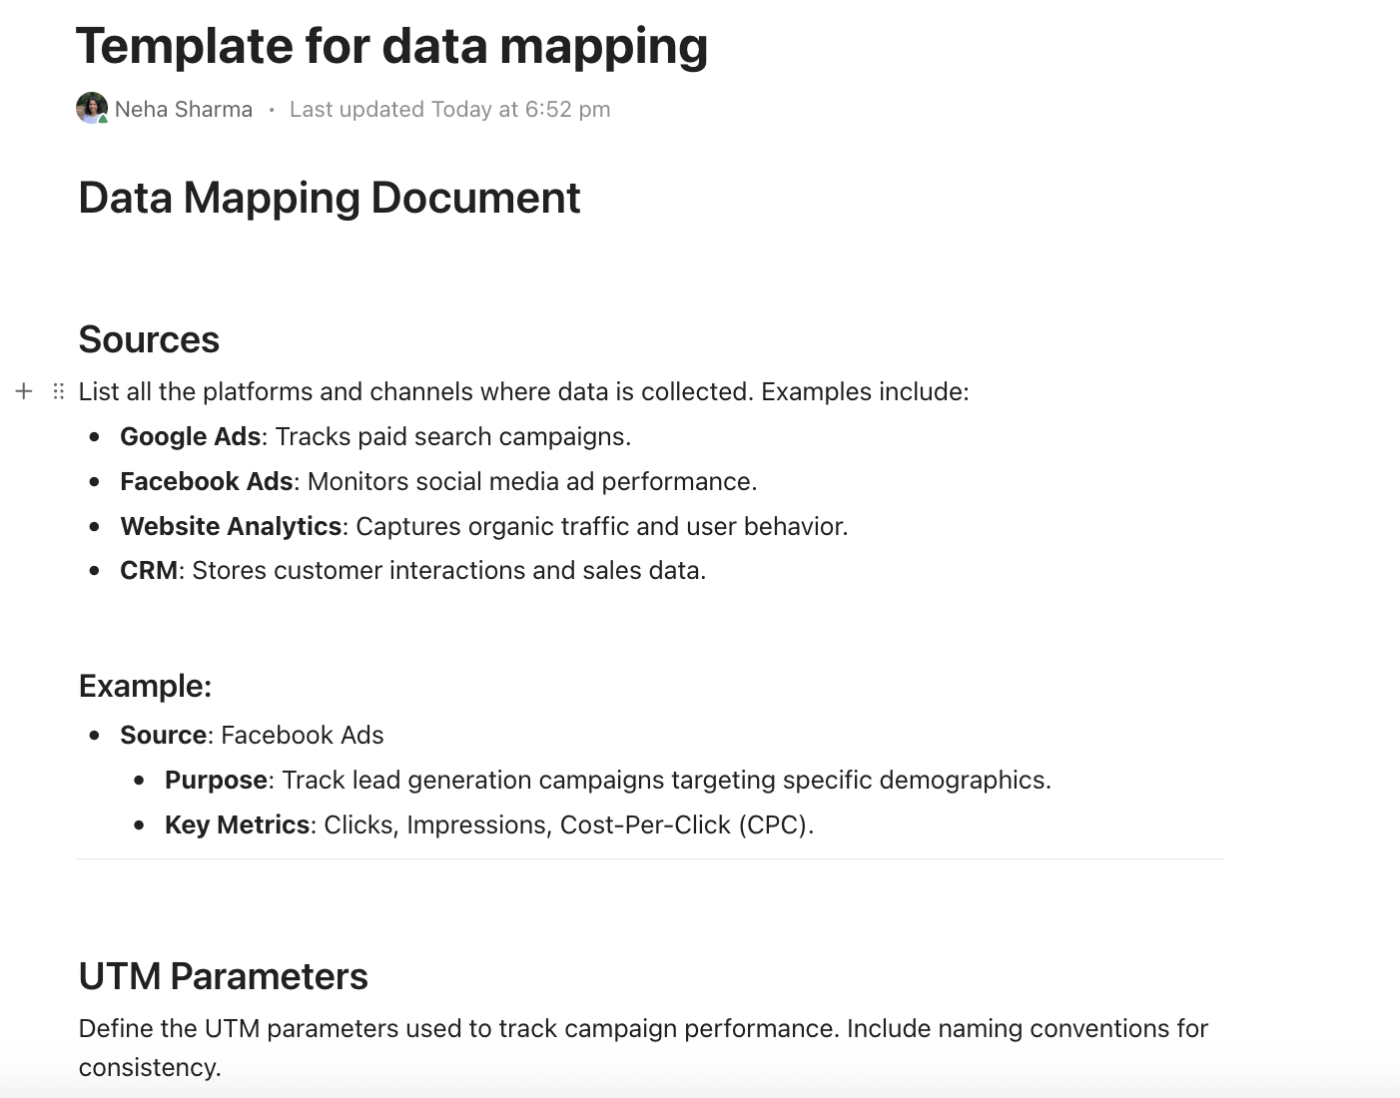
Inside that doc, link to the exact platform views and add a small table for tracking currency and date ranges—areas where numbers often drift.
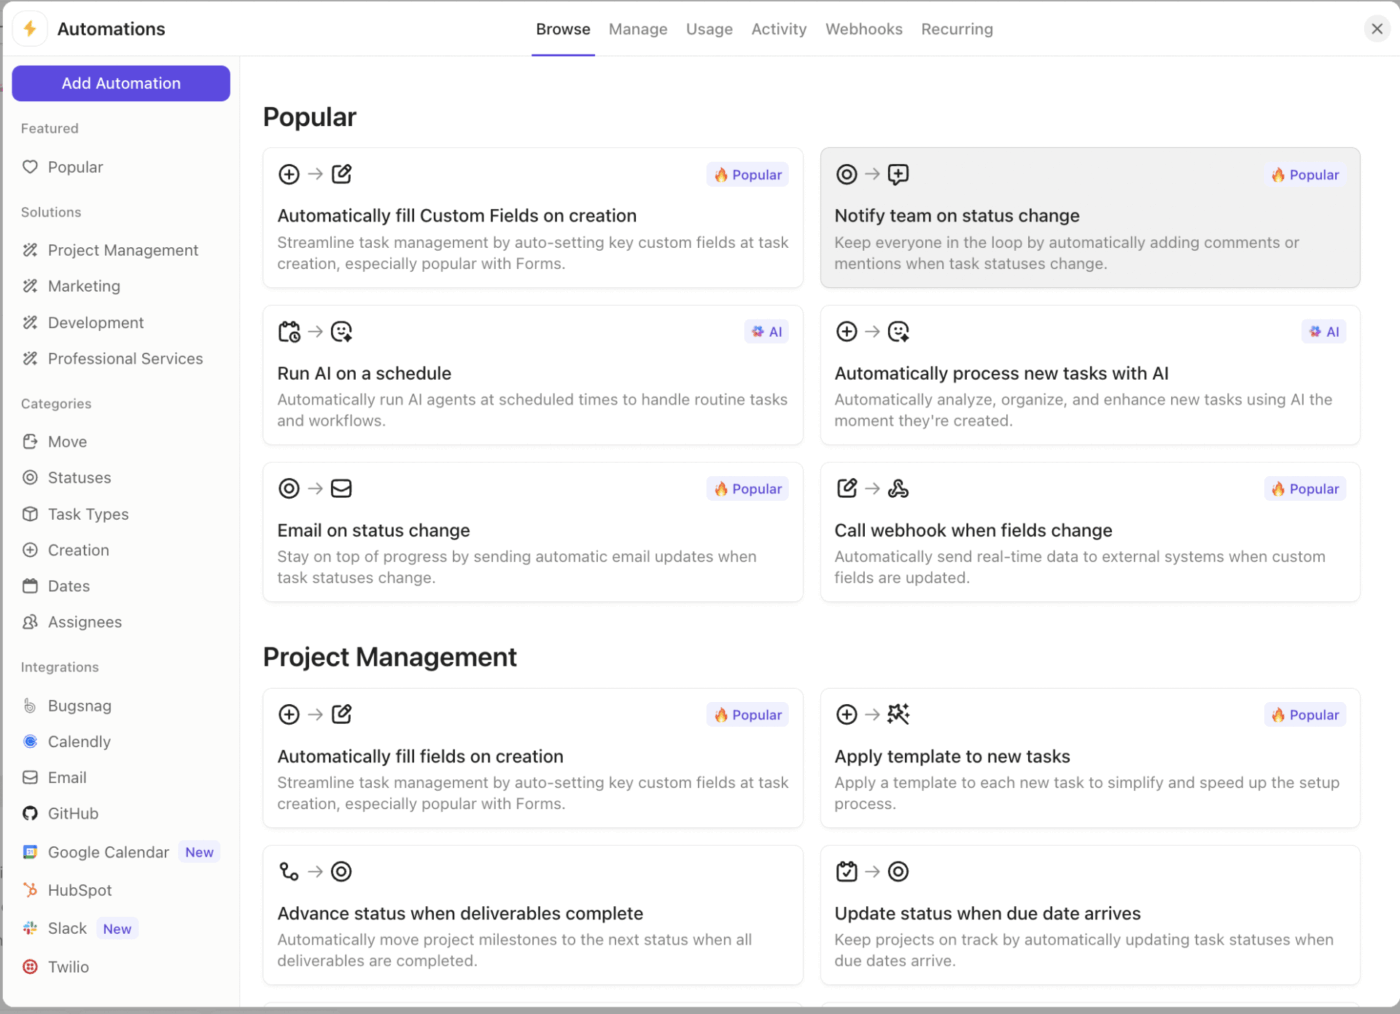
Keep it current with ClickUp Automations that notify owners when a new source or tag appears and add a checklist to next week’s report when a UTM rule changes. This turns data collection into a steady reporting process instead of a scramble.
For reporting, create a doc template with four blocks: Sources, Conversions, UTMs, and Attribution. Add a tiny decision rule, for example, if Meta and site conversions differ by more than 20%, investigate before sending reports.
With ClickUp, we went one step ahead of the game and created dashboards where our clients can access and monitor performance, occupancy, and projects in real time. This allows clients to feel connected to their teams, especially given that they are located in different countries, and sometimes even on different continents.
Save one reusable report outline with four parts in order: executive summary, key metrics table, what changed and why, and next steps with owners and dates.
Pair it with a dashboard template for visuals. For example, you could use a line chart for website traffic, a bar chart for channel performance metrics, and a table with clear filters for campaign performance.
Add a Text widget labeled “This week” in one sentence to keep context front and center.
Create a second dashboard tab per channel for deeper reads, while the first tab stays clean and client-facing.
The repeatable layout speeds up onboarding, improves reporting efficiency, and supports actionable strategies across multiple clients
Pro Tip: Add AI Cards to dashboards for real-time reporting, executive summaries, and pipeline health checks—no manual report-building required.
Pulling metrics manually? That’s a fast track to errors—and burnout.
Connect your dashboards and analytics tools so reports auto-populate with real-time data. This ensures accuracy and frees your team to focus on what matters most: interpreting the numbers and telling a clear story about performance.
You can also replace manual reminders with ClickUp Automations that create a task to pull numbers each Monday, attach the checklist, set due dates, and notify the client lead on status changes.
Use dynamic assignees so ownership stays accurate as teams shift, and auto-create a QA task when the report moves to review.
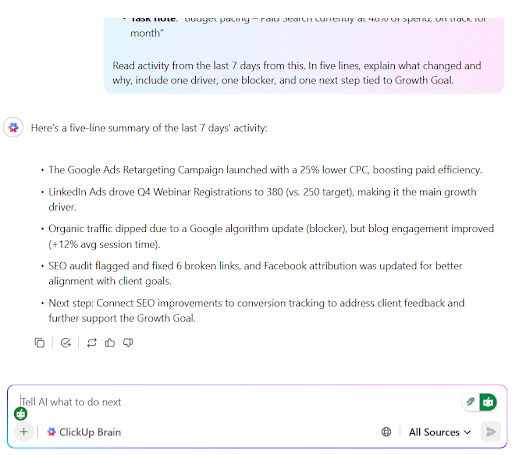
Let ClickUp Brain draft a short update based on weekly activity, highlighting two drivers and one risk for you to refine. Over time, add a small comments summary to the dashboard to capture client feedback in one place.
💡 Pro Tip: Use ClickUp Brain to create a clear “what changed and why” note without starting from zero. It works in context with your tasks, docs, and dashboards, and supports multiple premium AI models in one place, so you receive solid answers without hopping between tools.
Teams report saving about 1.1 days per week and finishing some tasks up to 3x faster, which shows up quickly when you are writing executive summaries and tying results to targets.
Save this prompt and reuse it each week: “Read activity from the last 7 days in this client Folder. In five lines, explain what changed and why, one driver, one blocker, and one next step tied to our growth goal. Include links to the source tasks.” The output is a human-ready draft you can edit for tone, then paste straight into your report.
Quality control protects trust and data accuracy. Link a pre-send QA checklist doc to the reporting task and verify the date window, platform parity, and any attribution or currency updates.
Keep a tiny change log so clients understand why numbers may shift week to week. Share the dashboard with permissions, post the executive summary as a comment, and gather structured client feedback through a simple form.
This keeps conversations focused on actionable insights and next steps, not housekeeping.
QA must-verify items: Date range, currency, attribution window, naming alignment with the Data Mapping Doc
💡Pro Tip: Pin the dashboard link at the top of the client’s Space and keep the latest report task visible for quick access
Turn the system into a template bundle that includes key metrics, the report outline, the dashboard layout, and the Data Mapping Doc.
Whenever you start working with a new client, use ClickUp Automations to kick off a New Client checklist that assigns owners, sets dates, and creates the first month of weekly reports.
Run a short monthly retro comparing goals vs. actuals and capture one sentence per channel in a “What we learned” doc. Update the template whenever a better widget, clearer chart, or smarter QA step emerges.
💡 Pro Tip: ClickUp Agents keep reporting on track while you work.
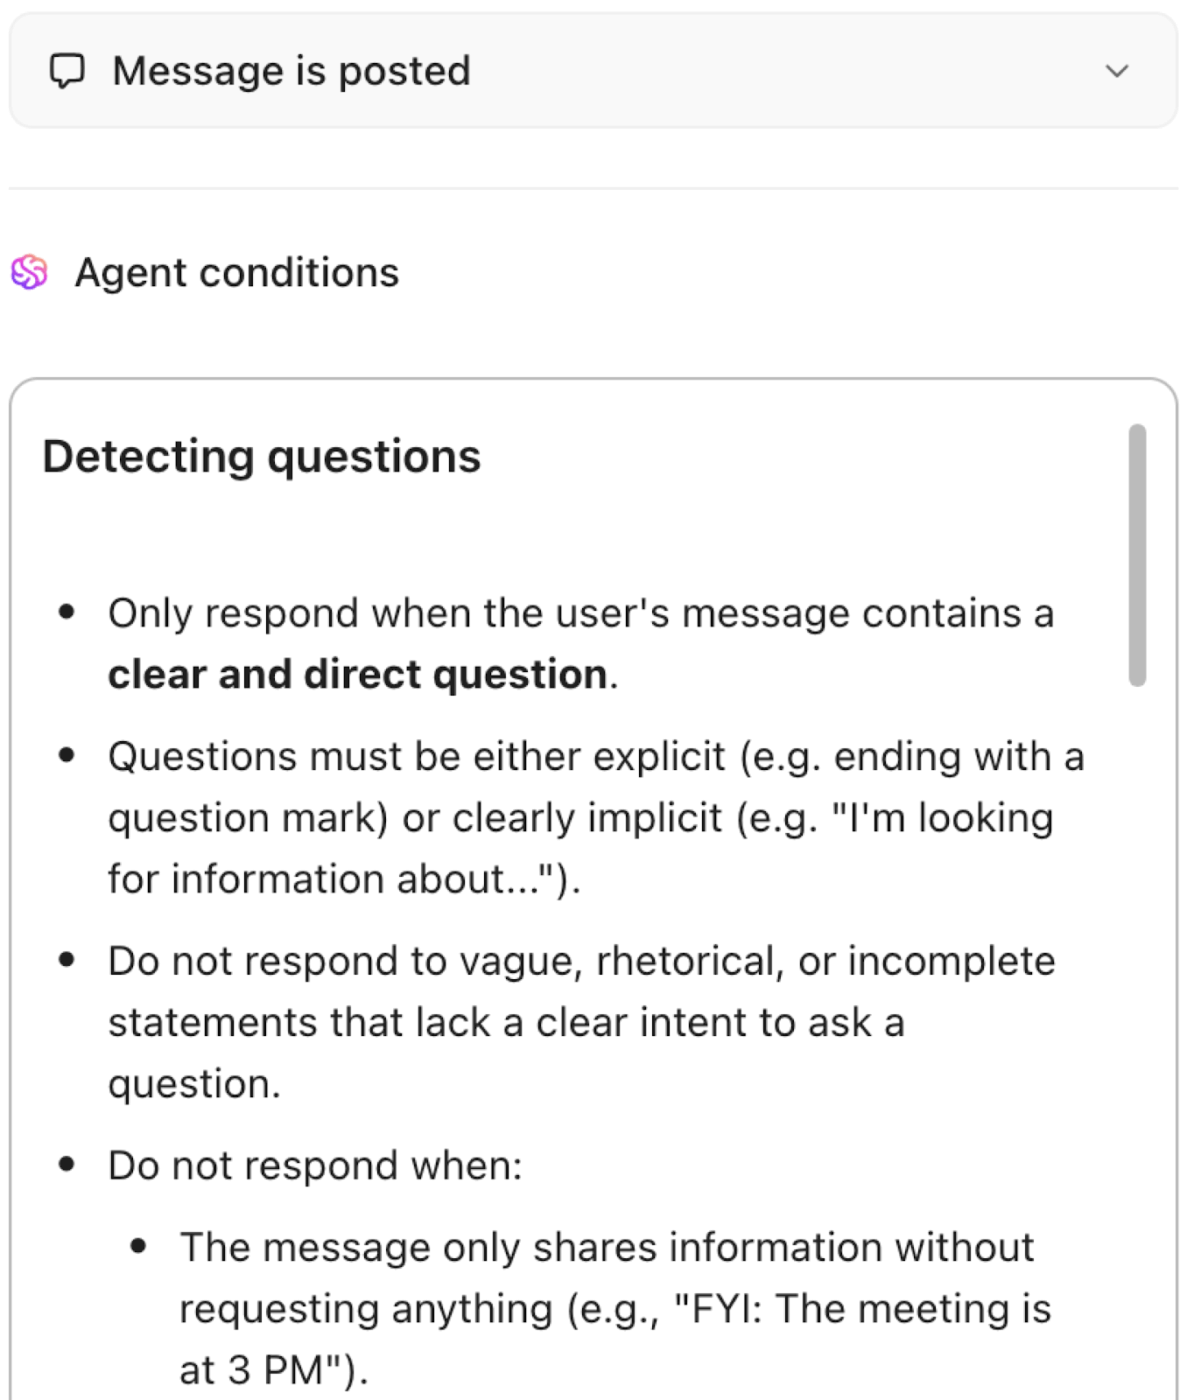
Set up a Live Answers Agent to listen for questions like “Is the renewal campaign pacing on budget?” and reply with source links from your Workspace so updates do not get lost in chat or email.
Add a Live Intelligence Agent to surface risks, missing owners, or overdue reporting tasks, and to recommend next steps based on your goals and historical work.
Plus, agents connect to tools like Google Drive and Salesforce, so they can pull the right context while keeping your data private and controlled. Use them to auto-generate weekly updates, assign follow-ups, and keep the dashboard tidy without manual chasing.
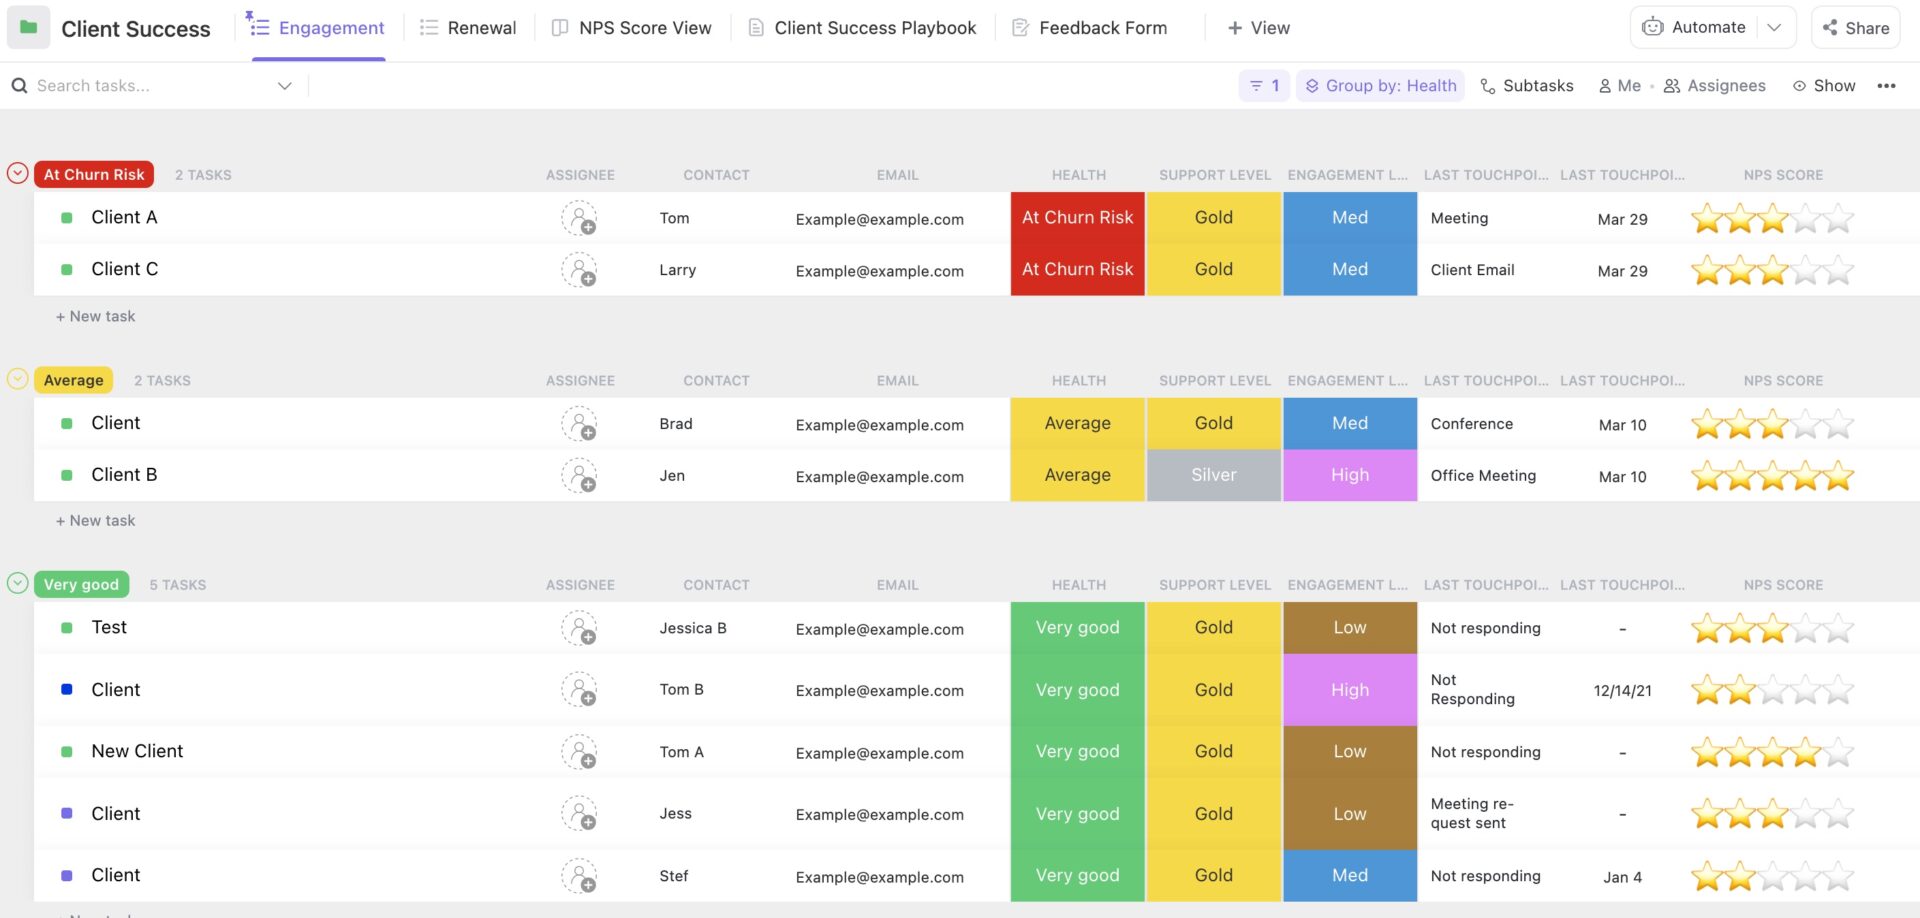
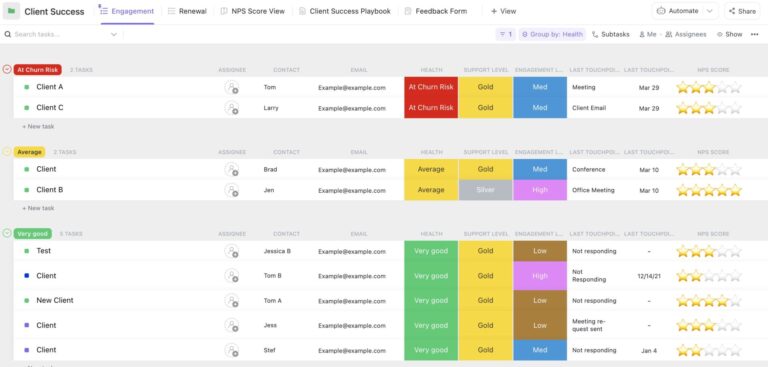
The perfect place to lock this in is with a ready-to-use starter. If you want the system you just templated to deliver client success on day one, plug in ClickUp’s Client Success Template.
The template gives you a working folder with views for a client success playbook, a getting started guide, a feedback form, renewal, and engagement. Use custom statuses like Onboarding, Nurturing, Up For Renewal, Renewed, and Churned to keep every client’s journey visible.
As feedback arrives, convert form responses into tasks with owners and dates, then review them in your monthly retro to drive client retention and actionable insights.
🌻 Here’s how to use this template
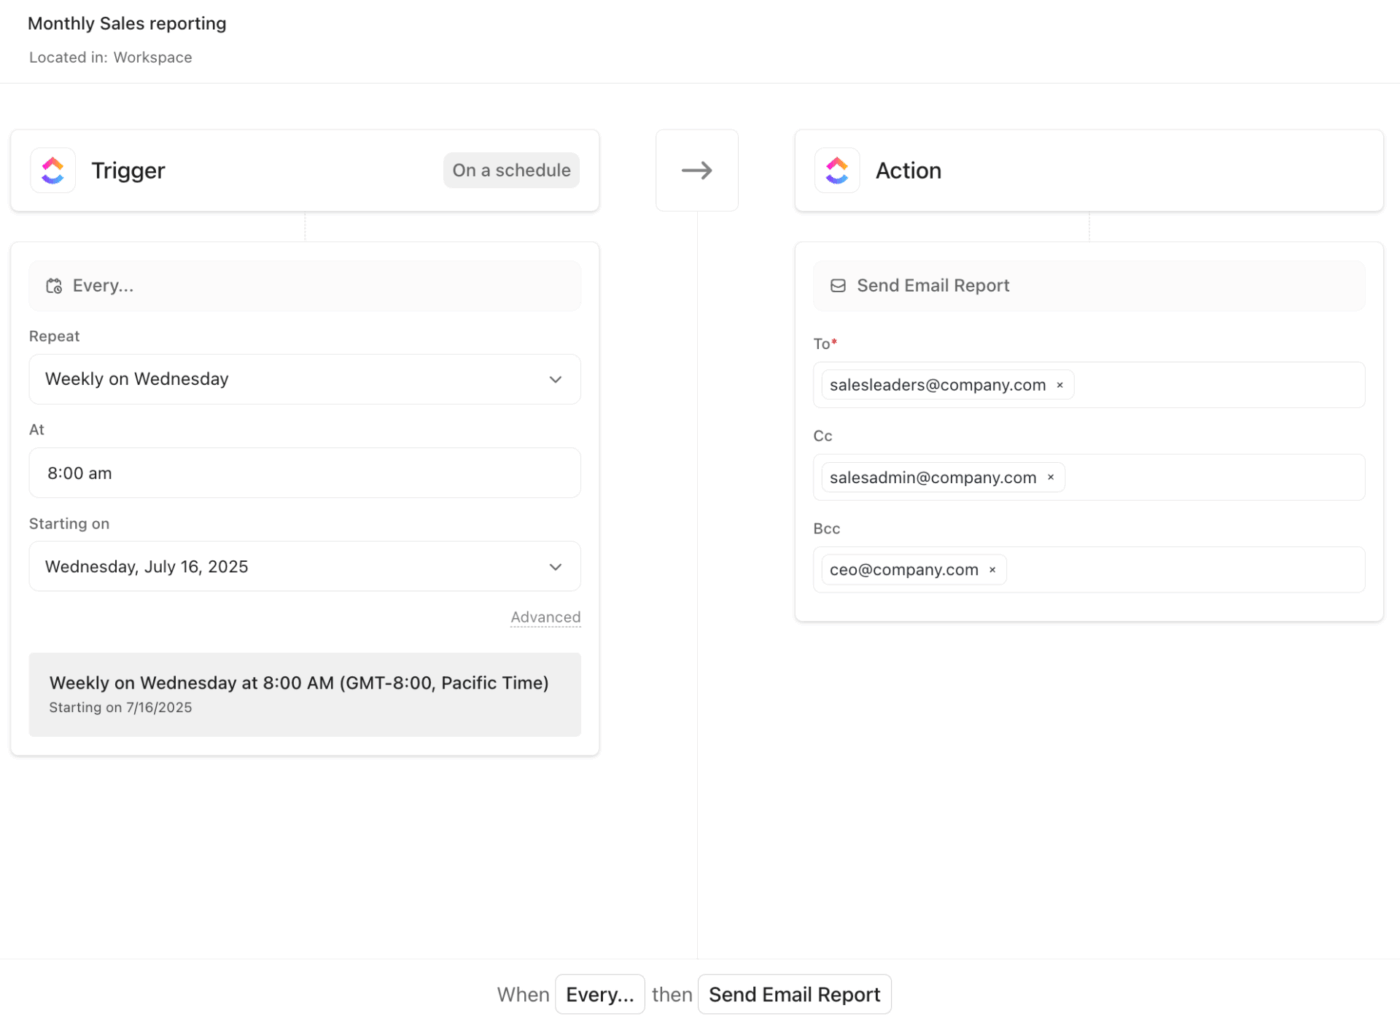
Pro Tip: Set up a custom automation in ClickUp to email scheduled reports to your stakeholders. This ensures that your dashboard reaches your audience on time, regardless of what’s happening.
Many agencies now keep live dashboards available and then use a short summary to guide the conversation, which helps teams move faster between updates and more profound reviews.
GA4 and other tools have changed how we collect and interpret data, so clear definitions and lightweight QA matter more than ever.
Here is a tight list you can adopt right away and then tailor to your client’s business and reporting cadence.
Bonus: ClickUp Brain MAX, your desktop AI companion, can search across all your work apps and the web, then instantly generate summaries and insights from that data.
With Brain MAX, you can:
In God we trust. All others must bring data.
With shifting privacy rules and tool changes, a few traps show up often when it comes to reporting. Here is how to spot and fix them before they cost trust or budget.
🚩 Chasing vanity metrics that look good on slides while missing outcomes clients actually feel
✅ Anchor reports to pipeline, qualified leads, revenue, or retention, and keep channel stats in an appendix. Add commentary explaining why the data matters and what action it supports.
🚩 Broken or partial consent setup that hides conversions and skews GA4 reporting
✅ Implement Consent Mode v2 with a proper CMP, validate tags, and document modeling or thresholding in the report so everyone understands gaps and why numbers differ across tools.
🚩 Context sprawl from unclear definitions, UTMs, and naming that make week-over-week comparisons unfair
✅ Maintain a shared glossary for conversions, attribution windows, and UTM rules; link to the exact views; and run a quick QA checklist each cycle so “same metric” means the same thing every time.
🚩Including every metric possible makes reports hard to digest and distracts from key insights
✅ Use visuals and summaries to emphasize what really matters. Offer deeper data only as an appendix or interactive dashboard link for those who want more detail.
🚩Lack of actionable insights that turns reports into sterile status updates
✅ Always include next steps, optimization ideas, and recommendations. When you connect insights to future actions, clients see you as a partner.
Bonus: Want more resources to enhance productivity, profitability, and workload management? Check out ClickUp’s Project Management Resources for Agency Teams.
Reporting should make life easier for your team and clearer for your clients. For creative and marketing agencies, the fastest wins come from transforming raw data into actionable insights and creating executive summaries that highlight key metrics, client ROI, and business outcomes with ease.
ClickUp helps you do that and much more. ✅
Track progress in a client-friendly view with ClickUp Dashboards while your team digs deeper in the background. ClickUp Docs and Automations hold your glossary, checklists, and reminders so quality stays tight, whether insights start in Google Analytics or any of your channel tools.
If this sounds like the kind of week you want, sign up for ClickUp now!
Create one reusable outline that works for every account. Keep an executive summary up top, then key metrics, what changed and why, and next steps with owners and dates. Document data mapping in a shared doc so the same definitions apply across multiple data sources. Use templates for dashboards and checklists so reporting efficiency stays high and data accuracy holds from week to week.
Pick a short set that ties to the client’s business objectives. Common picks are qualified leads, pipeline or revenue, client ROI, website traffic, and engagement metrics that support campaign performance. Keep platform stats in an appendix and focus the main view on business outcomes and actionable insights.
Yes. Use automations to schedule weekly reports, assign owners, and trigger QA checklists, and use goals and dashboards to roll up progress from tasks without extra work. ClickUp Brain can draft a simple “what changed and why” note, while Docs stores your glossary and change log to protect data accuracy.
Most teams do a weekly pulse and a monthly rollup. Weekly reports surface up-to-date insights and small fixes, while the monthly version connects trends to strategy and budget. Keep the reporting cadence consistent so everyone stays on the same page.
Lead with a plain language executive summary that answers if it is working, why, and what happens next. Show key metrics that matter, link them to data sources, and add one clear recommendation with an owner and date. Maintain a tiny change log for attribution or currency shifts, and use interactive dashboards for detail so client-facing reports stay simple and useful.

© 2026 ClickUp

There’s an easier way. Try a free AI Agent in ClickUp that actually does the work for you—set up in minutes, save hours every week.