
Sorry, there were no results found for “”
Sorry, there were no results found for “”
Sorry, there were no results found for “”
Several aspects of a project need to work in harmony to keep it running smoothly.
But without a unified project dashboard to give you a comprehensive and consolidated overview of your project health and status, you’ll have to sift through lengthy reports and data sheets to derive key insights.
That’s where a Google Sheet dashboard template comes in handy. It saves you the groundwork of setting up the project management dashboard from scratch. Instead, you can plug in your information and get started right away.
Google Sheets dashboards streamline data analysis and reporting by displaying important information through graphs, charts, tables, etc.
In this article, we review the best Google Sheets dashboard templates and provide alternatives that will further enhance your team’s productivity.
Google Sheets dashboard templates help you organize and visualize data using elements like pie charts and graphs, making it easy to interpret key metrics at a glance.
For instance, an event marketing timeline template can help you manage all campaigns neatly from a single space. You can even pull data from spreadsheets and third-party sources like Google Analytics, Salesforce, Github, etc., to create graphs, tables, and charts.
The best part is that these customizable dashboard templates are used for various use cases to communicate project health and progress to key stakeholders.
A Google Sheets dashboard template should provide the following:
While Google Sheets has several dashboard templates, we’ve curated a list of five free Google Sheets templates available on the internet.
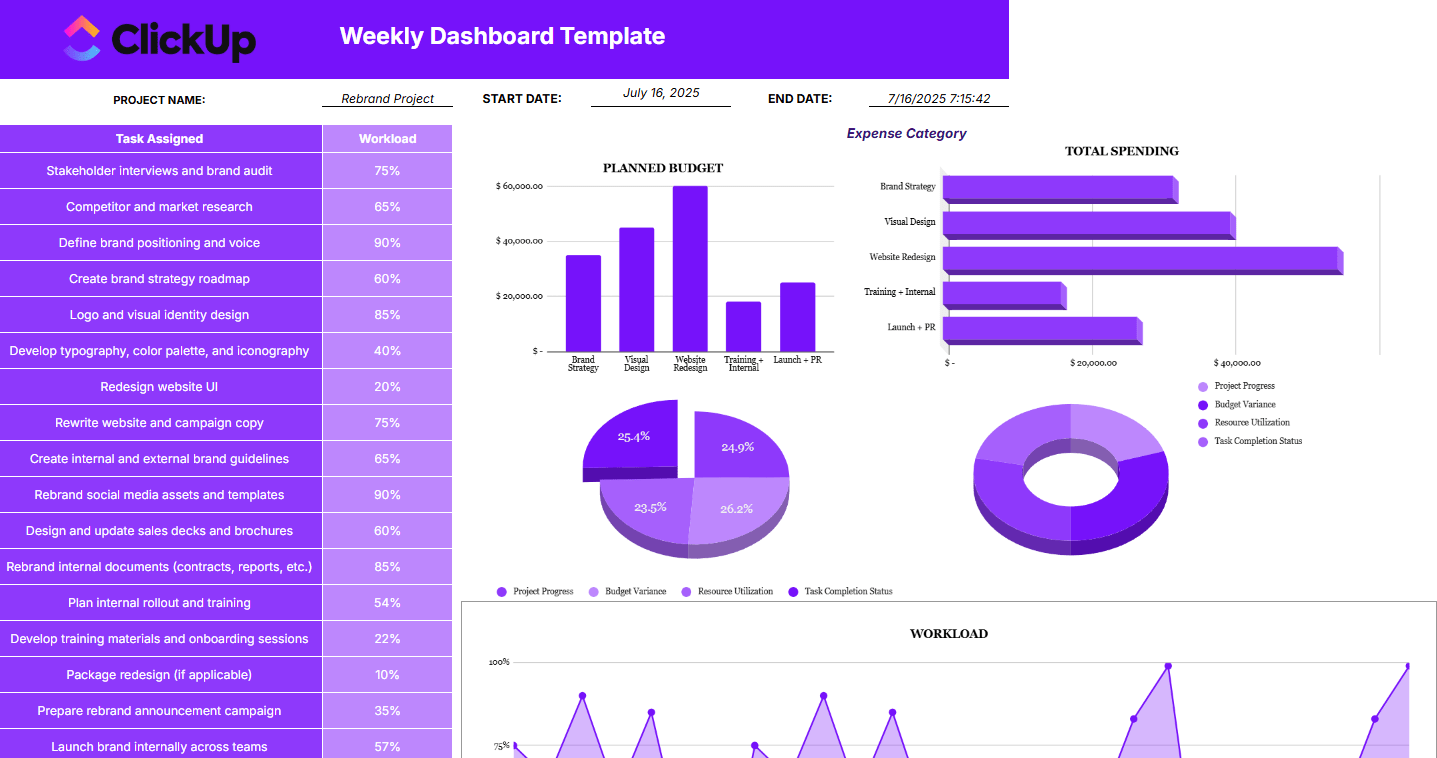
The Weekly Dashboard Template by ClickUp is designed to simplify project reporting by turning raw data into clear, visual insights. From tracking individual task loads to monitoring budget allocation and project status, everything is laid out to help you make quick, informed decisions each week.
It features a detailed task table with workload percentages, alongside bar and pie charts that cover planned vs. actual budget, total spending by category, and project progress indicators. The dashboard view ensures your team stays aligned and stakeholders get the clarity they need.

The Website Traffic Report Template for Google Sheets by Coefficient connects with your Google Analytics account and automatically pulls in data, providing a comprehensive overview of your website’s performance.
You can analyze audience behavior, examine traffic acquisition channels, identify your most popular pages, and more—all in one place.
The template also summarizes essential Google Analytics metrics, helping you set targets and make data-driven decisions.
This Google Sheets dashboard template is a valuable tool for your website analysis because it:

Employee retention strategies aren’t just about keeping people around; they are also about keeping your employees happy. 😁
The Attrition Analysis Google Sheet Dashboard Template by Template.net allows you to visualize and track attrition trends effortlessly.
With an analytics dashboard like this, decision-makers can gain insights into talent placement in every department within the organization.
HR teams can use this Google Sheet dashboard template to visualize employee turnover trends and identify key factors affecting attrition, laying the foundation for creating talent acquisition and retention strategies.

Companies measure full-time equivalent (FTE) to evaluate hiring capacities and current payroll within a specified time frame. Based on their work hours, part-time workers are counted as a fraction of full-time employees.
The FTE Calculation Dashboard Template by Template.net aids optimal resource utilization by mapping FTEs with resource requirements in projects. By analyzing historical data and making projections for the future, it helps HR teams plan for future staffing needs.

The User Engagement Dashboard template by Template.net provides a comprehensive overview of customer interaction data over specific time periods, helping you create user engagement strategies.
Use this analytics dashboard template to monitor user activity, retention rates, and engagement trends. It provides a visual representation of data for quick insights and allows you to track multiple engagement metrics.
Using Google Sheets templates for dashboards seems a good choice if you’re familiar with the tool.
But it does come with its share of limitations, such as:
While Google Sheets dashboard templates are easy to use, they lack advanced collaboration and customization features.
For advanced reporting features, you need dashboard software that helps track project status, collaborate with your team, communicate expectations to team members, and derive detailed insights for stakeholders—all in real time.
ClickUp is an all-in-one productivity and project management platform where you can easily create a custom dashboard for sales overviews for instance. And that’s just one. From marketing campaigns and sprint planning to CRM pipeline reports, the use cases are endless.⚡️
It has a library of pre-designed and customizable dashboard templates that integrate with the tools in your tech stack for automatic data transfer, reducing manual effort and time.
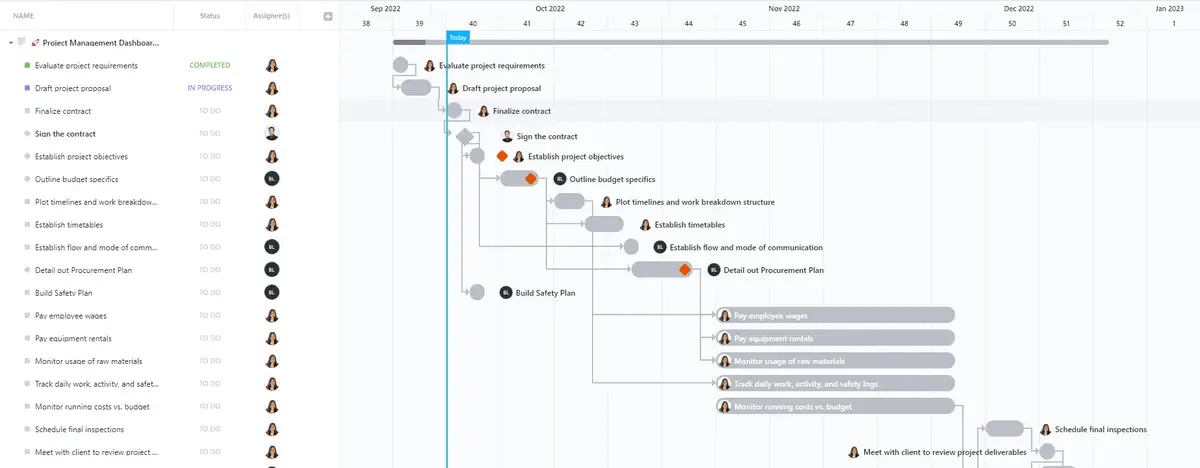
The Project Management Dashboard Template by ClickUp simplifies project management by providing a designated and pre-built space to visualize your work through neatly organized folders and sub-folders for each project phase.
With this template, you can:
This project management dashboard lets you view the entire project pipeline in a centralized location. Consider it your all-in-one solution for planning projects efficiently and avoiding failure.
💡Pro Tip: Use ClickUp Docs to create project roadmaps, wikis, knowledge bases, and more. Work with your team in real time and turn ideas into actionable tasks to connect docs with your workflows.
Marketers use ClickUp’s Marketing Report Template to track KPIs, campaign performance metrics, website analytics, and conversion metrics and ensure alignment between strategy and execution.
Here’s how marketing teams use this template:
Managing and understanding analytics can sometimes feel like solving a Rubik’s Cube blindfolded. The Analytics Report Template by ClickUp simplifies the process and helps you shine a light on your data.
With this template, you can:
ClickUp Dashboards help you understand complex data sets easily through charts, graphs, diagrams, and other visualization tools.

Depending on your goals, you can customize it to visualize the performance of marketing initiatives, track sales data with custom calculations, monitor key customer engagement trends across segments, and get sprint insights for agile projects.
💡Pro Tip: New to creating dashboards? Use these dashboard examples to build one for your project and communicate key insights quickly and clearly.
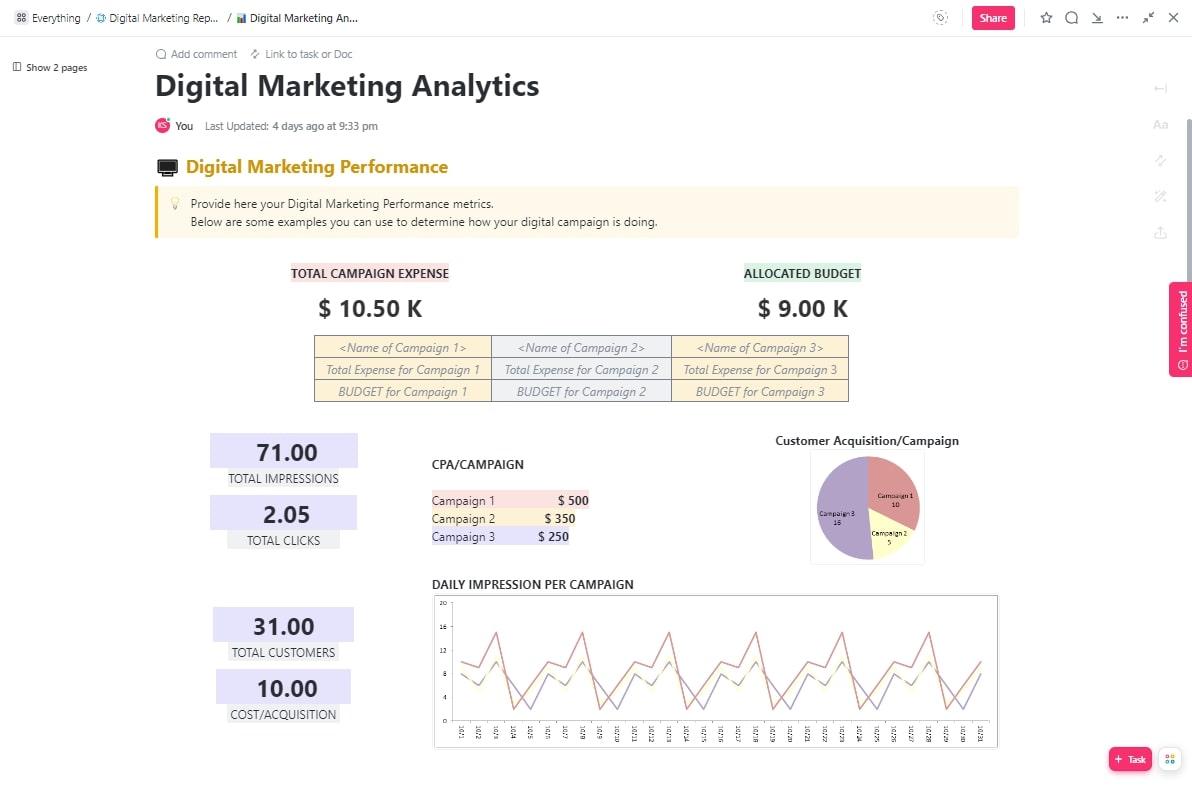
ClickUp’s Digital Marketing Report Template makes campaign tracking as easy as pie—no baking skills required. 🍰
This marketing analytics template is designed to help you monitor and analyze your marketing strategies and efforts, ensuring you never lose track of your goals.
Here’s how it simplifies the process:
💡Pro Tip: ClickUp Brain, ClickUp’s built-in AI assistant, helps create detailed surveys for market research and customer sentiment analysis. The AI writing tool can summarize documents, research findings, and lengthy email threads to give concrete data points for accurate reporting.

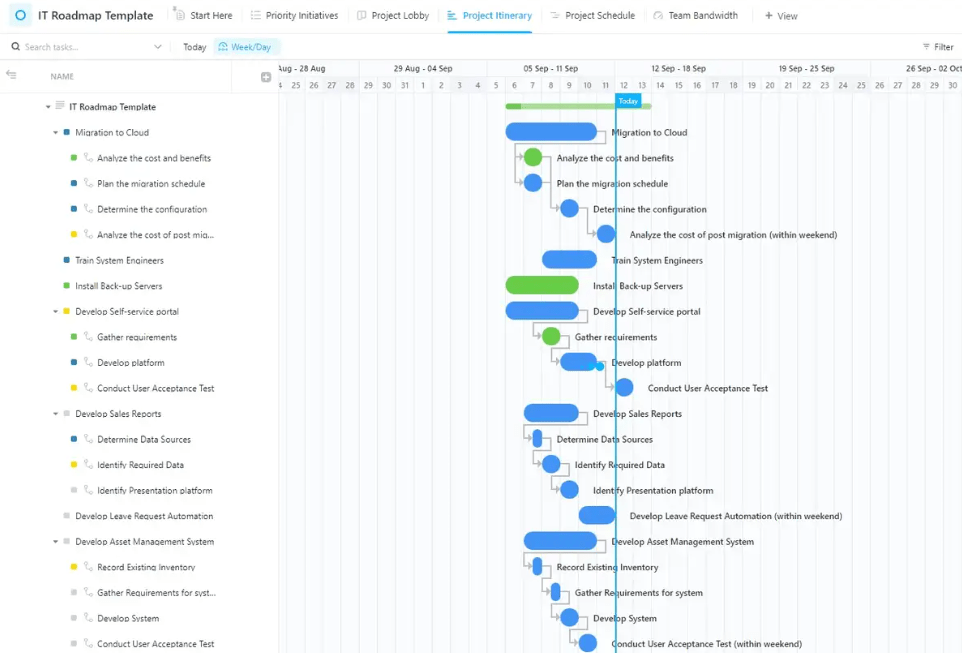
For project managers, navigating the world of IT projects can feel like steering a ship through stormy seas.
ClickUp’s IT Roadmap Template is your trustworthy compass, guiding you toward strategic success.
With this template, you can:

💡Pro Tip: Create a task dashboard to get a 360-degree view of the task progress across the development, testing, and integration phases. Use it to map dependencies, identify delays, and ensure projects run smoothly and on time.
Google Sheets dashboard templates enable reporting and data-driven decision-making in a few simple steps. However, finding a Google Sheets template to suit all your needs and preferences is difficult, and customizing these templates is even more so.
With a vast template gallery of ready-to-use, free, and fully customizable dashboard templates in ClickUp, you can elevate business reporting and analytics.
In addition to creating a dynamic dashboard with a unified overview of the most important metrics, you can use ClickUp Docs to collaborate with your team to create reports and ask ClickUp Brain to automate report writing.
With customizable views, you can see tasks with due dates, assignees, dependencies, and priority on a calendar or a Kanban board for greater visibility into progress. Whether you’re looking to manage projects, track marketing campaigns, or measure key marketing metrics, ClickUp will help you succeed.
To get started, sign up on ClickUp for free today.

Praburam Srinivasan
Max 21min read
Praburam Srinivasan
Max 21min read
Praburam Srinivasan
Max 14min read

© 2026 ClickUp