Sorry, there were no results found for “”
Sorry, there were no results found for “”
Sorry, there were no results found for “”
Unlike Key Performance Indicators (KPIs), Objectives and Key Results (OKRs) are typically qualitative and may be challenging to track. This makes it hard to navigate the sea of tasks and ensure you’re going in the right direction. Luckily, you can fall back on a good OKR dashboard as your compass. 🧭
A well-built dashboard gives you a detailed visual snapshot of your progress and performance, allowing you to keep the entire team on the same page and make data-driven decisions instead of taking shots in the dark.
In this guide, we’ll tell you everything you need to know about OKR dashboards and teach you how to create one from scratch. We’ll suggest the best practices and OKR software that won’t burn a hole in your pocket while still making all the necessary information readily available.
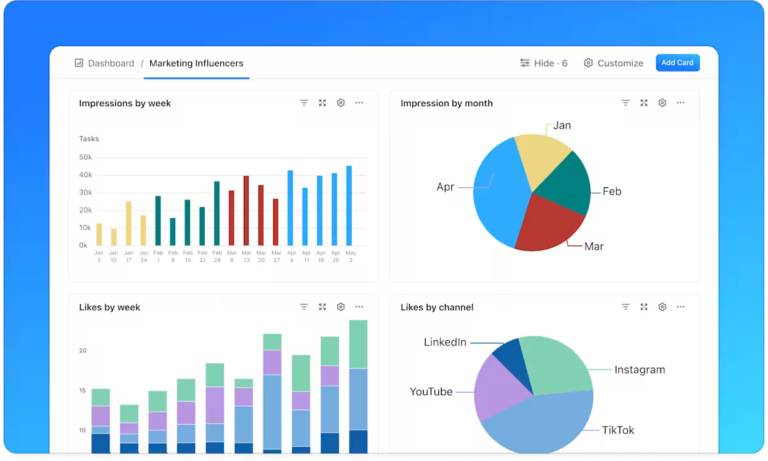
An OKR dashboard is a visual project management tool that lets you effortlessly track goal progress and tasks through graphs, charts, and similar dynamic elements. Its main purpose is to use the OKR methodology to summarize large amounts of data to provide actionable insights you can use to keep moving toward your company’s objectives. 🎯
While the dashboard is mainly aimed at project/product managers and C-level executives, it can be helpful to employees throughout the hierarchy. It helps you break down OKRs into initiatives you can track to make a project more digestible and ensure everyone is clear on their contribution and role.
Besides, not all OKR dashboards encompass company-level projects and objectives. You can also use individual dashboards to track each employee’s personal OKRs, which helps them stay motivated and lets you get to know them better.
Regardless of its use, a well-developed dashboard ensures you don’t need to juggle lots of spreadsheets and docs to understand your project’s current standing and team performance. All the key information is presented in a clear, visually appealing way, which leaves more time for decision-making.
To simplify reporting and facilitate data-driven decisions, an OKR dashboard should contain the following key elements:
If you create a dashboard that checks all of the above boxes, you can enjoy numerous benefits. Let’s go over the most impactful ones. 🌟
OKRs are typically ambitious and involve multiple teams throughout the entire company. Without a centralized system for visualizing them, you run the risk of miscommunication and might enable project silos.

An OKR dashboard brings all relevant parties together to ensure clarity and a comprehensive overview of all the necessary initiatives. As a result, people can see how their work fits into the bigger picture and get the context they need to complete it effectively.
A comprehensive dashboard platform might also come with built-in collaboration features, reducing the need for additional productivity apps. This can centralize your workflow and remove time-consuming inefficiencies.
As your teams work toward their key results, you’ll want to be kept in the loop at all times. An OKR dashboard can make this happen without countless meetings and check-ins. You can see precisely how much work is done at any given point and have all the necessary updates available at a glance.
Note that this is only possible if your dashboard software integrates with scheduling tools to allow real-time task tracking. This isn’t the case with every solution, so you may need to do either of the following:
OKR dashboards aren’t only used for data analysis—they also help you add some fun to your workflow and keep employees engaged through gamification. According to a survey, doing so is a wise idea because 89% of employees said gamification made them more productive, and 88% reported increased levels of workplace happiness.
There are countless gamification options to explore, and your OKR dashboard plays a key role here. You can set up a reward system based on milestones, initiatives, and key results to keep your employees excited and motivated. 🥇
You can also throw some healthy competition into the mix by adding points systems, leaderboards, and similar elements. Don’t go overboard, though, as you don’t want competition to come at the cost of collaboration.
Speaking of collaboration, OKR dashboards eliminate many teamwork setbacks, such as:
Besides OKRs, they typically show the related key initiatives, ensuring everyone’s responsibilities are laid out clearly. This removes confusion and lets you tie each initiative to a team member and identify the source of any inefficiencies in no time. 🔍
A dashboard also ensures complete transparency, which can do wonders for building trust within your company. As a bonus, employees might be encouraged to share knowledge and help each other out if everyone can see their teammates’ tasks.
A solid OKR dashboard can’t be created overnight—you must go through several steps and consult various decision-makers to ensure all the necessary data is there. You also need to find the right dashboard software with all the features we discussed earlier in this guide, and there are many options to choose from.
To shorten your search, let us suggest ClickUp—an all-in-one project management solution that lets you stay on top of your workflow and track progress effortlessly. 🤩
With ClickUp Dashboards, you can build your ideal OKR dashboard that gives you key insights into all the data you need. Let us show you exactly how to do this as we go through each step of the dashboard creation process.
An OKR dashboard can focus on one objective or several at once. It can also encompass business-wide objectives or employee-specific ones. With so many options, choosing the right objectives for the dashboard might be challenging. Still, it’s crucial to give this decision the time and attention it deserves, as it will impact all future steps.
If you need a starting point for defining your objectives, start with your company’s mission and vision. OKRs should be ambitious and inspiring, so don’t hesitate to aim high. 💯
As you don’t need to quantify it, don’t worry if an objective seems vague. “Increase brand awareness” is a perfect example of a valid objective, even if it appears ambiguous at first glance. You’ll break it down into key results and initiatives later, so you’ll still have a concrete way of measuring progress.
Once you’ve considered your objectives, you can use ClickUp Goals to bring them to life. Thanks to various visualization options, you can find the right graph for every objective type.
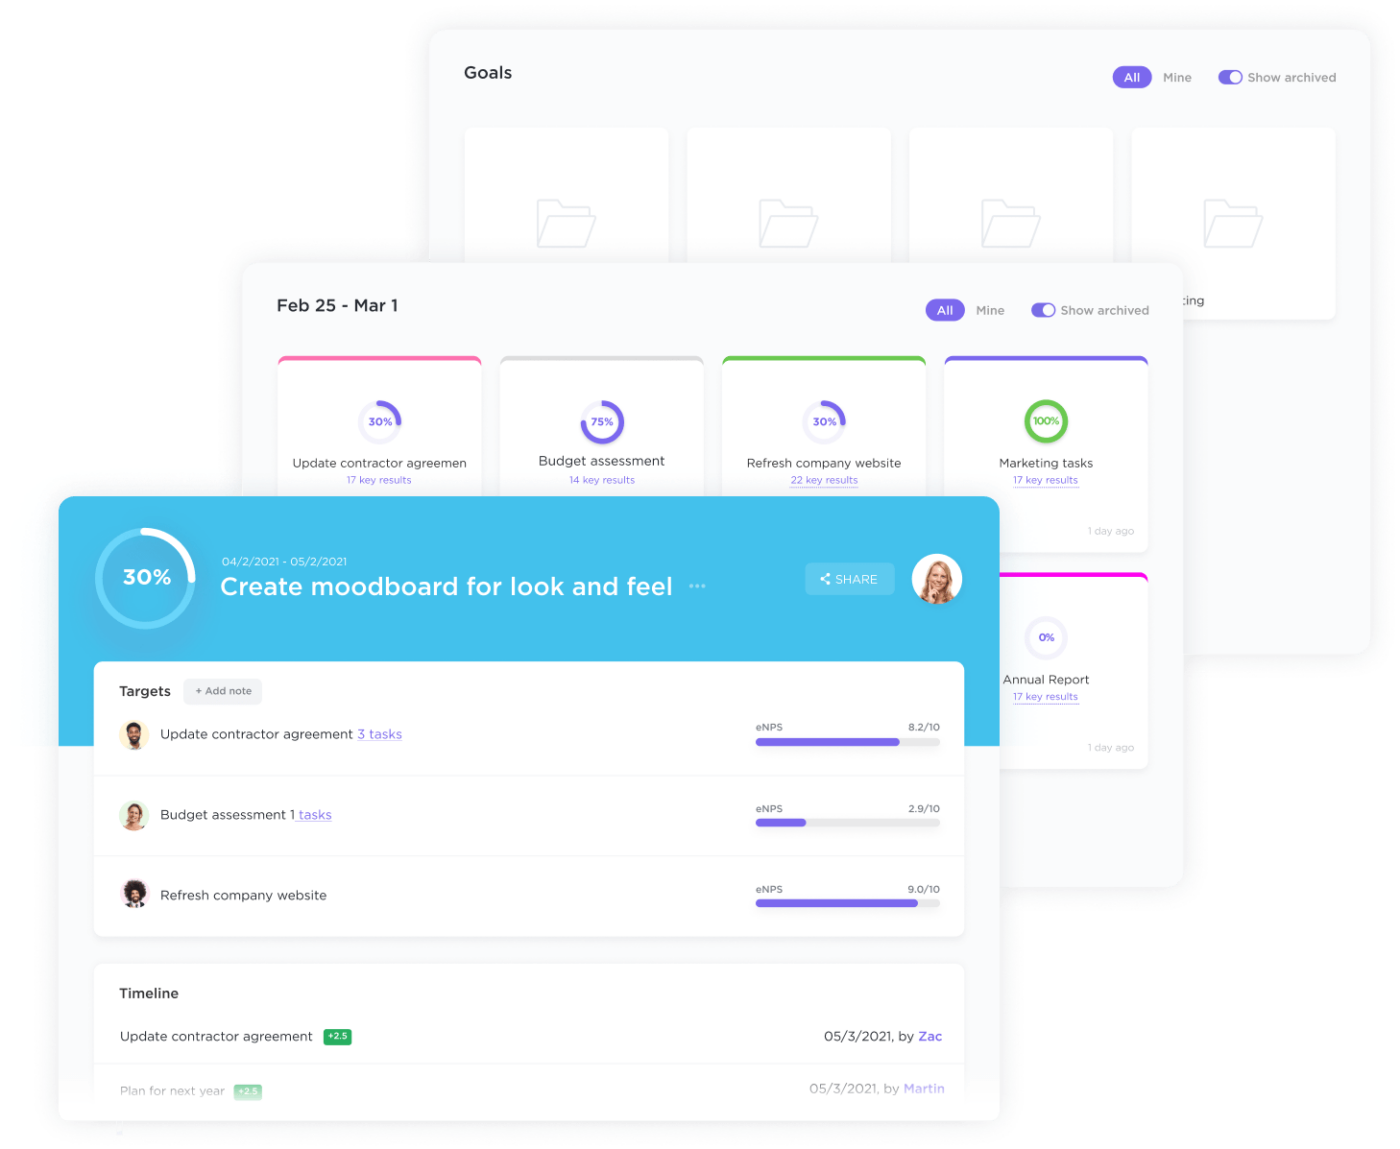
ClickUp offers flexible goal-sharing options, allowing you to give each team an overview of the relevant objectives without unnecessary information. You can also group objectives into folders for additional clarity.
Progress tracking happens automatically in real time, so you won’t need to deal with data lags. Whenever you glance at the dashboard, you’ll know precisely how close you are to achieving your objectives.
With your objectives in place, it’s time to go more granular and see how you’ll achieve them. In other words, you need to define key results and corresponding initiatives for each objective.
Two to five key results per objective is a sweet spot, though this number isn’t set in stone. All that matters is aligning the key results with objectives and drawing a clear roadmap for your team to follow.
If we go back to the brand awareness example, your key results can be:
Each of these key results can be further broken down into specific initiatives. For example, initiatives for writing 30 guest posts can include:
It’s crucial for these key results and initiatives to be in a centralized hub, or you won’t be able to track them effectively. That’s why ClickUp Tasks lets you bring them together and keep them neatly organized. 🗓️
The intuitive drag-and-drop interface makes it easy to manage tasks, and you can use several views to get a clear workflow overview.
ClickUp also offers various automations, recurring tasks, and similar features that minimize legwork and free up more time for decision-making.
After identifying OKRs and initiatives, it’s time to choose how you’ll structure them in your dashboard. The sky’s the limit here, especially if you leverage ClickUp’s 50+ widgets and numerous customization options.
If you’re unsure where to start, you can use an OKR dashboard template to get some inspiration. For example, the ClickUp OKR template comes with all the elements you need to organize your OKRs however you see fit. You get five Custom Fields and view types alongside seven statuses for tracking OKRs with pinpoint accuracy.
Besides the universal OKR template, you can leverage specific ones like the ClickUp Strategic Marketing Plan template. It comes with predetermined fields and elements tailored to marketing planning, allowing you to develop an effective strategy with minimal manual work.
Finally, you can check out some dashboard examples to get an idea of what your OKR dashboard should look like. Every element of your ClickUp dashboard is fully customizable, allowing you to adapt it to your OKRs and other specifics.
When designing your dashboard’s layout, focus on user-friendliness to ensure all relevant team members can navigate the dashboard seamlessly. You’ll need to strike a balance between form and function, so experiment with different designs to figure out what works best. 🧪
Not all OKR progress can be tracked through specific initiatives and their completion. For example, if you run a clinic and set improved patient experience as the main objective, hitting a specific average waiting time can be one of the key results. In this case, your OKR dashboard should connect to a platform that measures waiting time to give you the necessary information without needing manual entries.
You most likely have an established workflow, and your dashboard must fit into it instead of requiring you to make significant process changes. That’s why you need a dashboard solution that seamlessly integrates with your critical data sources.

ClickUp makes this happen in three ways:
You get complete freedom to tailor ClickUp to your needs and ensure your dashboard leaves no stone unturned. 🪨
Naturally, the dashboard can also pull data from ClickUp’s other solutions (Tasks, Goals, etc.), so you can stay on top of updates at all times.
Just because your dashboard is up and running doesn’t mean your work is over. As you track your OKRs, you might notice areas for improvement worth addressing. For example, some users might find it unintuitive or notice important data missing.
Your OKRs will also evolve quite a bit with time, so regular reviews and adjustments are crucial. If you have long-term OKRs, a quarterly review should do the trick. This may not be the case if you’re using the dashboard for smaller projects or individual employee tracking, as you’ll likely need more frequent check-ins.
The business world moves at lightning speed, so you should also be open to surprises that require you to adjust your OKRs or rebalance your priorities. In any case, make sure not to set and forget your dashboard but update it as needed.
Finally, use your dashboard to celebrate achievements and major milestones. A pat on the back goes a long way toward increasing employee happiness, and your dashboard will tell you who deserves it the most. 🤓
Without an OKR dashboard template, setting up an OKR dashboard might take some work, but it’s a critical component in your reporting efforts. You’ll stay in complete control over your team OKRs and make decisions much more confidently.
Your team will also appreciate the dashboard, as they can use it to stay on top of their workflow and get a motivation boost if needed. 💨
ClickUp lets you reap the above benefits on top of many others. It’s among the most intuitive and cost-effective ways to create robust OKR dashboards and manage your projects more efficiently. To supercharge your reporting efforts and enjoy the power of real-time data at your fingertips, create a ClickUp account today.

Sudarshan Somanathan
Max 25min read

Manasi Nair
Max 25min read
Manasi Nair
Max 12min read

© 2026 ClickUp


