


Still downloading templates?
There’s an easier way. Try a free AI Agent in ClickUp that actually does the work for you—set up in minutes, save hours every week.
Sorry, there were no results found for “”
Sorry, there were no results found for “”
Sorry, there were no results found for “”
Have you ever faced a tough choice, like picking between a healthy, home-cooked meal and a tasty, budget-friendly take-out option? You might find yourself mentally visualizing the pros and cons: the work involved in home cooking versus the low-effort but instant gratification of the other.
In scenarios like these, a T-chart may help. T charts help organize your thoughts visually, making decision-making easier and quicker. They are handy for similar decision-making tasks in a broader context. And since 65% of people learn better through visual aids, they can help immensely with decision-making across industries.
Educators can simplify lesson planning and curriculum development by contrasting different teaching methods. Students can use them to compare project ideas or study strategies. Business professionals might apply them to evaluate project options, investment opportunities, or strategic choices.
To get you started with T-charts, we’ll share seven free decision-making T-chart templates in this post to help you make better decisions. We’ll cover a variety of templates, from general comparison charts to specialized lists, so that you can find the perfect tool for your needs.
T-chart (also spelled T chart) templates are pre-built templates for T charts. T charts are visual tools to help you compare and contrast concepts (two) or options. They consist of two columns separated by a central line, each listing the characteristics, advantages, or disadvantages of the items being compared. The left side typically represents one option or concept, while the right represents the other.
This straightforward format helps organize information clearly and facilitate side-by-side evaluations. T charts are commonly used for decision-making, brainstorming, and analyzing and contrasting concepts in various contexts.
T chart templates come in several types:
A good T chart template effectively organizes information into two categories for easy comparison or contrast.
Its key features include:
Do you need a T chart to help with decisions or comparisons? We’ve found seven free templates that can make your life easier.
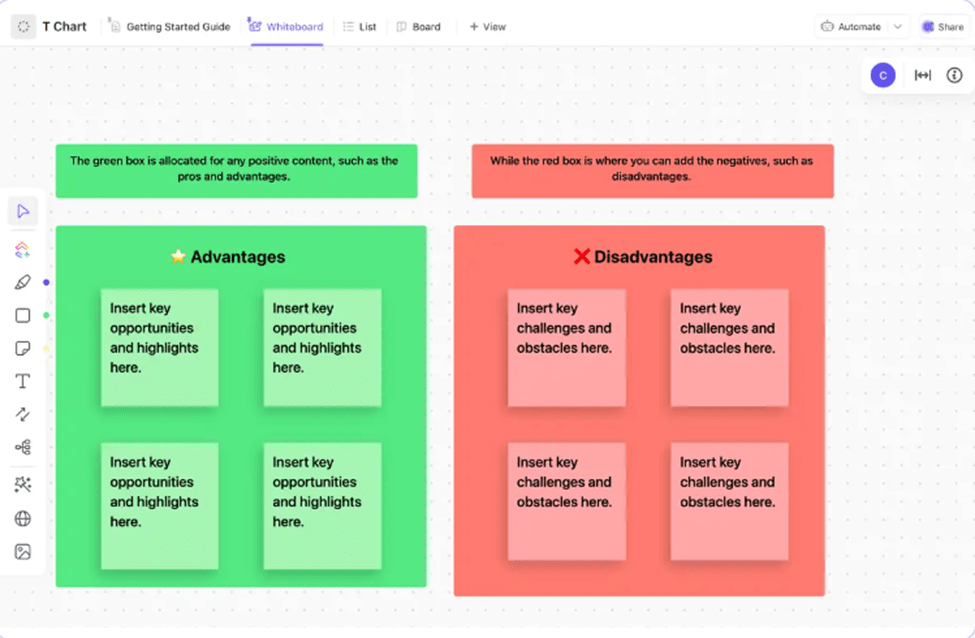
The ClickUp T Chart Template is a free T chart template that gives you a clear view of the pros and cons of any two ideas or concepts.
Here’s how it works:
Starting with the ClickUp T chart template is easy. Simply add the template to your ClickUp Workspace and invite your team. And there you go!
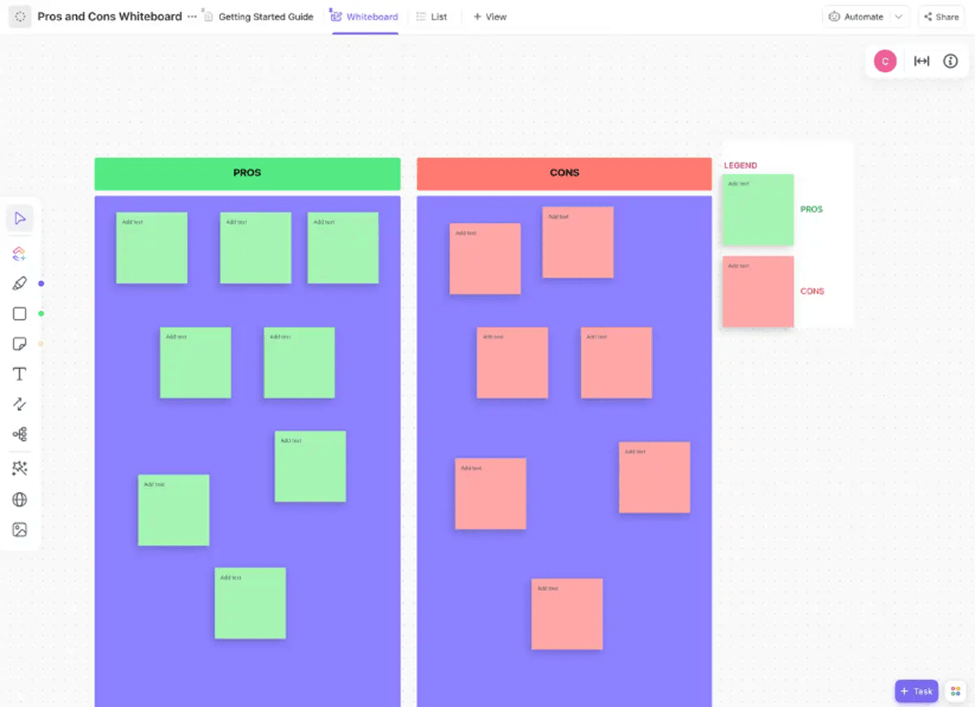
The ClickUp Pros and Cons Whiteboard Template makes tough decisions straightforward. Whether choosing new software or evaluating project options, a pros and cons template can simplify your decision-making process. Whiteboard project management enhances collaboration and creativity in projects. This method allows teams to visually map out ideas, track progress, and make real-time updates, ensuring everyone stays aligned and engaged.
Here’s how this template can help you:
With this template, you’ll reach data-driven conclusions faster than ever.
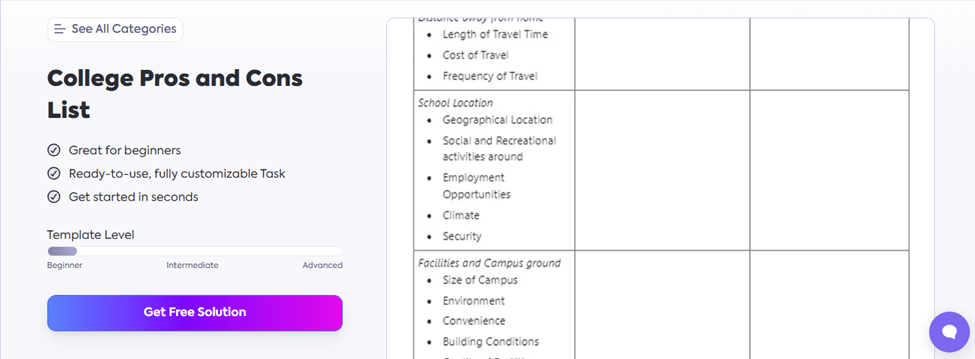
Deciding on the right college is one of those big life choices that can be agonizing—or at least that’s how it feels to some of us. The ClickUp College Pros and Cons List Template helps you systematically and objectively evaluate and compare different colleges to find the best fit for your needs.
Here’s how to use it:

Let’s say you’re weighing the benefits of an online degree versus a traditional classroom experience. On the one hand, you might jot down the flexibility and the ability to study in your pajamas for the online degree. Conversely, you might list a traditional class’s face-to-face interactions and structured environment.
This is where the T Chart Template for Online Degrees by Creately comes in handy. It helps you visualize and compare each option. We suggest starting with whiteboard software to jot down your thoughts first. Then, use the template to outline the pros and cons—such as the online degree’s flexibility versus the traditional class’s personal interactions. This makes it easier to see which option aligns better with your priorities.
You can easily tweak the T chart template to suit your needs and export it in formats like JPEG, PNG, and SVG, integrating it into Word documents, PowerPoint presentations, or Excel sheets.
For those high-quality printouts for classroom teaching, exporting the document template as PDFs is your best bet.
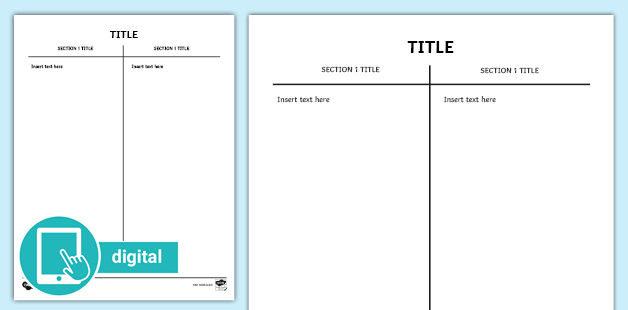
The Editable T-Chart Template by Twinkl is a teacher’s secret weapon. Ideal for upper-grade English Language Arts (ELA), it is designed to assist teachers in comparing topics, organizing study notes, and planning writing assignments.
Plus, it’s fully customizable—you can tweak it to fit any lesson plan.
Visual Paradigm’s T Chart for Comparison Template makes comparing ideas or topics straightforward and visually engaging. With its intuitive design, you can easily create two columns to contrast pros and cons, features, or other comparative elements. The drag-and-drop interface is intuitive, making diagram creation quite simple, while the rich collaboration features keep everyone on the same page, literally and figuratively.
As a web-based T chart maker, it is cross-platform and can work very well on Windows, Mac OS, and Linux. It’s built for today’s remote working world, supporting online meetings and workshops with powerful real-time collaboration tools.
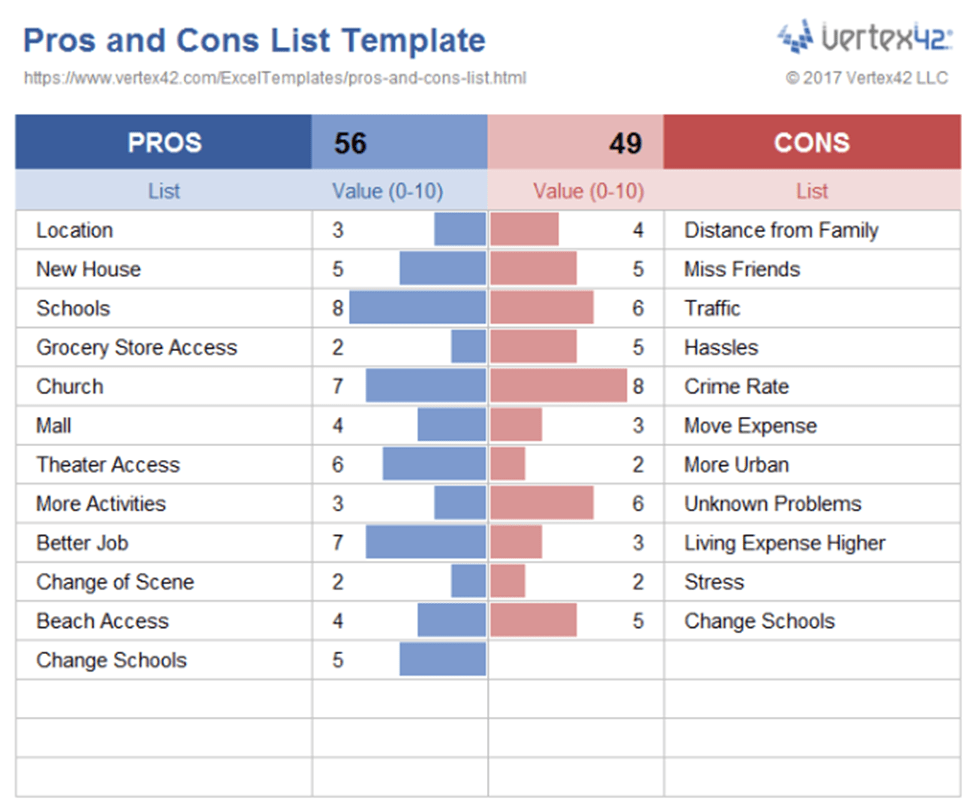
The Pros and Cons List Template from Vertex42 takes the classic T chart and adds a rating system to make it even more helpful. This template features two main columns: Value and List. In the Value column, you assign a rating from 0 to 10 for each item, with 10 being the highest score. The template uses conditional formatting to turn these ratings into visual data bars, making it easy to see which factors are most significant.
But here’s the key: the template isn’t meant to decide for you. It is a graphic organizer that helps you weigh what matters most and organize your thoughts.
Sometimes, even with all the data presented, your intuition might guide the final choice. And if you like graphic organizers or visual aids, you can sort your factors from highest to lowest, turning your data into a Tornado chart for an even clearer perspective.
T charts are an age-old but still highly effective way to organize your thoughts and decisions. Their simple layout, with two columns comparing two options, makes it easy to see what stands out and what falls short.
Whether making a personal choice or working with a team on project management ideas, T charts help you quickly sort through the pros and cons of virtually anything. And for those looking for a tool that does even more, ClickUp is your all-in-one productivity solution. It’s perfect for helping you make better decisions, managing tasks, collaborating, and staying on top of your goals.
Ready to streamline your decision-making? Sign up for ClickUp for free today and watch your productivity soar!

© 2026 ClickUp

There’s an easier way. Try a free AI Agent in ClickUp that actually does the work for you—set up in minutes, save hours every week.