


Still downloading templates?
There’s an easier way. Try a free AI Agent in ClickUp that actually does the work for you—set up in minutes, save hours every week.
Sorry, there were no results found for “”
Sorry, there were no results found for “”
Sorry, there were no results found for “”

Imagine you’re launching a new product.
❗️Do you go for a bargain price to lure in customers?
❗️Aim high with a premium tag for better margins?
❗️Or throw everything into marketing and let demand dictate the price?
Every decision involves trade-offs, but a payoff matrix helps you navigate uncertainty.
It transforms wild guesses into structured, data-backed insights by mapping out potential outcomes, competitor reactions, and strategic choices.
If you’re ready to simplify your decision-making process, stick around—we’re detailing how a payoff matrix can help you maximize profits while minimizing risks!
A payoff matrix is a mental model within decision theory and game theory. It simplifies complex scenarios, risk assessments, and strategic objectives in a straightforward format, making the decision-making process easier.
The method visualizes specific choices in a grid format, with each choice corresponding to a distinct outcome. Strategists can analyze, compare, and predict the results of different choices to evaluate trade-offs and competitor actions confidently.
There are two types of payoff matrices:
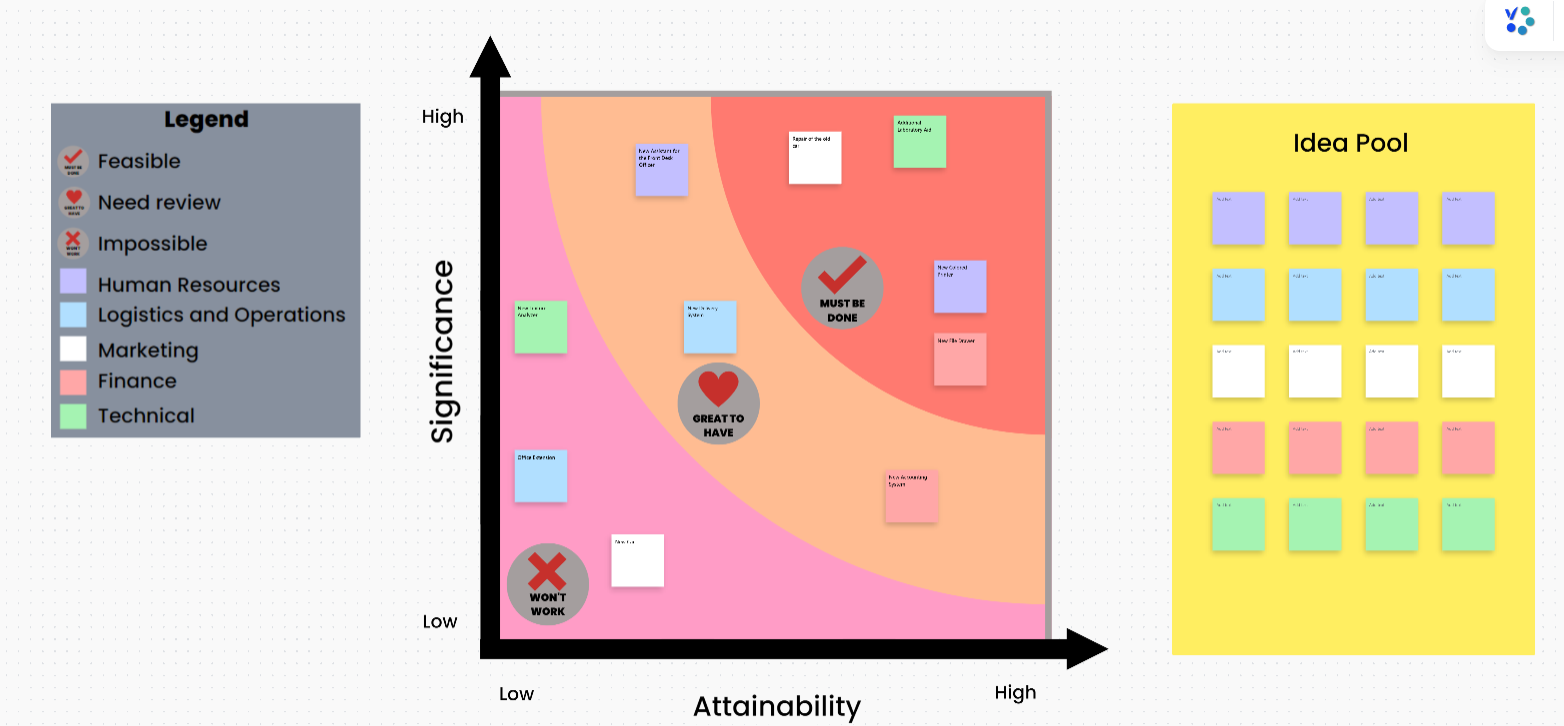
The ClickUp Prioritization Matrix Template helps you evaluate and rank ideas, concepts, or initiatives, determining which ones deserve the most attention. It allows teams to strategically assess the importance of different options before taking action.
This prioritization template features a whiteboard-style layout, making it easy to visualize options and discuss rankings. Thus, it best suits strategic decision-making, such as choosing between product features, investment opportunities, or project ideas.
➡️ Also Read: How to Create an Action Priority Matrix to Manage Tasks
The core components of a payoff matrix form a grid where each combination of choices leads to specific outcomes or payoffs.
It represents the options available to decision-makers (rows), external factors or competitor moves (columns), and numerical or qualitative payoffs estimated in each cell.
Here’s the breakdown:
A player in a payoff matrix is an individual, company, or entity making a strategic decision. One decision-maker can be involved (if analyzing internal scenarios) or multiple players (if considering competitor actions).
In game theory, these players are often called ‘agents’ or ‘competitors’ for strategic interactions.
The assumption that players are rational is central to game theory: each player is assumed to choose her strategy rationally, taking account of her knowledge or beliefs about the other players’ behavior.
A payoff matrix strategy represents a player’s (or decision-maker’s) choices. Each row corresponds to the possible strategy of one player, while each column corresponds to the strategies of another player or an external factor.
The table enables decision-makers to compare outcomes and identify the optimal strategy.
Each cell in the payoff matrix contains a payoff—a numerical or qualitative representation of the strategy combinations’ result. Payoffs can be measured in:
For example, in a cost-benefit analysis, a company and its competitor may both decide to lower their prices. This could help them maintain market share but may also lead to a decline in profit.
🎲 Fun Fact: Game theory was first formally developed by a mathematician who hated games. The foundations of game theory were laid by John von Neumann, who co-authored “Theory of Games and Economic Behavior” in 1944 with economist Oskar Morgenstern.
The irony? Despite pioneering the mathematical framework for analyzing games and strategies, von Neumann is said to have had little interest in actual recreational games like chess or poker.
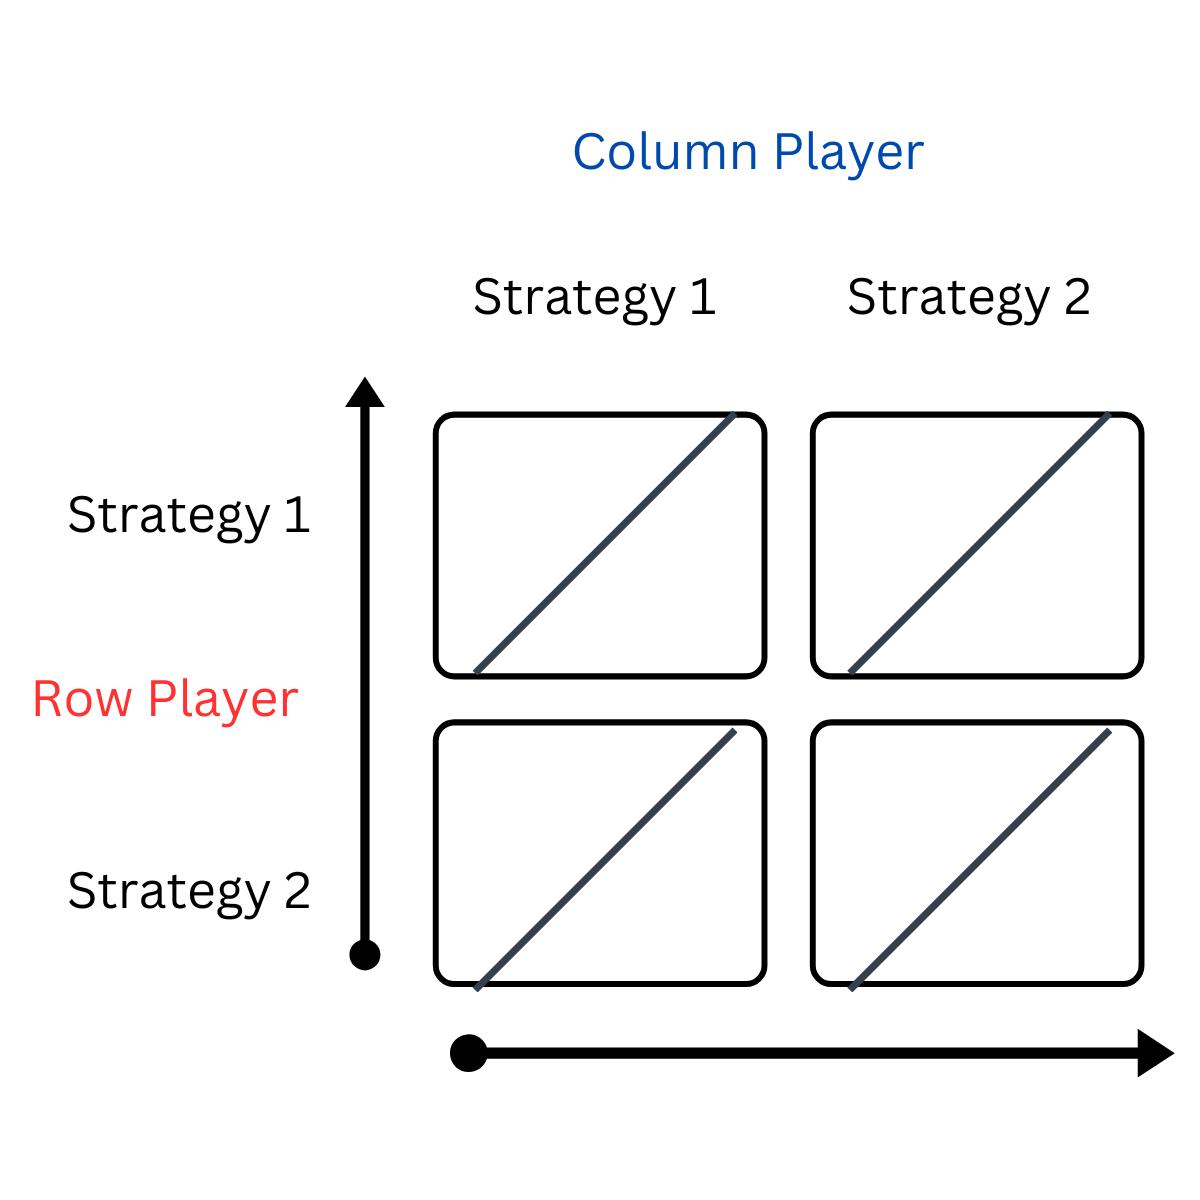
Whether setting prices, launching a product, or negotiating a deal, a payoff matrix analysis is a suitable comparison chart template for strategic decision-making.
In the matrix:
The row player’s payoff is usually written first, followed by the column player’s.
Here’s what this grid can look like:
Let’s understand its mechanism with an example of a payoff matrix for internal decision-making.
Suppose we have two department heads, marketing and product development, who want to decide how to allocate their annual budget. If marketing gets a bigger budget but product development is underfunded, the company might attract customers to an inferior product, leading to bad reviews and lost trust. So, they need to work in harmony.
Each department can invest in branding or R&D. However, these choices will determine their overall success. Let’s complete the previous matrix example with this hypothetical situation:
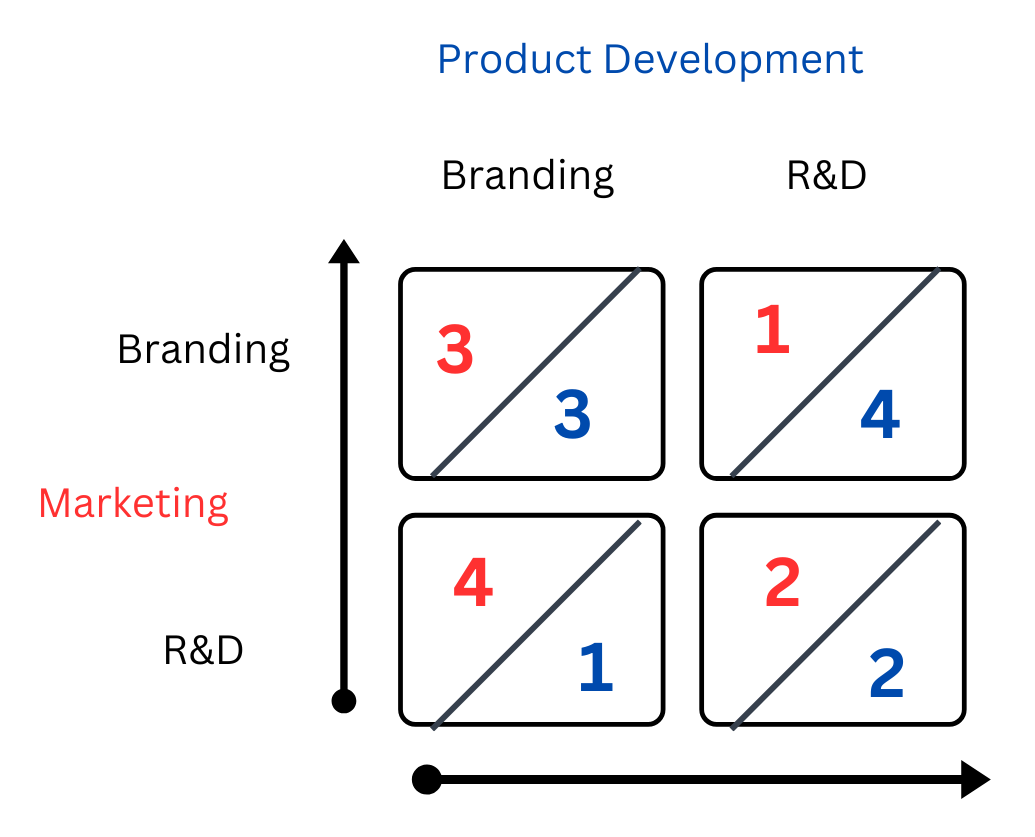
The numbers in the payoff matrix represent the business impact scores—higher numbers mean better outcomes, and lower numbers mean weaker outcomes.
Let’s break it down.
| Teams | Decision | Outcome |
| Marketing (3) and Product (3) | Both invest in branding! | Both departments focus on building a strong brand presence, thus creating a recognizable and well-positioned company in the market. However, since neither prioritizes innovation, the product may lack differentiation or new features, making long-term growth harder. Hence, brand awareness is strong, but innovation is stagnant. |
| Marketing (1) and Product (4) | Marketing chooses branding, and the product development department chooses R&D! | Marketing focuses on branding but lacks an innovative product to promote. As a result, the brand can feel outdated or struggle to keep up with competitors, leading to poor market performance. Product development prioritizes R&D, creating a strong, innovative product. Even with weak branding, customers may still be drawn to it based on its superior quality or features. Hence, the company has a great product but struggles to market it effectively. |
| Marketing (4) and Product (1) | Marketing opts for R&D, and product development departments decide to invest in branding. | Marketing chooses to understand customer needs and optimize promotional strategies. So, the company’s strong marketing engine makes the brand widely recognized and appealing. Product development, however, focuses on branding rather than improving the product. Over time, customers may realize that the product lacks innovation despite strong promotion. Hence, the company has great marketing but a weak product. |
| Marketing (2) and Product (2) | Both invest in R&D! | This company can have a well-developed, innovative product, but customer awareness and market presence might suffer due to the lack of focus on branding and marketing. Hence, the company grows steadily but lacks immediate impact. |
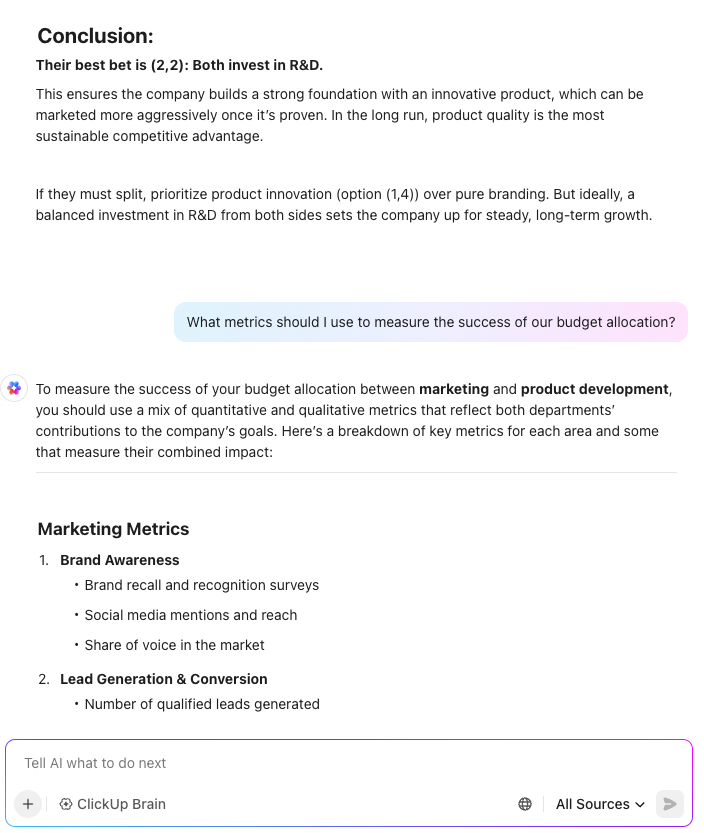
❗️Which option is their best bet, in your opinion?
Ultimately, the best decision depends on the company’s goals, industry dynamics, and competitive landscape. For example, New startups might lean more on branding to create awareness first, Tech-driven businesses can opt for a higher R&D budget to ensure product differentiation, and established companies can balance both to maintain long-term success.
How about bringing in AI for assistance here? Here’s how ClickUp Brain, ClickUp’s built-in AI assistant, responded to the query
You can make an effective decision by mapping how one player’s strategy affects the other and what each possible combination results in. Here are five more ways a payoff matrix can help you:
👀 Did You Know? A Gartner study predicts 65% of organizations will shift from an intuition-based model to data-driven decision-making.
Insights generated in a payoff matrix can have long-term benefits for your business objectives. By analyzing potential outcomes, they can refine strategies and outperform competitors.
ClickUp, the everything app for work, combines project management, knowledge management, and chat—all powered by AI that helps you work faster and smarter. The platform can also be your trusted partner for building, enhancing, and enforcing a payoff matrix.
Let’s break it down into key steps:
Before constructing a payoff matrix, it’s essential to clearly define the decision problem and identify the key decision-makers involved. Consider these questions:
Once you know the problem, jot down those involved in the decision-making process and the strategic choices available to each. It’ll ensure you don’t overlook key external factors or gather incomplete information.
Documenting complete information will capture relevant data for defining possible scenarios later. Use a collaborative space like ClickUp Docs to centralize your decision matrices, update them in real time, and integrate insights from different departments.

With ClickUp Docs, you can:
➡️ Also Read: Free Ansoff Matrix Templates for Channeling Growth
Once you’ve identified the decision-makers and their strategies, build the payoff matrix using:
Constructing the payoff matrix can seem a tad complex since it involves mapping mixed strategies, potential interactions, and expected outcomes. To make it easier, leverage ClickUp Whiteboards!
It provides a visual, collaborative space where teams can design, refine, and analyze their payoff matrices in real time.

Here’s what you can do in ClickUp Whiteboards:
💡 Pro Tip: Temporarily fill in the payoffs from the competitor’s perspective as if you were making decisions instead of them. This reveals blind spots and assumptions that may be skewing your analysis.
Numerical payoff values represent the potential impact of each decision, whether in terms of revenue, market share, customer satisfaction, or another key metric.
To ensure your matrix is data-driven, rely on:
Quantify potential outcomes and ensure that solid data, rather than assumptions, support strategic decisions.
ClickUp Dashboards is a highly reliable tool for real-time data collection and visual reporting. Instead of manually piecing together reports, teams can use them to track historical trends, compare different outcomes, and identify the best response.
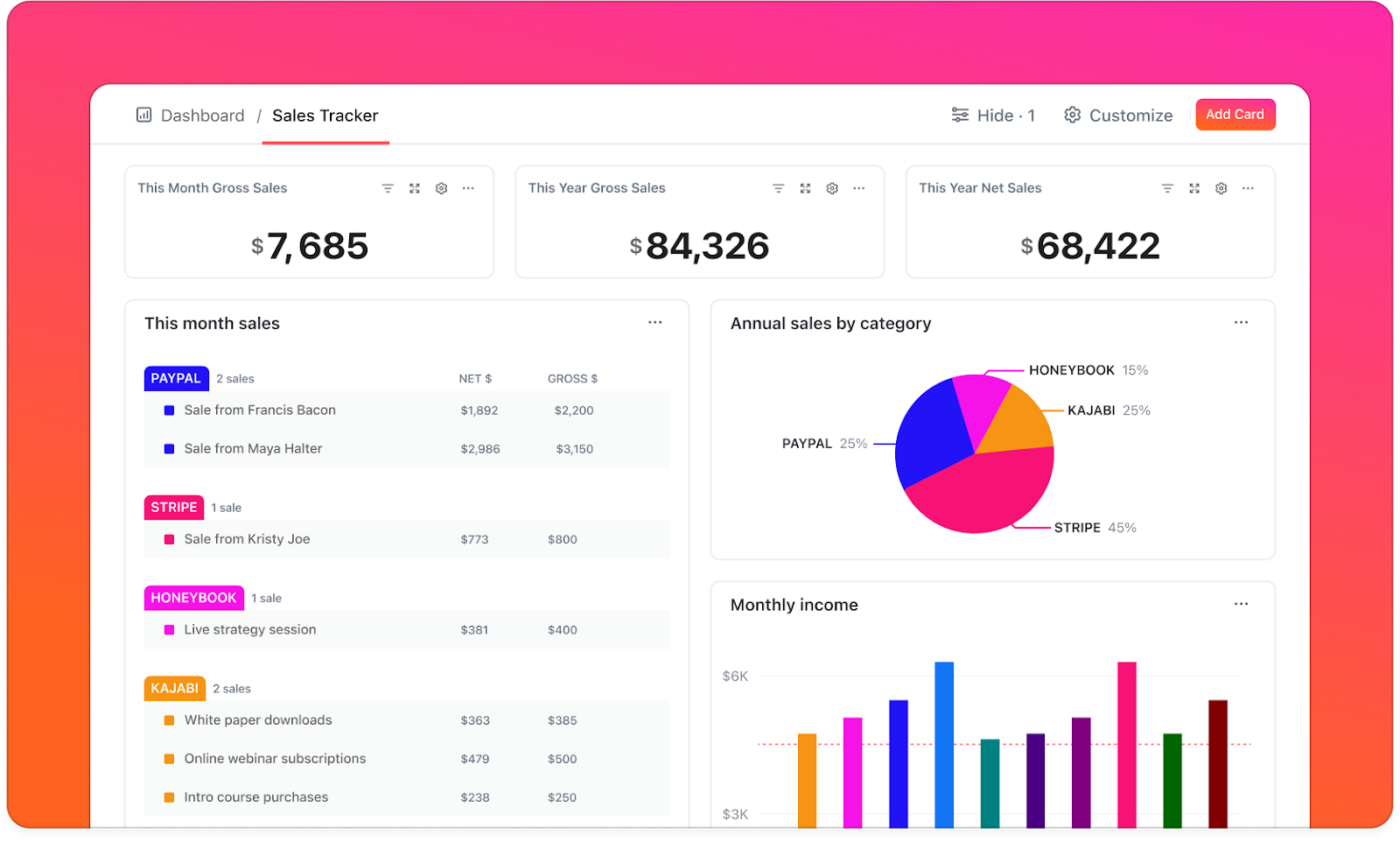
ClickUp Dashboards and reporting tools can help you:
To stay ahead of the curve, conduct a competitive analysis and refine your strategy to maximize payoffs.
To craft a strategic roadmap, pinpoint dominant strategies (the best moves regardless of competitor actions), analyze the Nash equilibrium (where no player gains by unilaterally changing strategy), and weigh risk-reward trade-offs.
Here’s a trick: Use ClickUp Automations to simplify and speed up this process.
With it, you can:
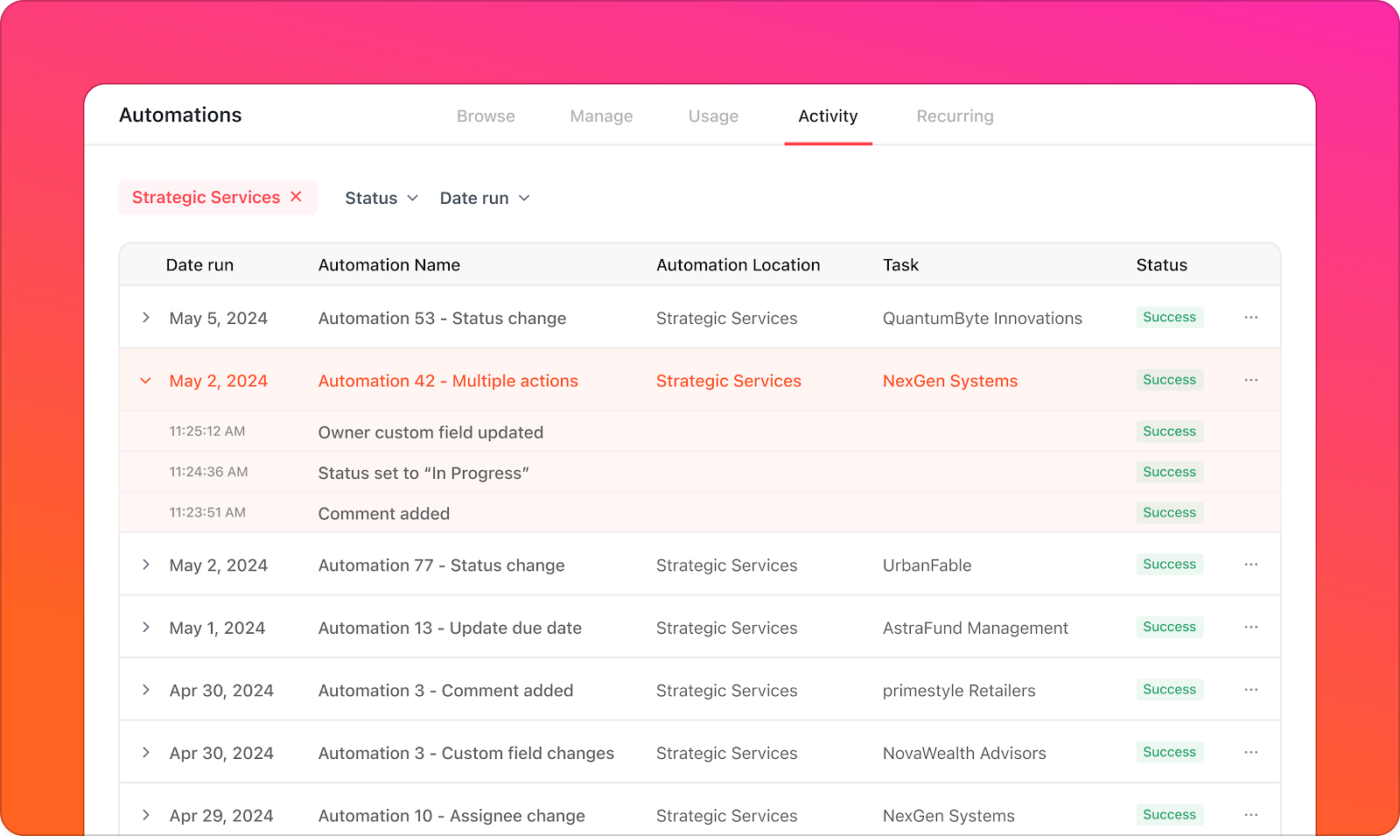
ClickUp Automations takes the manual work out of competitive analysis by automating data collection, notifications, and workflow adjustments. You can focus on analyzing insights and making strategic decisions rather than getting bogged down by repetitive tasks.
👀 Did You Know: 80% of executives think automation is compatible with every business decision.
We agree that creating a payoff matrix from scratch sounds exhausting! Want something simpler? Use ClickUp decision-making templates. Pick a template and start organizing and updating your data to plan your strategic interactions.
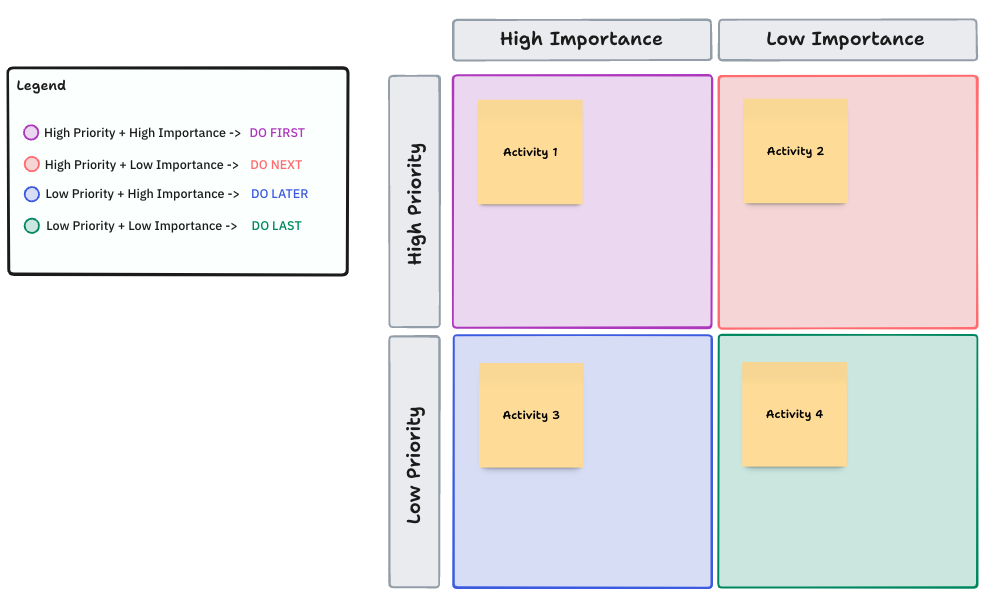
For example, the ClickUp Priority Matrix Template prioritizes tasks based on their urgency (how quickly they need to be completed) and their impact on key goals or outcomes.
Visually arrange your workload in grids or predefined categories to map out tasks based on importance and deadlines. It improves team collaboration, enhances productivity, and ensures the focus remains on what drives results.
With this template, you can:
ClickUp has made asynchronous alignment much simpler and more effective. By building a framework in which to outline and structure objectives and results, remote teams are able to understand expectations and provide status updates fluidly. Brainstorming with whiteboards is easy, reorganizing priorities is easy, and adding reference images, etc., is all very fluid
Now that you know how to create a payoff matrix, let’s look at a few examples of where and how to use them.
A startup faces a choice: launch now with a bare-bones product or wait to perfect it.
A payoff matrix helps map the trade-offs. An early launch means user feedback and a first-mover advantage, but risks a shaky reputation.
The sweet spot? A phased rollout: test with a small group, tweak, then go big.
Budget-conscious executives often hesitate to greenlight high-risk, high-reward projects, such as a B2B SaaS company debating an AI-powered analytics tool.
A payoff matrix helps product managers turn gut-feel debates into data-driven discussions by quantifying risks, rewards, and probabilities.
The takeaway? While pricey upfront, the tool’s impact on customer retention could make the investment a smart bet.
📮ClickUp Insight: 92% of knowledge workers risk losing important decisions scattered across chat, email, and spreadsheets. Without a unified system for capturing and tracking decisions, critical business insights get lost in the digital noise.
With ClickUp’s Task Management capabilities, you never have to worry about this. Create tasks from chat, task comments, docs, and emails with a single click!
Uncertain regulations can make long-term planning a headache—just ask a digital health startup navigating new data privacy laws.
A payoff matrix helps the team map out possible scenarios, gauge their likelihood, and plan accordingly. They may need to pivot if strict rules kick in, but proactive prep beats last-minute scrambling.
Their analysis might show that investing in compliance-ready infrastructure now saves a costly rework later.
➡️ Also Read: Free Competitive Analysis Templates for Google Sheets
Before implementing a payoff matrix analysis, familiarize yourself with its limitations and potential solutions to enhance the results.
A payoff matrix shines in two-player decision-making but struggles with the messy reality of multiple competitors, shifting markets, and unpredictable variables.
That’s where ClickUp Advanced Filtering comes in—it expands your matrix’s reach, letting you segment data and explore strategic angles without drowning in complexity.
A payoff matrix assumes all outcomes and probabilities are known, but reality loves surprises. Regulatory shifts, supply chain hiccups, and market swings can throw a wrench into even the best plans.
Businesses can model future scenarios and factor in uncertainties instead of relying on a static set of outcomes. Sensitivity analysis further strengthens decision-making by revealing which strategies hold up best under changing conditions.
A payoff matrix isn’t a set-it-and-forget-it tool—it needs ongoing updates to stay useful. What works today might flop tomorrow. ClickUp Dashboards keep teams ahead of the curve by providing a real-time view of key metrics, helping them tweak their payoff matrix as market conditions shift.
Customizable reports reveal trends, show how variables impact payoffs, and refine strategic decisions. With automated updates, businesses can stay proactive instead of playing catch-up.
A payoff matrix structures possible outcomes, assigns probabilities, and evaluates the potential payoff for each player, helping you make informed decisions that align with long-term business goals instead of relying on guesswork.
But a static matrix alone won’t cut it—real-time data, collaboration, and ongoing analysis are key to making it truly effective.
This is where ClickUp shines. With dynamic visual dashboards, robust reporting tools, and powerful automation, ClickUp empowers teams to easily create, refine, and optimize their payoff matrices.
Sign up for ClickUp for free and start making smarter, data-driven decisions today.

© 2026 ClickUp

There’s an easier way. Try a free AI Agent in ClickUp that actually does the work for you—set up in minutes, save hours every week.