


Still downloading templates?
There’s an easier way. Try a free AI Agent in ClickUp that actually does the work for you—set up in minutes, save hours every week.
Sorry, there were no results found for “”
Sorry, there were no results found for “”
Sorry, there were no results found for “”

For most businesses, data lives in good old spreadsheets.
It could be sales figures, customer lists, budget forecasts, inventory counts, the list is endless. But if you’ve ever stared at a 100-column Excel file trying to answer a simple question, you know how difficult analysis gets.
Understanding pivot tables, complex formulas, and nested functions requires technical expertise that most people don’t have.
Claude, an AI model by Anthropic, changes that. This natural language interface lets you analyze spreadsheet data through conversation, making analysis accessible for everyone.
Ahead, we show you how to use Claude for spreadsheet analysis with practical examples and prompting patterns. We’ll also show how you can make your Claude analysis durable and iterative so your team can build on it.
Spreadsheet analysis is a systematic process of examining spreadsheet data (both qualitative and quantitative) to unravel hidden patterns and insights. Essentially, it transforms raw data into valuable intelligence to support decision-making and strategic planning.
So what all does it involve? Broadly speaking, everything. It ranges from identifying trends and modeling scenarios to manipulating data, generating visuals, filtering datasets, and performing statistical calculations.
Here’s how different departments analyze spreadsheets to solve their specific business challenges 👇
| Department | Common spreadsheet analysis tasks |
| Finance | Calculating campaign ROI, analyzing lead source performance, tracking customer acquisition costs, comparing the effectiveness of different marketing channels, and measuring engagement metrics |
| Sales | Analyzing pipeline health, tracking conversion rates by stage, comparing performance across territories, and identifying seasonal patterns |
| Marketing | Analyzing turnover patterns, benchmarking compensation data, tracking recruitment funnel metrics, and monitoring employee performance trends |
| HR | Analyzing turnover patterns, benchmarking compensation data, tracking recruitment funnel metrics, monitoring employee performance trends |
| Operations | Analyzing inventory turnover, tracking supply chain delays, measuring production efficiency, monitoring quality control data, optimizing resource allocation |
| Product | Tracking feature adoption rates, categorizing customer feedback, analyzing pricing sensitivity, measuring user engagement patterns, and identifying churn indicators |
If you’re learning how to use Claude for spreadsheet analysis, the first thing to understand is this:
Claude doesn’t replace Microsoft Excel. It makes spreadsheet analysis conversational. Instead of building complex formulas or debugging pivot tables, you can ask natural language questions about your dataset and receive structured explanations in return.
Claude’s analytical capabilities let you read your spreadsheet structure, sample the data, perform statistical analysis, generate visualizations, and summarize findings in seconds.
Here are different aspects where Claude assists in spreadsheet analysis:
🧠 Fun Fact: Claude is named after Claude Shannon, the pioneer of information theory, who defined how data is measured and transmitted. Appropriately, Claude AI excels at processing vast amounts of spreadsheet data and extracting meaningful patterns—a digital tribute to Shannon’s legacy of making information actionable.
Here’s how you use Claude for analyzing spreadsheets:
Upload your Excel file to Claude chat. But before that, run a few checks on data quality and file structure for accurate data analysis.
Here’s what you should verify before uploading:
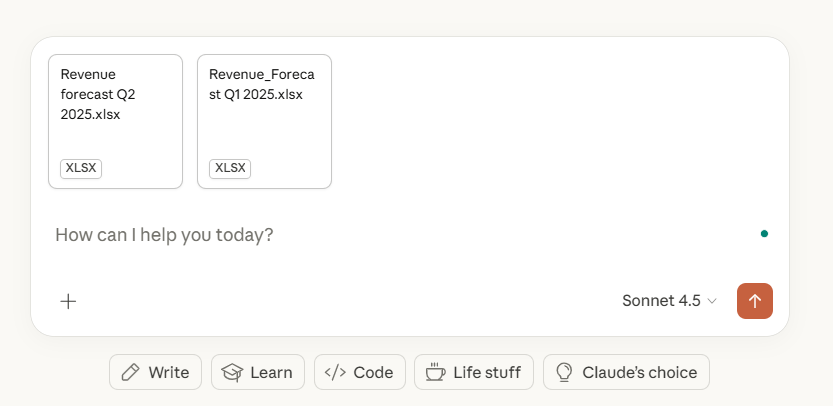
Click the plus icon, then select your XLSX file from your device. If you are comparing two or more sheets, make sure to name the files properly to avoid any confusion.
Also, if you’re analyzing the same spreadsheet structure repeatedly (like monthly sales reports or weekly budget updates), set up a Claude Project. This way, you won’t have to re-explain column meanings, business context, or analysis requirements in every conversation.
💡 Pro Tip: Claude also offers built-in connectors to connect apps like HubSpot, Slack, Google Drive, and Salesforce. By connecting Claude to these tools, it can access data from multiple sources directly, saving you the manual effort of exporting and uploading files.
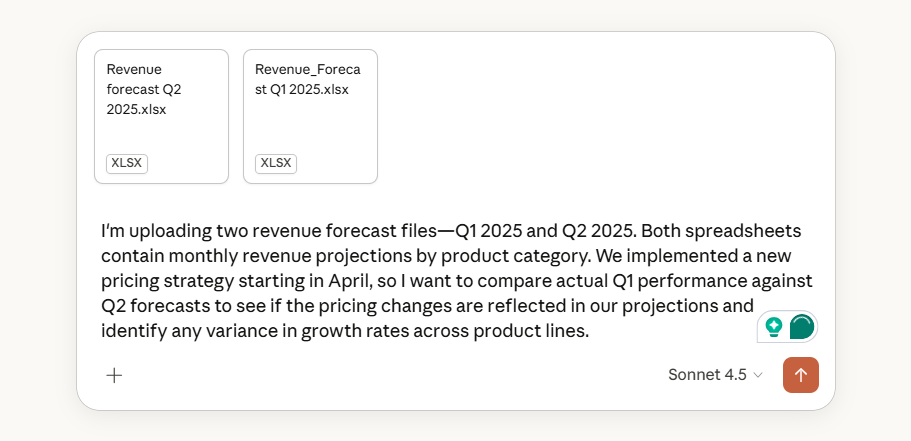
When using Claude for data analysis, always provide an understanding of what the data represents and what you’re trying to learn from the analysis. Context helps Claude interpret ambiguous values and prioritize relevant insights to your specific situation.
Share details like:
Example of context:
Use Claude to structure and organize your data by removing inconsistencies, handling missing values, and standardizing formats. Claude can identify data quality issues and provide cleaned versions of your spreadsheet.
Here’s how Claude can clean your datasets:
| Data cleaning task | What does Claude do? |
| Standardize formats | Standardizes names, i.e., Trenbee, TrenBee, Tren Bee → TrenBee Ltd Converts inconsistent date formats, i.e., 3/15/24, March 15 2024, 15-03-2024 → 2024-03-15 Removes currency symbols from numbers, i.e., $1,250.50 → 1250.50 |
| Handle missing values | Identifies blank cells and their locations Fills gaps using methods you specify (averages, previous values, or placeholder text) |
| Removes duplicates | Detects identical or near-identical entries based on criteria you specify Keeps the most recent or complete record Provides a summary of removed entries |
| Filter relevant data | Isolates specific time periods, regions, or categories for analysis Removes test entries or outliers that skew results Creates subsets for focused comparison |
Example prompt:
“Standardize all date formats to YYYY-MM-DD, remove dollar signs from the Revenue column, fill missing values in the Region field with ‘Unknown’, and filter data to show only transactions from Q1 2025.”
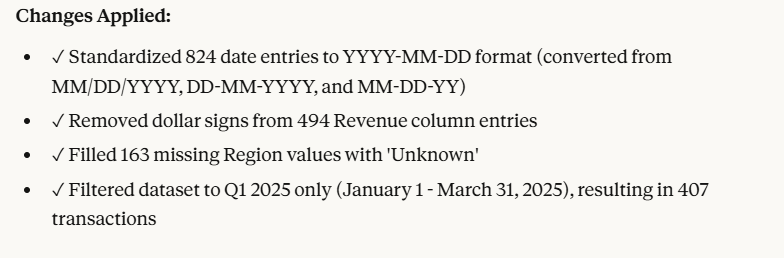
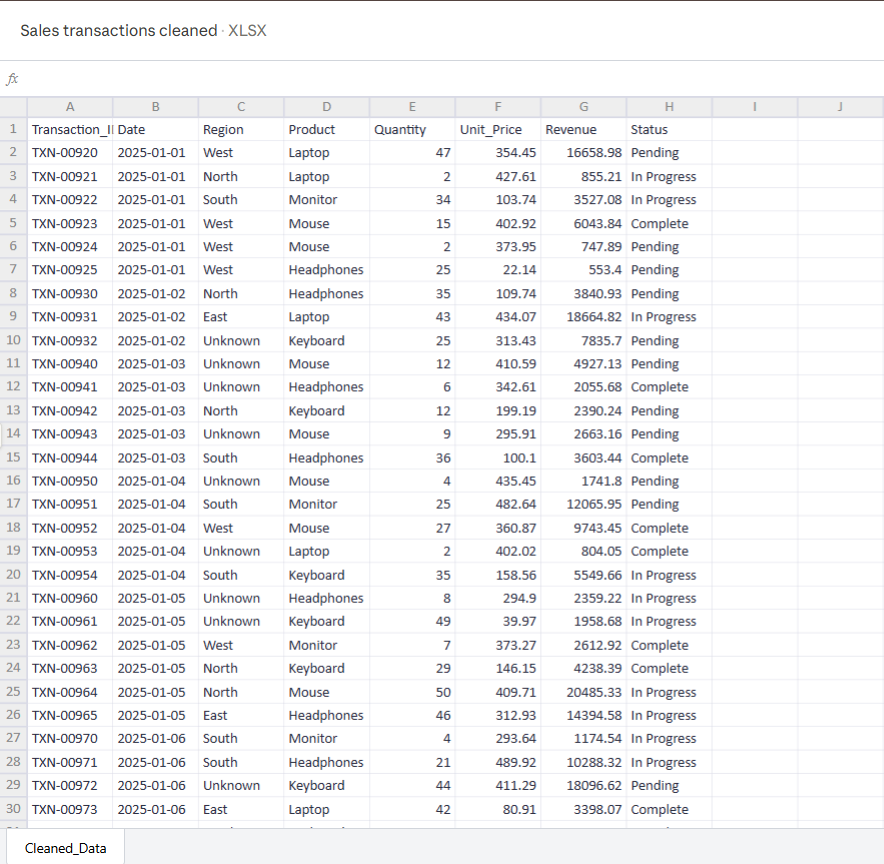
What Claude produces:
💡 Pro Tip: If you want Claude to debug formula mistakes and trace calculation errors, use Claude in Excel to work directly within your workbook without uploading files back and forth. This Claude add-in is an intelligent sidebar agent that identifies root causes of errors such as #REF!, #VALUE!, and circular references.
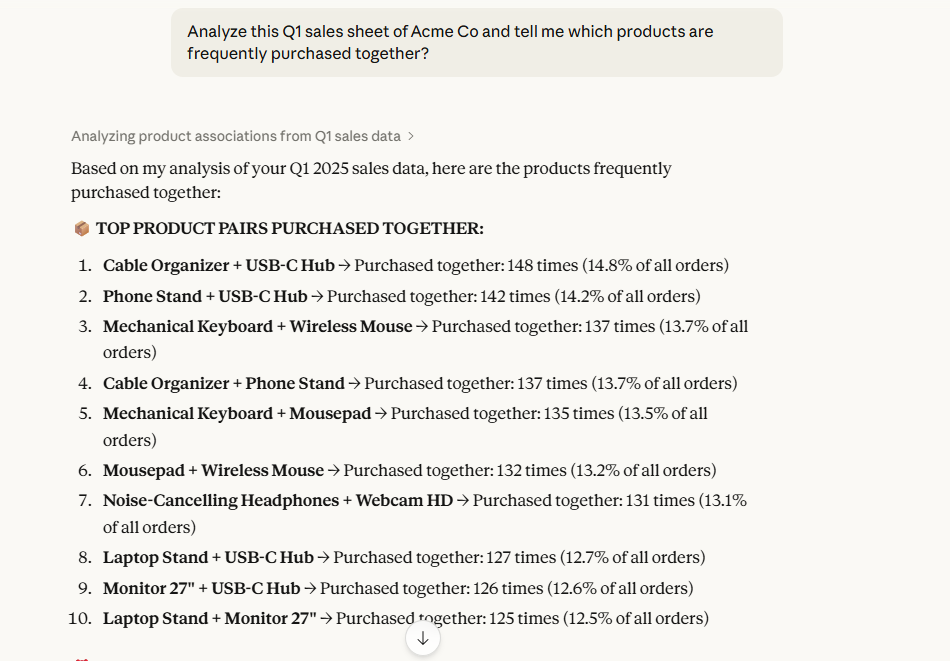
Claude’s natural language prompting lets you ask questions about specific cells, formulas, or entire sections of your workbook. It can navigate across multiple tabs and provides answers with direct citations to referenced cells.
Simply ask questions about your Spreadsheet data, and it will surface answers with necessary explanations:
Break down complex analysis into smaller Claude prompts. Reference Claude’s earlier findings to dig deeper.
Example: You mentioned sales dropped in March, can you break that down by product category?” or “Show me if that trend appears in other regions too.”
When analyzing multiple spreadsheets at once, reference the specific file in your prompt.
For instance,
The idea is to build your analysis slowly. Tweak and approve with each step to keep your analysis focused.
👀 Did You Know? The ability to use and manage AI tools has grown sevenfold in job postings over just two years—faster than any other skill requirement. Work is rapidly evolving into a partnership between people, AI agents, and automation, with spreadsheet analysis being one of the first workflows to transform.
Specify exactly the format for your analysis so Claude delivers work-ready outputs without requiring reformatting.
Claude can create multiple coordinated outputs in one conversation. Ask for an analyzed Excel file paired with a Word document summary, or a data visualization saved as PNG alongside the underlying calculations in CSV format.
For instance:
Example prompt:
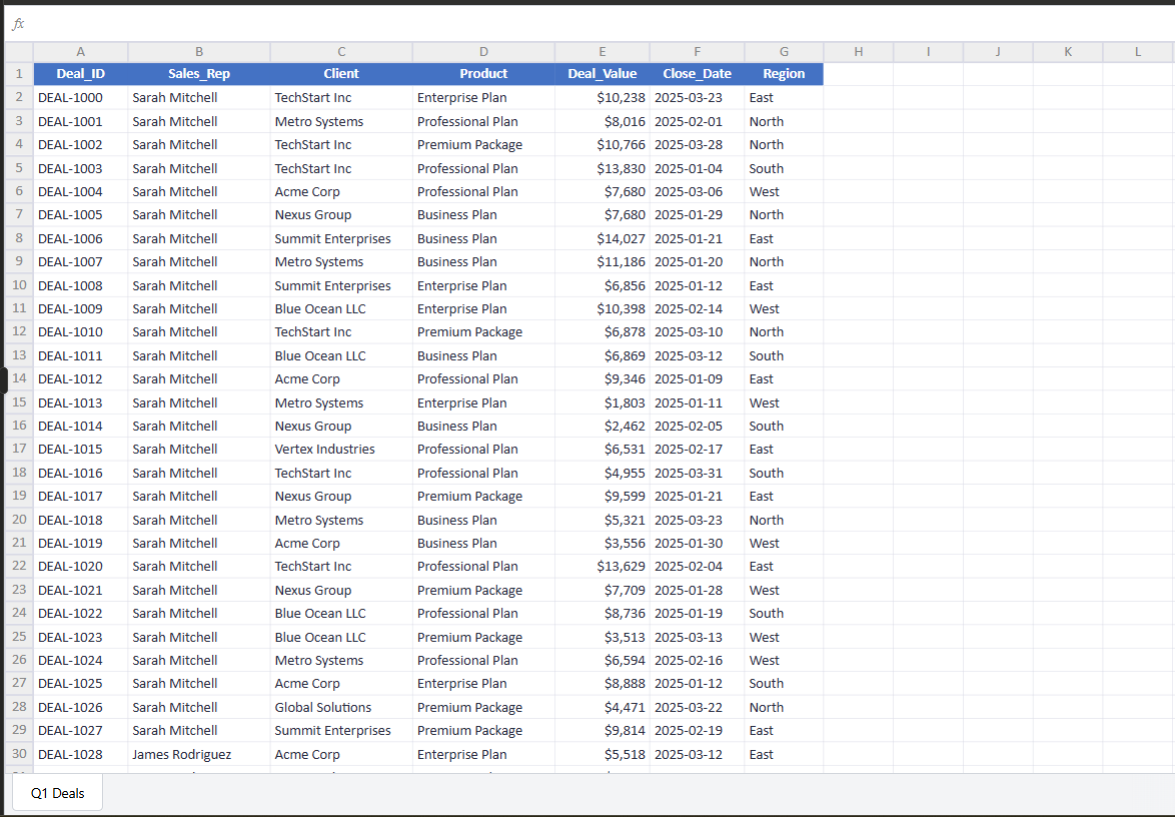
“Analyze the Sales_Q1_2025 file and calculate the average deal size by sales rep. Create an Excel file with the calculations, generate a bar chart comparing performance, and write a 3-paragraph summary identifying the top performer and any reps who need support.”
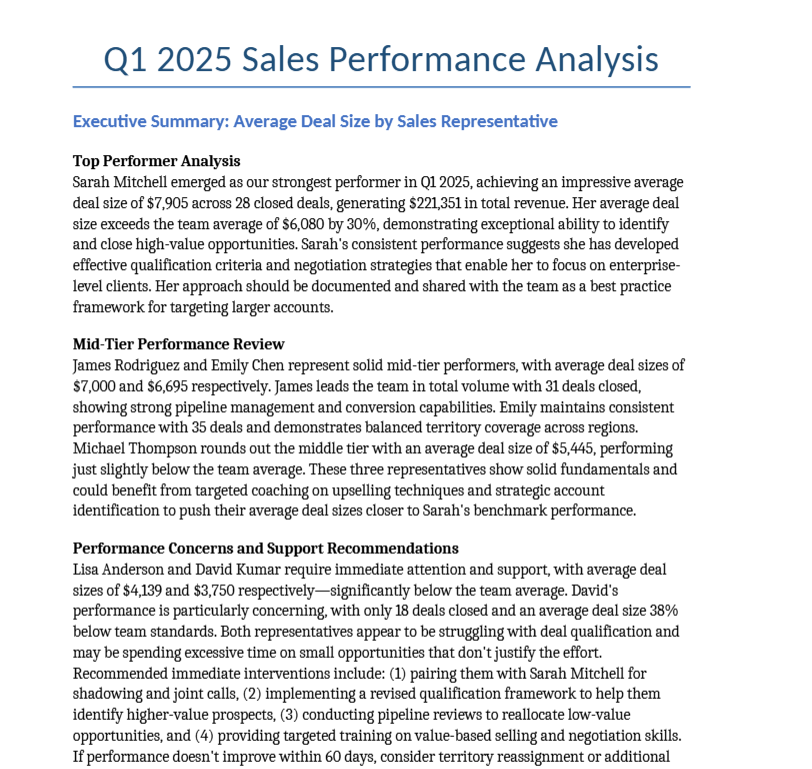
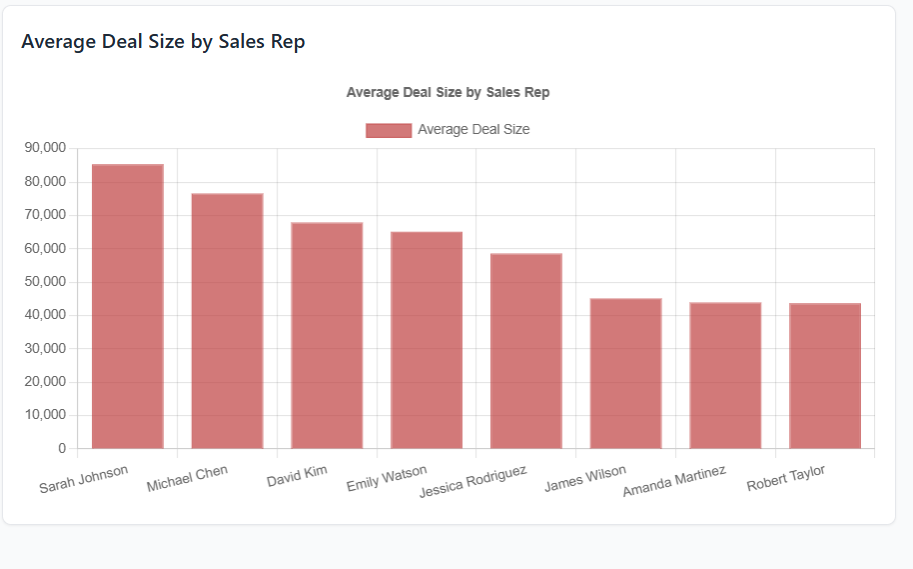
Claude provides download links for all generated files:
Click the download button below each output to save files locally.
📮 ClickUp Insight: 62% of our respondents rely on conversational AI tools like ChatGPT and Claude. Their familiar chatbot interface and versatile abilities—to generate content, analyze data, and more—could be why they’re so popular across diverse roles and industries.
However, if a user has to switch to another tab to ask the AI a question every time, the associated toggle tax and context-switching costs add up over time.
Not with ClickUp Brain, though. It lives right in your Workspace, knows what you’re working on, can understand plain text prompts, and gives you answers that are highly relevant to your tasks! Experience 2x improvement in productivity with ClickUp!
📚 Read More: An Honest Review of Claude Agentic AI
Structuring your prompts with clear parameters helps Claude deliver precise analysis that aligns with your objectives.
Let’s show you some successful prompting patterns for common spreadsheet analysis tasks:
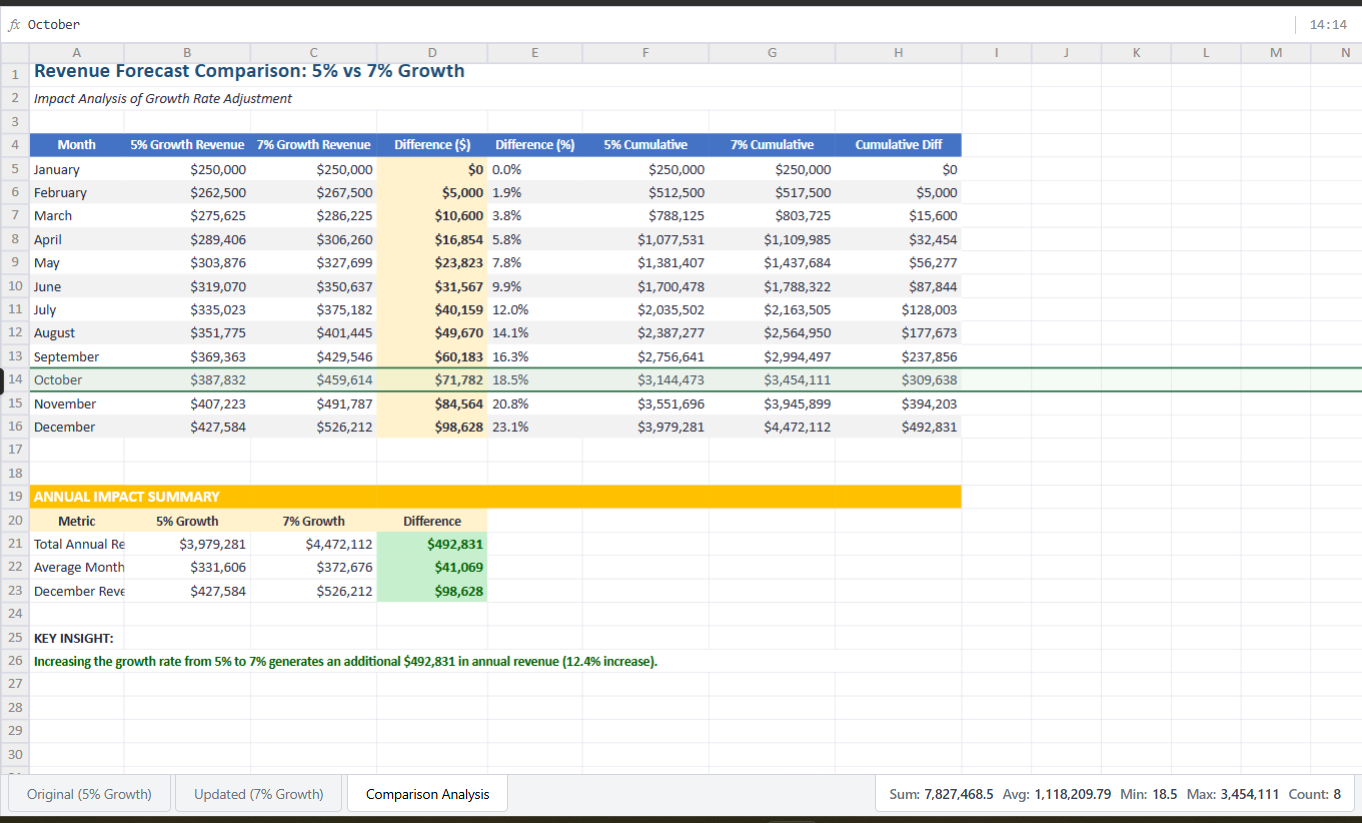
When you need Claude to adjust existing spreadsheet data based on new variables or scenarios, provide clear instructions about what changes to make and how they affect related calculations.
Here’s the prompting pattern to follow:
🤖 Example prompt: Take the Revenue_Forecast.xlsx file and increase the monthly growth rate assumption from 5% to 7%. Recalculate projected revenue for all months in the forecast table and create a new Excel file showing before/after comparison in separate tabs.
📚 Read More: Best Claude Enterprise Use Cases and Examples
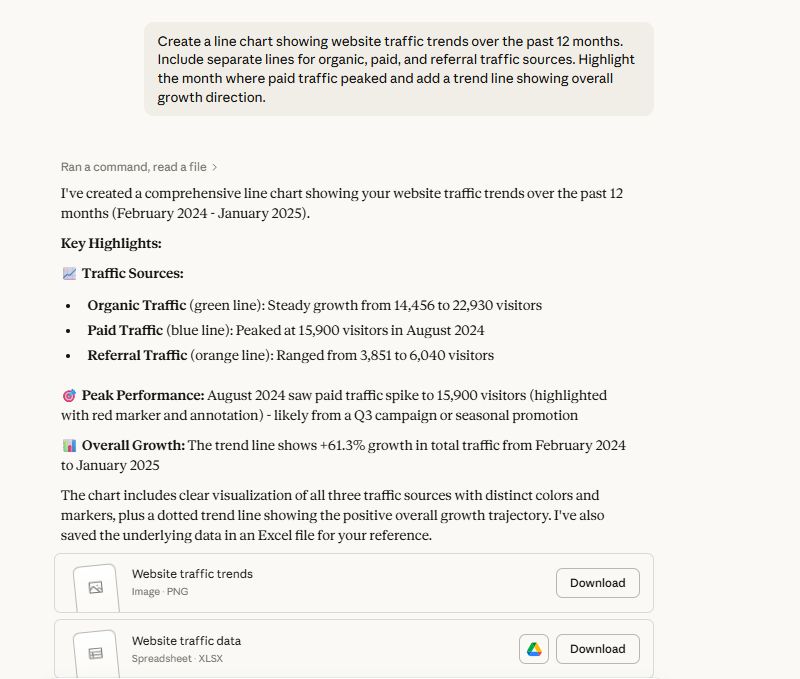
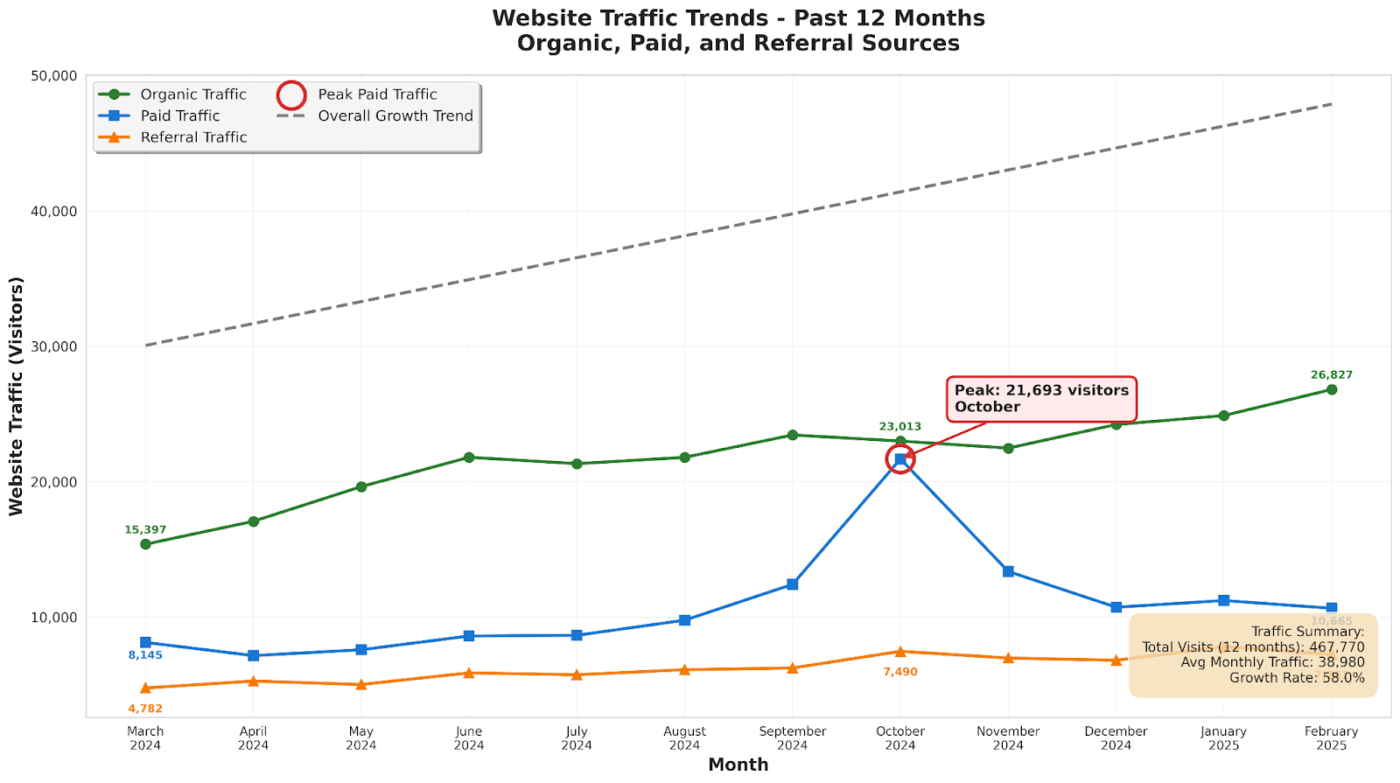
When you want charts that reveal patterns in your data, specify what comparison or trend you’re trying to show, not just the chart type.
Here’s the prompting pattern to follow:
🤖 Example prompt: Create a line chart showing website traffic trends over the past 12 months. Include separate lines for organic, paid, and referral traffic sources. Highlight the month where paid traffic peaked and add a trend line showing overall growth direction.
⚡ Template Archive: Free Spreadsheet Templates in Excel & ClickUp
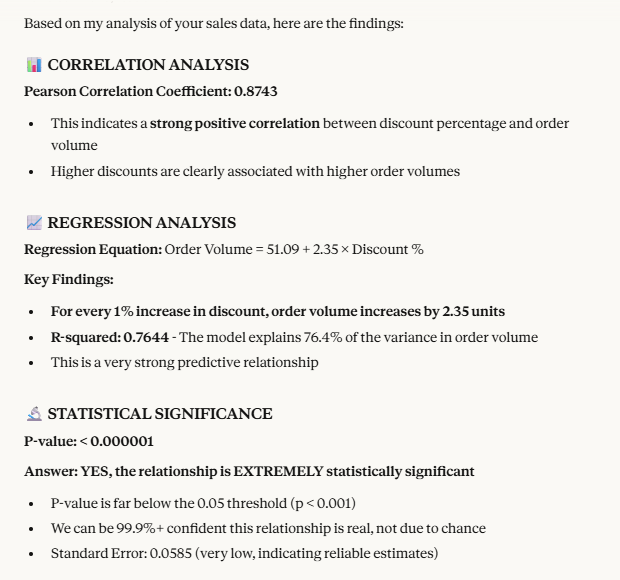
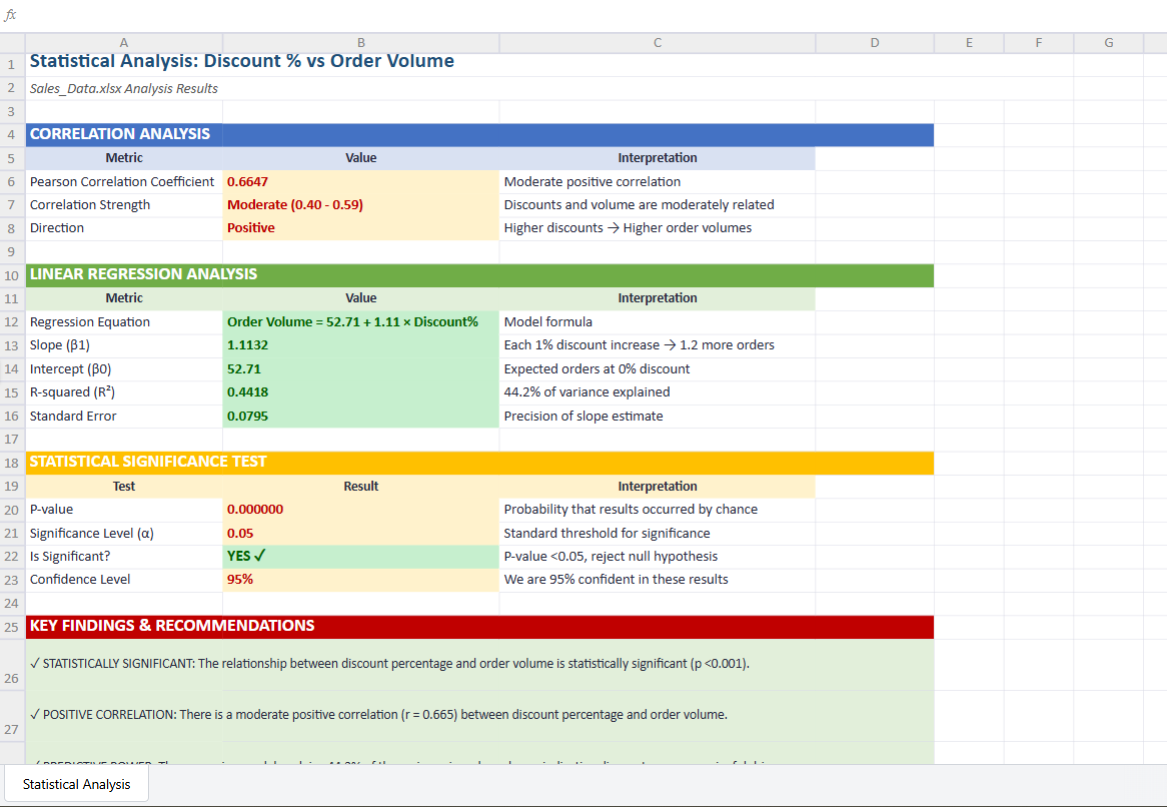
Claude can perform complex data science tasks, including correlation analysis, predictive modeling, and A/B test evaluation, without requiring specialized statistical software or coding knowledge.
Here’s the prompting pattern to follow:
🤖 Example prompt: Analyze the Sales_Data.xlsx file and calculate the correlation between discount percentage and order volume. Run a regression analysis to determine whether higher discounts drive more sales, and tell me whether the relationship is statistically significant.
📚 Read More: Amazon Q Vs. Claude: Which Enterprise AI is Better?
When you need to restrict what users can enter into specific cells, explain the acceptable values and any conditional rules that should apply.
Here’s the prompting pattern to follow:
🤖 Example prompt: Create an Excel file with a Status column that only accepts “Open,” “Closed,” or “Pending” from a dropdown menu. Show an error message if someone tries to type anything else.
Claude can create fully functional spreadsheets from scratch using Microsoft Excel formulas—you don’t need to know formula syntax or cell references; just describe the calculations you need.
Here’s the prompting pattern to follow:
🤖 Example prompt: Create an Excel file for calculating employee commissions. Include columns for Sales Amount, Commission Rate, and Commission Earned (Sales Amount × Commission Rate). Add a bonus column that gives an extra 5% if sales exceed $10,000. Calculate total commissions at the bottom using a SUM formula.
💡 Pro Tip: Instead of uploading files to Claude, use Claude in Excel’s desktop integration. It lets you work directly within your Excel workbooks without an API key.
With Claude in Excel, you can:
If you want to edit existing Excel file formulas and structure, debug formula errors, or apply conditional formatting to open files, Claude in Excel provides a full Excel editing experience without the upload-download workflow.
If spreadsheet analysis and modeling are something new to you, here are some beginner-friendly practices for interpreting Claude’s insights:
👀 Did You Know? According to Google’s AI Works research, AI habits are surprisingly easy to form—just a few hours of training doubled daily AI usage among employees, with adoption remaining high even months after the pilots because AI-powered tools are rewarding and easy to use.
Here are a few mistakes to avoid when using Claude for Spreadsheet analysis and what to do instead:
| ❌ Mistake | ✅ What to do instead |
| Ignoring data quality issues | Ensure your data is accurate, current, represents an unbiased state, and follows a structured format—clean out wrong formulas, corrupted entries, and inconsistencies before uploading |
| Not prompting specifically | Instead of generic prompts like “Highlight top 3 insights from this spreadsheet,” ask “Calculate month-over-month growth rates and create a bar chart comparing Q1 vs Q2 performance” |
| Ignoring context window limits | Claude can analyze up to 20,000 rows efficiently, but in longer conversations, it may lose track of earlier context—reiterate important details, constraints, or findings as the conversation progresses |
| Uploading sensitive data | Edit or remove personally identifiable information like names, emails, SSNs, and financial account numbers that could cause security or privacy issues |
| Using Claude to debug formula errors | Claude can’t trace underlying formulas or dependencies in your spreadsheets—provide the formula text or describe the calculation logic so Claude can identify the issue |
| Messy file uploads | Structure your data with clear column headers and consistent formatting |
| Accepting the first answer without iteration | Don’t treat Claude’s initial response as final—ask follow-up questions, challenge assumptions, request alternative approaches, and build deeper analysis through conversation |
| Not leveraging automation | For repetitive analysis tasks, use your Claude API key to build an automated Excel workflow instead of manually uploading the same file types repeatedly |
Claude simplifies analysis with natural language prompting. However, there are limitations to Claude’s analytical capabilities that you should be aware of:
👀 Did You Know? According to OpenAI’s State of Enterprise AI report, enterprises that leverage AI are experiencing measurable productivity gains. Enterprise users report saving 40-60 minutes per day and being able to complete new technical tasks such as data analysis and coding.
Claude transforms raw data into analytical insights to support decision-making. However, without a system to capture or execute those insights, all your analytical work will vanish into thin air.
You need a place where spreadsheet analysis becomes durable, collaborative, and actionable. A place where insights connect with your actual work.
That’s exactly what ClickUp, the everything app for work, offers.
This converged AI workspace connects your projects, documents, data, conversations, and AI intelligence in one place.
Here’s how it works:
ClickUp Table View lets you build visual databases and spreadsheets to track and organize work data without writing code. Here, you can structure information with over 20 ClickUp Custom Fields, i.e., progress bars, file attachments, star ratings, dropdowns, formulas, and AI fields to capture important data types for your analysis.
You can also import spreadsheets directly into your ClickUp workspace, converting Excel or CSV files into Table Views that become living databases connected to your tasks and workflows.
Here’s how Table View supports spreadsheet analysis:
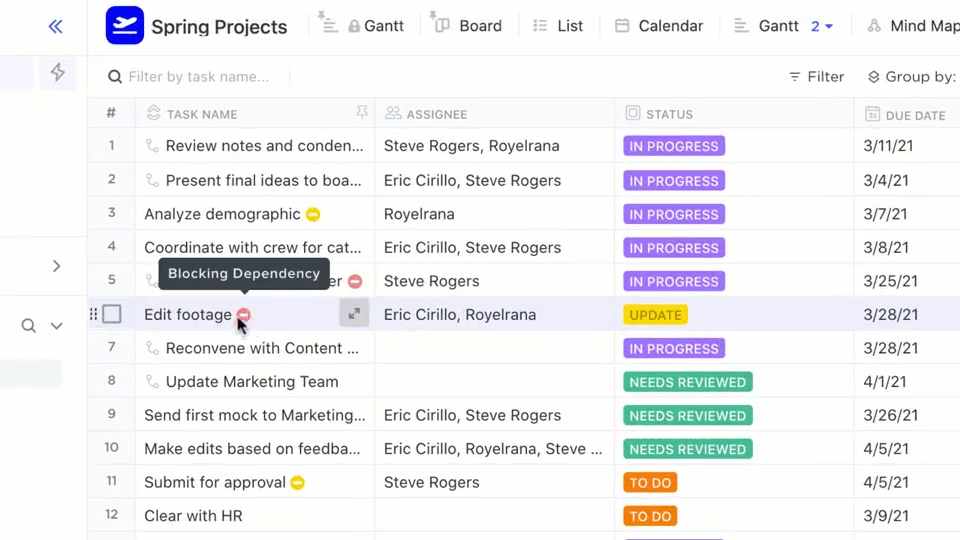
ClickUp Brain operates as a contextual AI layer that knows your workspace structure—List or Table View data, tasks, dependencies, and team ownership.
Brain can reference:
Simply ask: “What’s blocking the Q1 revenue forecast task?” or “Highlight pending tasks from the last 2 weeks on the dropshipping project”.
And the Brain will check all the linked Table View data, capture incomplete conversion rate fields, and identify the task owner holding up progress.
And, because Brain operates within ClickUp’s permission model, it only surfaces information you’re allowed to see.
💡 Pro Tip: Use AI Fields in List View to auto-generate summaries, extract key metrics, or create action items from your spreadsheet data. These custom fields update automatically based on your data without manual work—like summarizing monthly performance or flagging accounts that need attention.
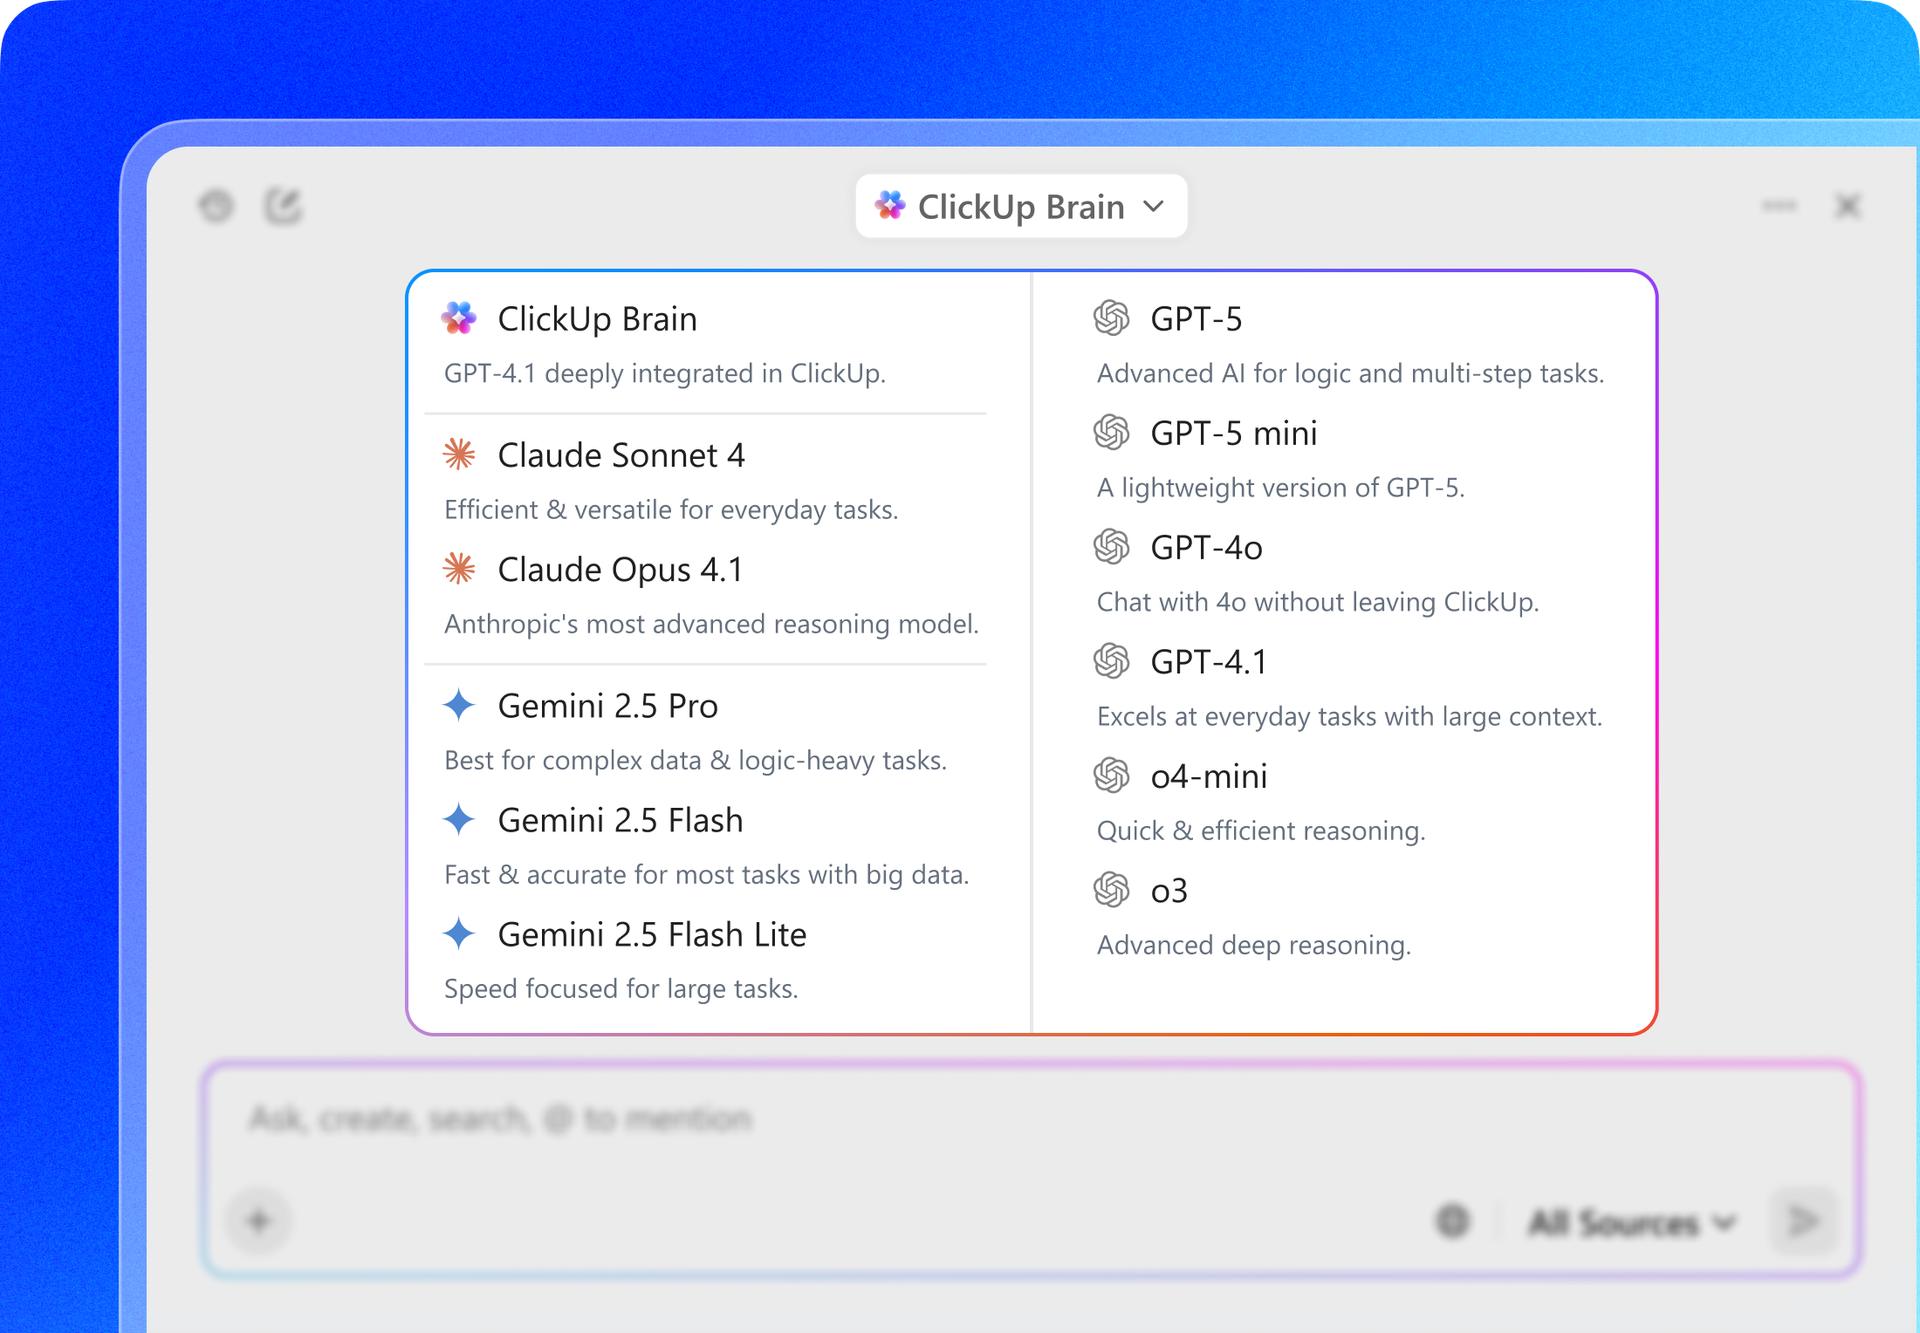
With Brain, you get access to multiple AI models—including Claude Sonnet 4, ChatGPT, and Gemini—directly inside your workspace. No separate subscriptions or logins needed.
Different AI models have different analytical strengths. Here’s when to use which:
Besides, you can search across your workspace and connected systems in natural language with ClickUp’s AI-powered Enterprise Search.
Whether you want to find which file contains budget projections or track down who approved the pricing changes, Brain digs through files, tasks, connected apps, conversations, and the knowledge base to surface the answers.

Example:
There’s no need to paste context, re-explain project structure, or summarize work manually before asking questions. Brain reasons over live workspace data and returns answers that reflect your current execution state.
ClickUp offers a structured place to organize your analytical insights with ClickUp Docs. These searchable and connected Docs help you build institutional knowledge around spreadsheet analysis.
Within Docs, you can structure insights through tables, embedded links, charts, headers, and banners. You can also embed live Table Views that show the data behind your analysis and shape the narrative by collaborating with teammates in real time.

Docs turn your analysis reviewable and iterative. It lets you:
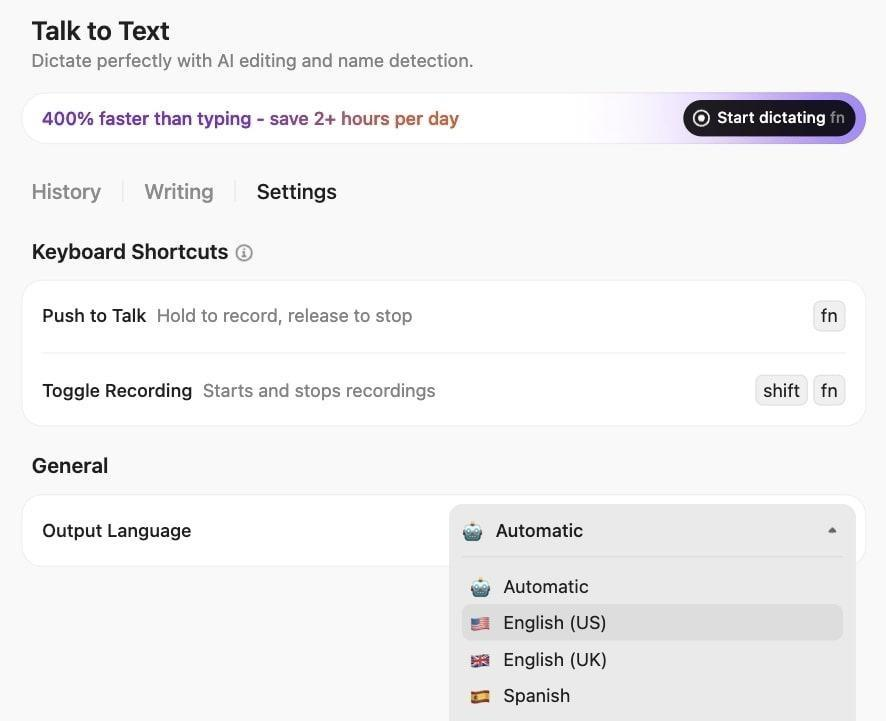
When manually reviewing data in Table View, turn your thoughts into organized documentation without interrupting your analytical flow. ClickUp’s Talk to Text lets you document spreadsheet insights hands-free, capturing and transcribing your observations as you speak.
Super Agents are ambient AI assistants that help you operationalize your analytical insights. These no-code agents run in the background based on specified instructions, catching issues and executing workflows automatically.
These AI agents monitor your workspace, track changes in tasks, timelines, dependencies, and spreadsheet data without waiting for you to prompt them.

📌 Examples of what a Super Agent can do for you:
To see it in action, watch this video on how ClickUp uses Super Agents.👇
Claude is powerful for analysis. But analysis alone doesn’t move work forward.
When insights live in a chat window or a standalone spreadsheet, someone still has to translate them into tasks, assign owners, update timelines, and follow through. That gap between thinking and doing is where momentum gets lost.
ClickUp closes that gap. Inside a Converged AI Workspace, your analysis isn’t floating separately from execution. It connects live projects, task ownership, Docs, conversations, and timelines in one system. The AI doesn’t just generate insights. It understands the context around them.
Instead of running analysis in one place and managing execution in another, you work in a single, connected environment where thinking and doing happen together.
If you’re ready to move beyond isolated AI outputs and into AI-powered execution, start with ClickUp for free.
Yes, Claude analyzes Excel files (.xlsx) and CSV exports from Google Sheets. It can interpret complex formulas, manipulate data, make adjustments, and create new editable spreadsheets.
Claude’s calculations are accurate when working with clean, well-structured data, but you should spot-check critical results, as accuracy depends on data quality and the clarity of your prompts.
Yes, Claude can explain and troubleshoot formulas by breaking them down into plain language. However, it can’t read the embedded formulas in uploaded Excel files. You need to share the formula text separately.
Yes, you can trust Claude’s interpretation of spreadsheets, but with critical, mandatory human oversight. While it holds powerful analytical capabilities, it’s not infallible and can produce hallucinated results. Always cross-check Claude’s interpretations against domain knowledge or multiple data sources.
Use traditional spreadsheets for ongoing work that requires persistent formulas, real-time collaboration, audit trails, or advanced Excel features such as pivot tables and macros that Claude doesn’t fully replicate.

© 2026 ClickUp

There’s an easier way. Try a free AI Agent in ClickUp that actually does the work for you—set up in minutes, save hours every week.