


Still downloading templates?
There’s an easier way. Try a free AI Agent in ClickUp that actually does the work for you—set up in minutes, save hours every week.
Sorry, there were no results found for “”
Sorry, there were no results found for “”
Sorry, there were no results found for “”

You open a spreadsheet, run the same regression you’ve run a hundred times, and still second-guess the results. Was the sample big enough? Did you miss a confounder?
You’re not bad at analysis. You’re just buried in manual work. And AI can help.
It’s a godsend for automating the grunt work—cleaning data, testing assumptions, and surfacing patterns—so you and the rest of the humans on your team can focus on asking better questions.
According to Gartner, 61% of organizations are already changing their data-and-analytics operating model because of AI technologies.
This blog post will show you how you can, too.
Let’s explore the benefits, use cases, and real-world examples of integrating AI for statistics into your data analysis processes. And if you’re looking for a tool that helps you do it all, we’ll introduce you to ClickUp—the world’s first Converged AI Workspace!
Traditional statistical analysis is often a major bottleneck for teams. When only one or two people on the team have the specialized knowledge to run reports, everyone else has to wait in line for answers. This dependency slows down projects, stalls decision-making, and leaves most of the team feeling disconnected from the data that drives their work. It’s a frustrating cycle of asking, waiting, and all too often receiving insights that are already out of date.
🤖 AI techniques for statistical analysis break this cycle. Using machine learning and natural language processing, AI analyzes your data in record time, offering answers at your fingertips. This democratizes data, making it accessible to project managers, marketers, and operations teams who need insights at the right time to do their jobs effectively.
Plus, when AI is built into the same workspace where your data lives, you eliminate the friction points that make traditional analysis so painful.
Staring at a spreadsheet with thousands of rows? It can quickly become overwhelming. Manually trying to spot a trend or an outlier is not just slow—it’s how you miss critical details. By the time you finish your manual calculations, the opportunity to act on that information may have already passed.
AI, on the other hand, can process massive datasets in seconds. Its real power lies in pattern recognition, where it can identify trends, correlations, and anomalies that are nearly impossible for the human eye to catch.
More than saving time, AI helps you uncover the hidden stories in your data via:
For most teams, getting a simple question answered about their project data involves filing a ticket with the data team and waiting. Why? Because most traditional statistical software requires you to know a coding language like R, Python, or SQL. This creates a huge barrier for non-technical team members and turns the data team into a report-running factory.
AI tools with natural language interfaces completely change this dynamic. They allow anyone on the team to ask questions in plain English and get immediate statistical insights. This is a game-changer for team agility.
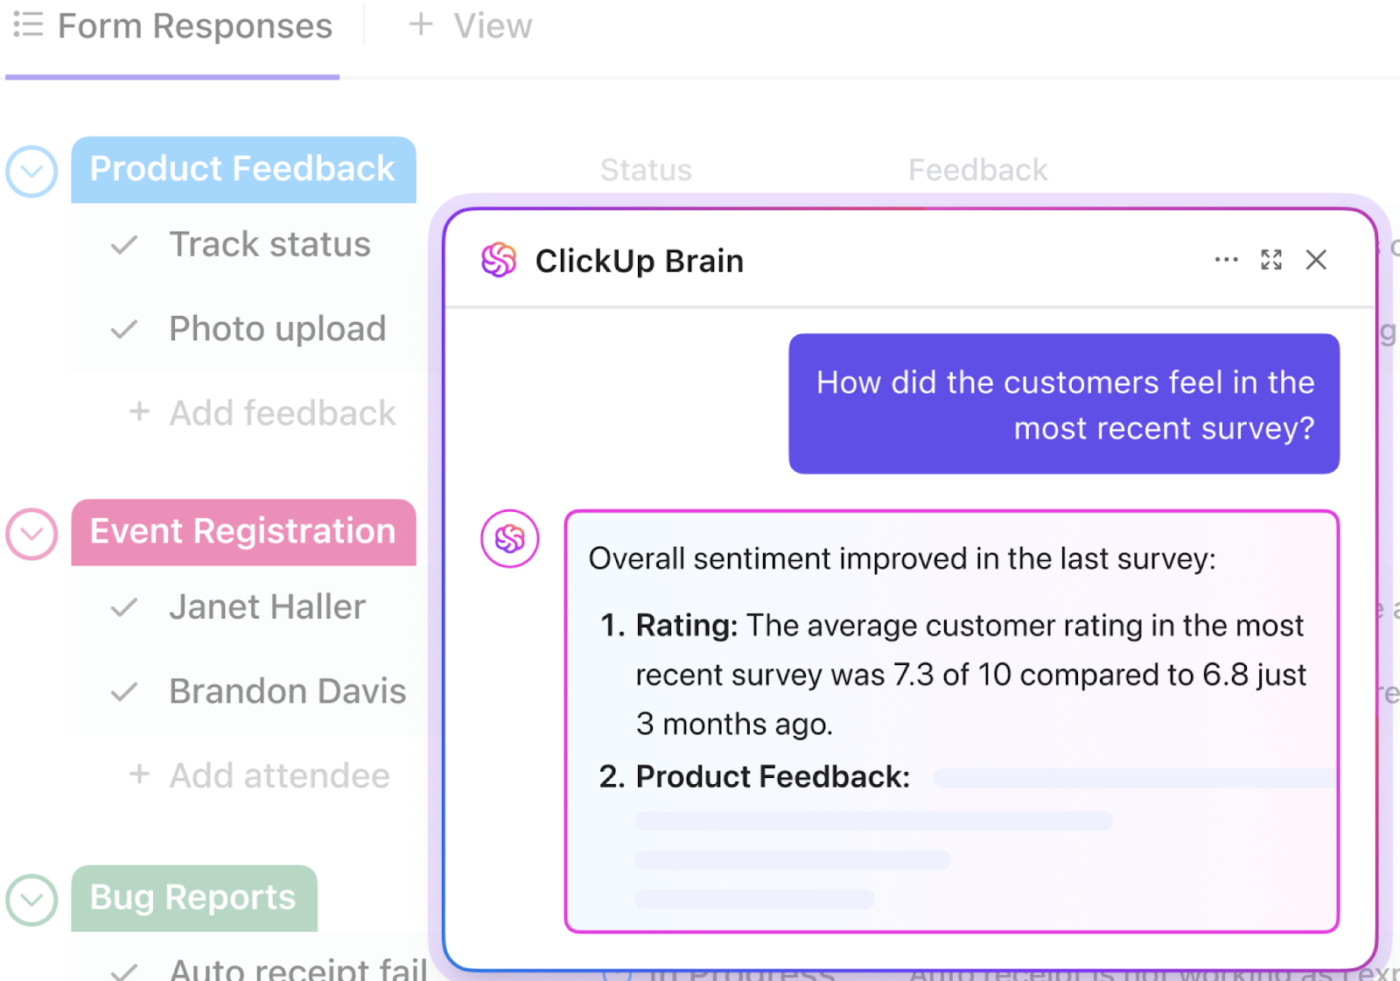
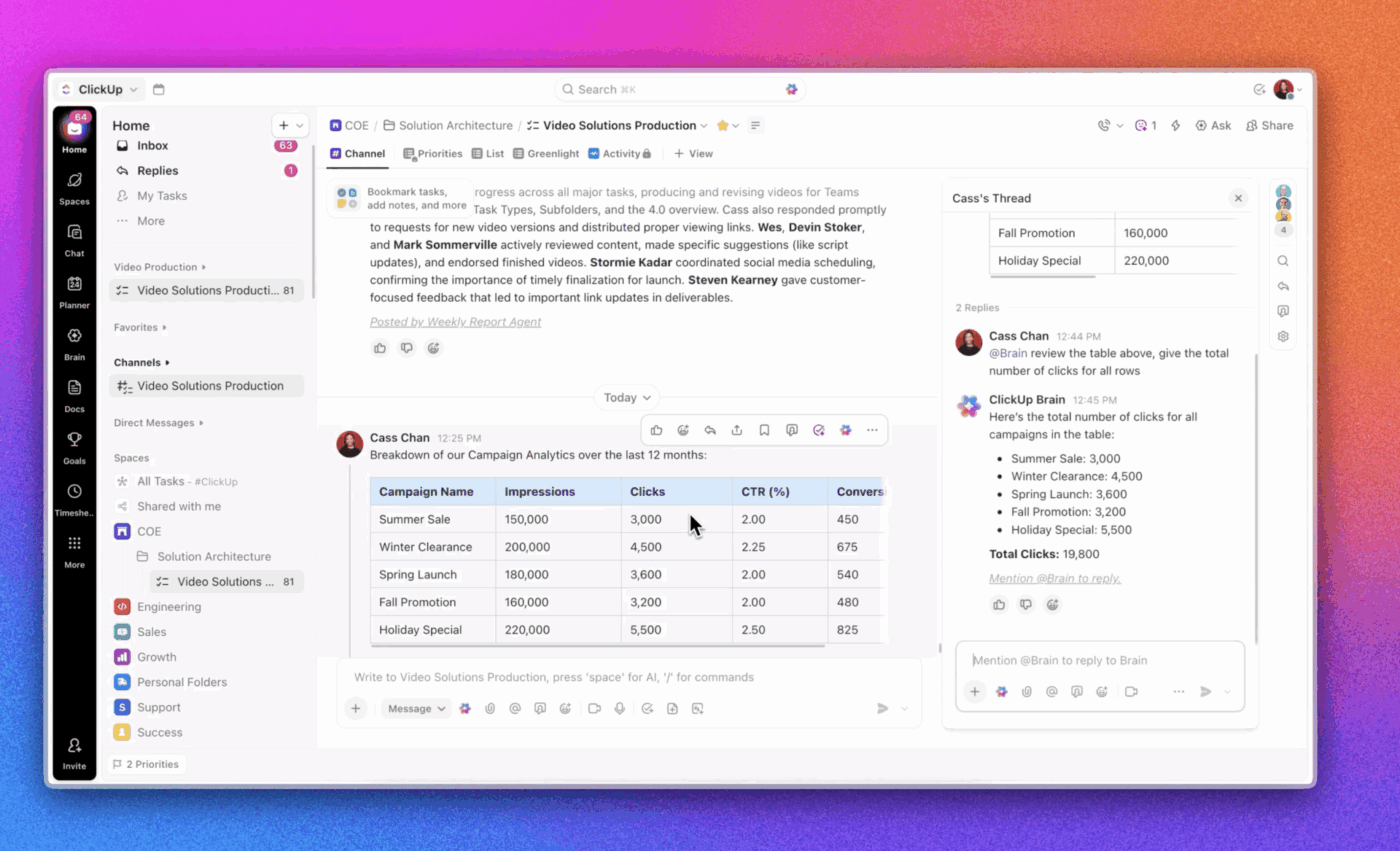
💡 Pro Tip: With a context-aware AI tool like ClickUp Brain, built into your ClickUp workspace, you can get instant insights about your project metrics. Simply ask a question using natural language, and it will analyze your workspace data to give you the right answer.
You get your answer without writing a single line of code. This frees up your data analysts to focus on more complex, strategic work while empowering your entire team to make faster, data-informed decisions.
If you’re looking for AI agents that simplify statistical analysis for you, watch this video for our recommendations:
👀 Did You Know? As much as 67% of the time spent on data analysis actually goes into data preparation.
Your team is acting as ‘data janitors’ when they should be devoting their precious time to curate insights and create impact instead.
AI can automate many of these tasks, but a better approach is to prevent the mess from happening in the first place. When your data lives in a Converged Workspace—a single platform where all your projects, documents, and data live together—it’s already structured and connected from the moment it’s created.
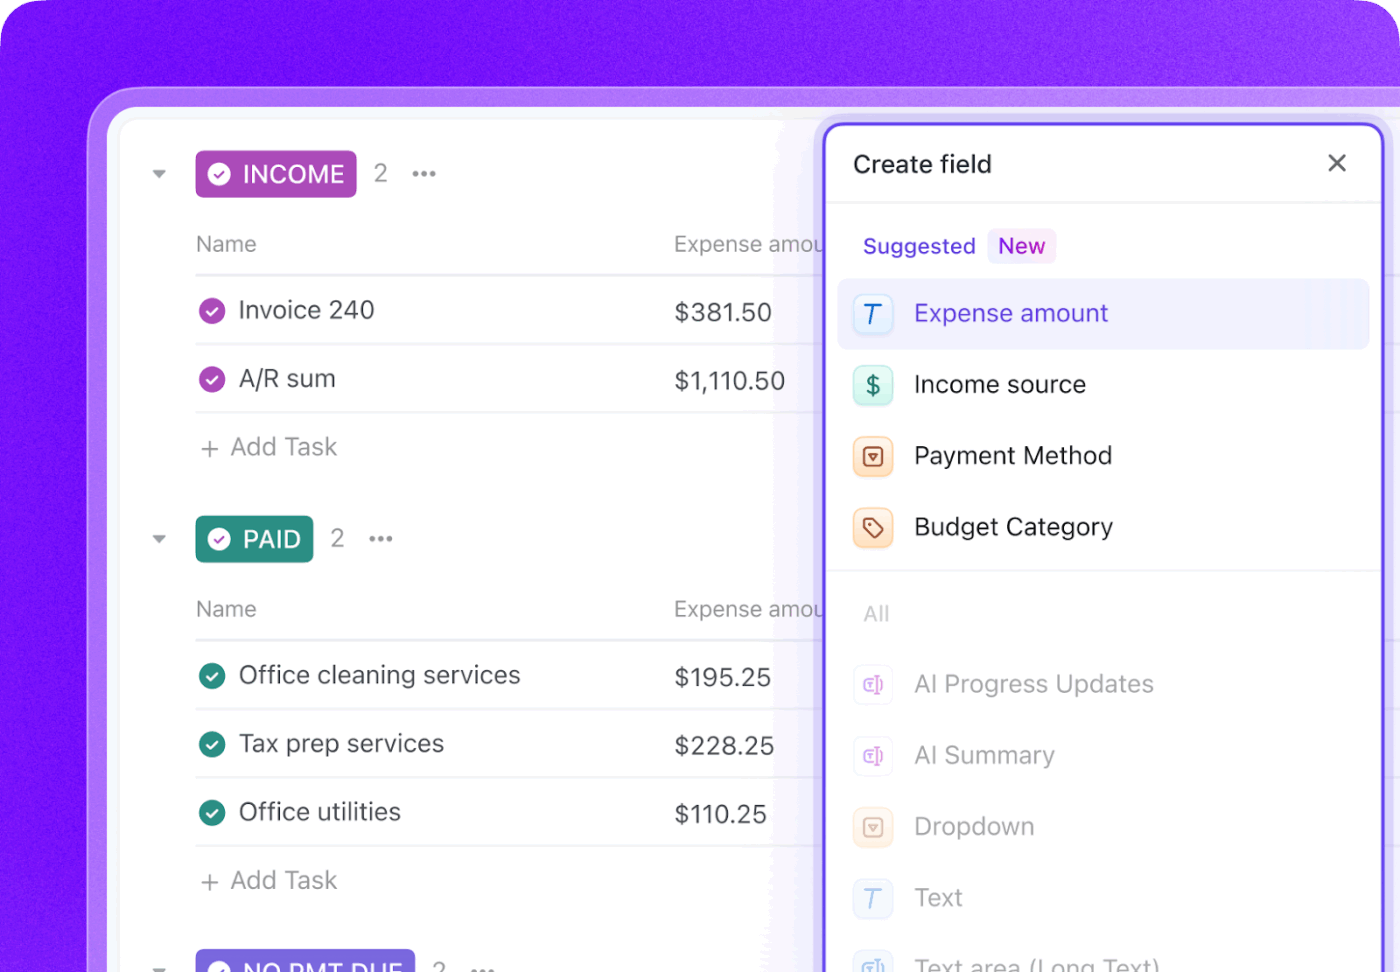
💡 Pro Tip: In ClickUp, you can use ClickUp Custom Fields to ensure data is captured consistently across all your tasks. Whether it’s a Money field for budget tracking, a Number field for story points, or a Dropdown for priority levels, you’re building a foundation of clean, reliable data. This means ClickUp Brain can analyze your information without needing a manual cleaning phase, giving you more accurate insights faster.
Okay, you have your numbers. What now?
A cold, lifeless table of data rarely sparks an aha moment—or a decision. Who’s excited by rows and columns, really?
Your best bet is turning those numbers into a compelling visualization. But which type of chart should you use? Which graph will actually tell the story? And why does it require you to open yet another tool, tweaking colors, second-guessing labels, and hoping you didn’t accidentally mislead anyone?
Then comes predictive modeling. Because obviously you’re supposed to forecast the future now, too. With what time? With what statistical confidence?
This is also where AI earns its keep—auto-generating visualizations, picking the right chart for your question, and lowering the barrier between “I have data” and “I know what to do next.”
💡 Pro Tip: If you’re already using ClickUp for your projects, you don’t need a separate tool for data visualization. ClickUp Dashboards act as a live, visual command center for your projects, converting your workspace data into real-time charts.
Because they’re built-in, they update automatically as your team completes work. You can see team performance and project health at a glance with a variety of cards, including bar charts, pie charts, and battery charts. You can even drill down into specific data points for more detail.
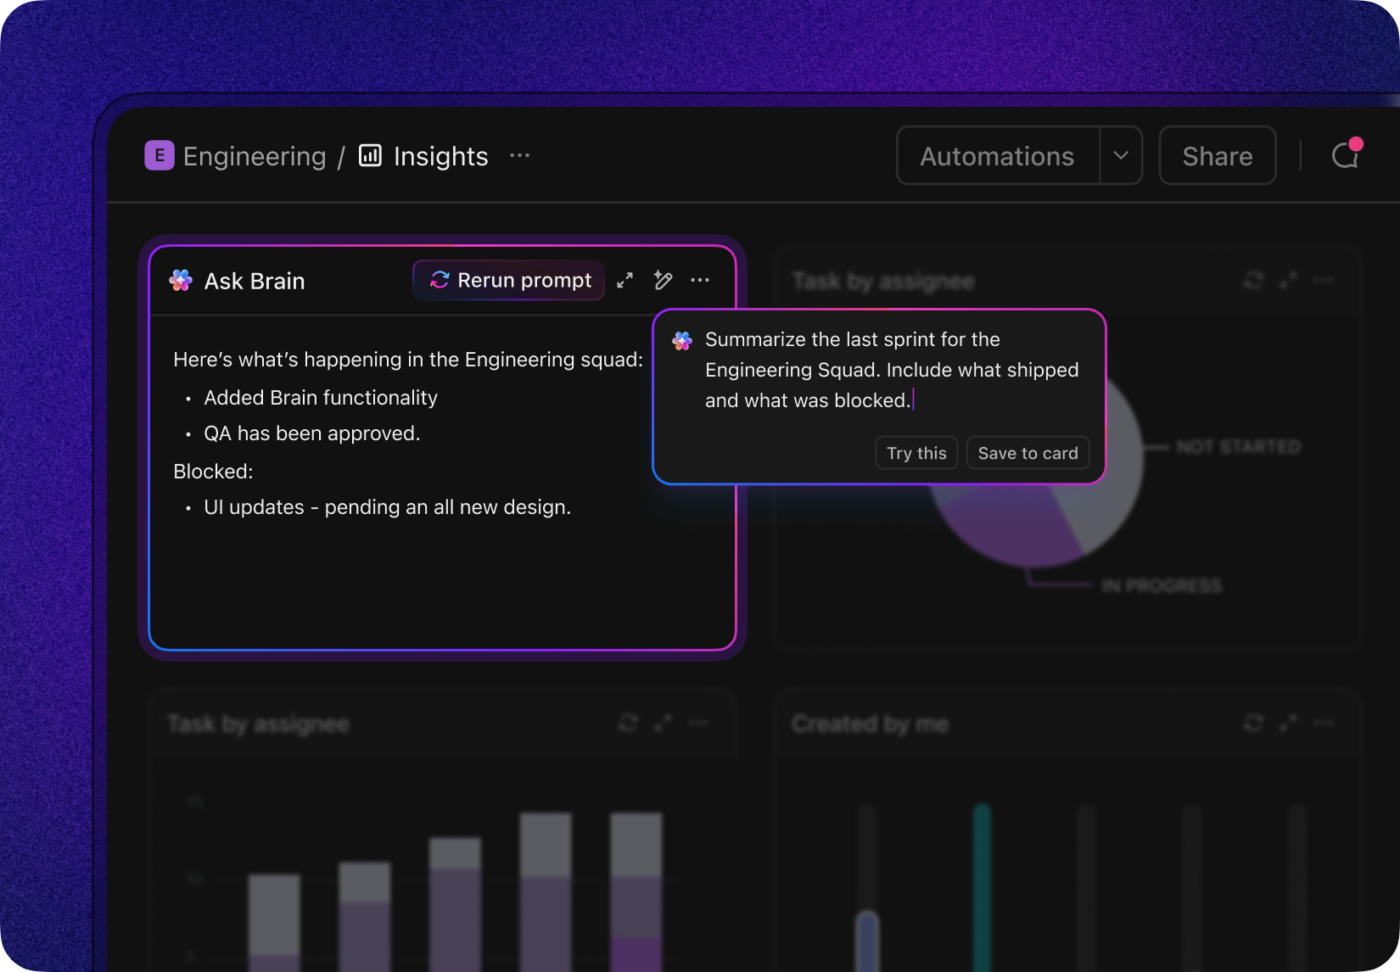
Plus, AI Cards within Dashboards let you surface these insights with natural language queries!
Picture this: you finally spot that elusive insight in your analytics tool. It answers the question your team’s been obsessing over for days, and you can’t wait to tell everyone.
You switch back to your project management app, find the right project, and paste a screenshot of the chart. Then, you add a paragraph explaining what people are supposed to notice. @mention your team. Hope they actually get it.
By the time you’re done, the insight has gone cold. The context? Fuzzy. The momentum? Gone.
Every time you switch between tools, you break your focus and waste time. This is Work Sprawl—today’s biggest productivity killer.
The solution is to stop switching and integrate your analysis directly into your workflow:
Adding more specialized AI tools for statistical analysis just creates more fragmentation, a problem we call AI Sprawl. It’s the unplanned proliferation of disconnected AI tools that leads to wasted costs, duplicated effort, and security risks. ClickUp Brain keeps everything connected, ensuring your insights translate directly into action.
📚 Also Read: Solve Work Sprawl with Contextual AI
When you search for the “best AI for statistics,” you’re hit with a tidal wave of options, all claiming to be the perfect solution. If you’ve already wasted weeks on demos for tools that are either too complicated or don’t solve your core problem, we hope our suggestions will help.
Many teams choose the most powerful tool instead of the most practical one for their actual workflow.
To make a smart choice, you need to frame the decision around the job to be done. There are three main categories of AI statistics tools. The right one for you depends on whether you need it for dedicated analysis, visual reporting, or integrated team collaboration.
This category covers purpose-built tools designed for serious statistical work. Think less “spreadsheet” and more power calculator—the kind academics, researchers, and data scientists use for complex hypothesis testing, advanced regressions, and modeling edge cases.
The catch? They tend to live in a silo. You usually have to export your data, switch tools, run the analysis, then manually paste results back into your project or planning system. That back-and-forth adds friction, invites errors, and slows decision-making—especially when insights need to move fast from analysis to action.
This category is dominated by business intelligence (BI) tools like Tableau and Power BI. They’re great at one thing: turning clean, centralized data into polished dashboards executives love. If your data already lives in a warehouse and you need high-level reporting, these tools are a good fit.
The downside? Most dashboards are a look, don’t touch experience. They sit outside your team’s day-to-day work, which means insights rarely turn into immediate action. Setup and maintenance often require data engineering support too—making them heavy, slow, and overkill for many teams.
💡 Pro Tip: For most team-level reporting, ClickUp Dashboards get you there faster. Build from scratch or templates, add live cards, and even schedule reports to hit stakeholders’ inboxes automatically—without leaving the place where work actually happens.
This is the emerging category of statistical analysis tools where AI capabilities are embedded directly into the work management platform. Instead of analytics being bolted onto the side, insights and actions stay in one place.
ClickUp is the perfect example of such a tool where your work and your analysis come together. Get context-aware insights right where you work with ClickUp Brain, which lives alongside your projects, tasks, and team data.
It’s best for:
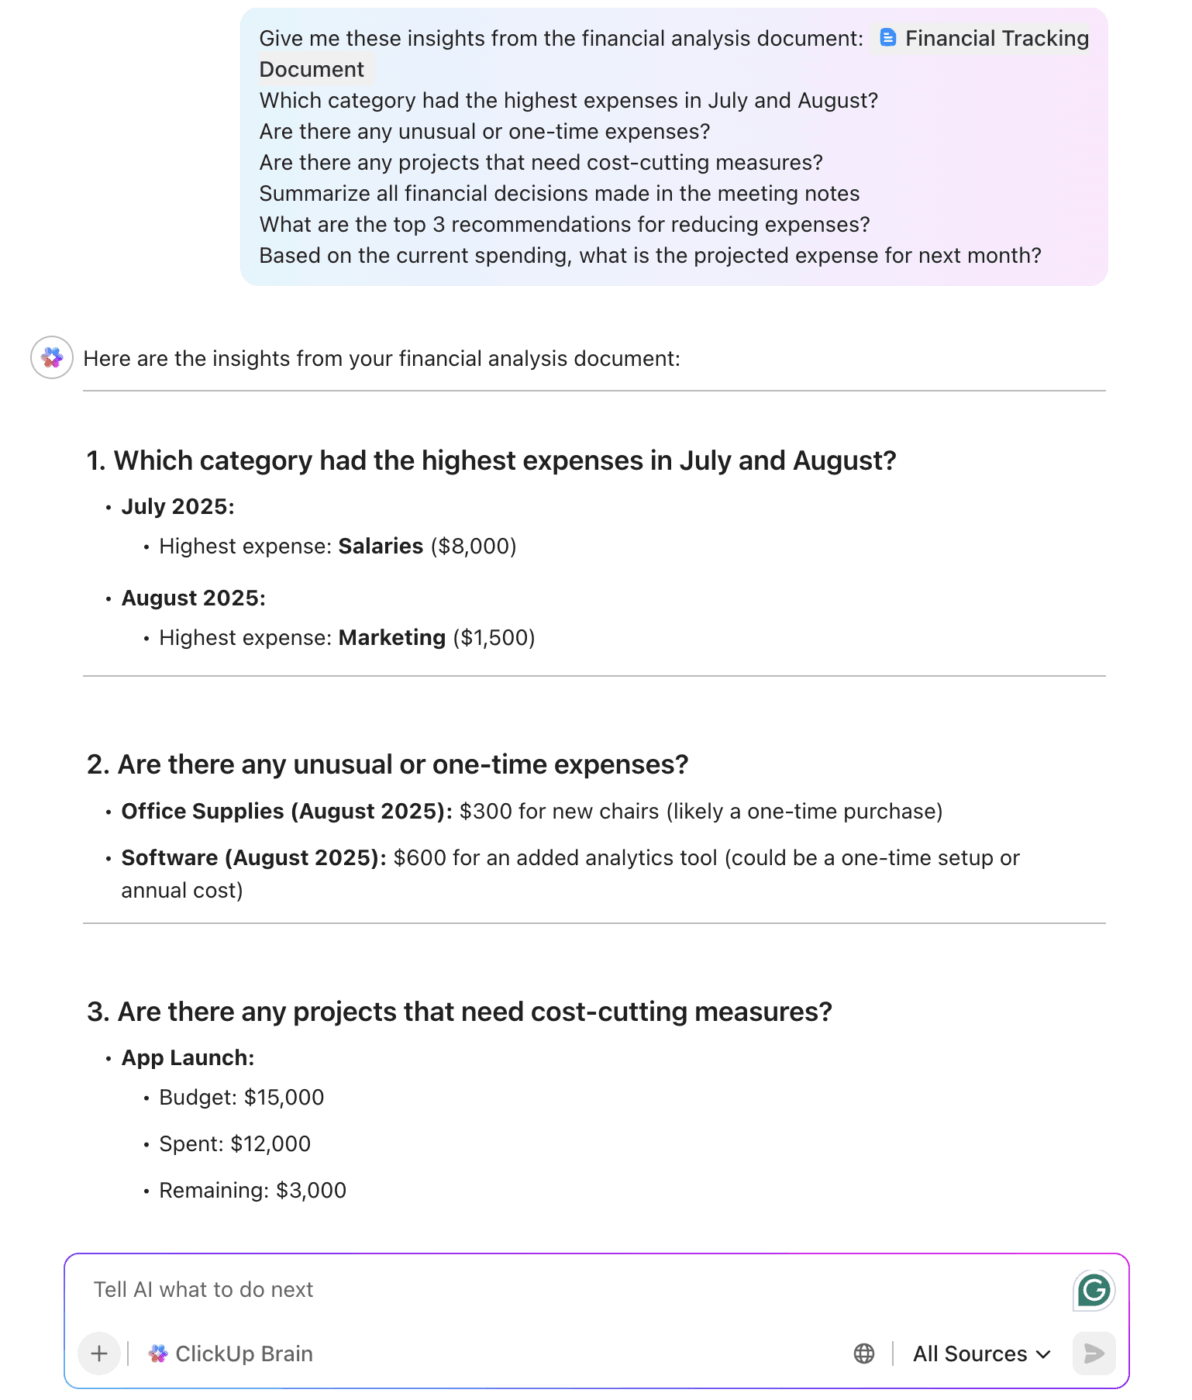
The idea of “AI for statistics” can feel abstract. It’s easier to see the value when you look at how real teams use it to solve everyday problems and answer very ordinary questions: What’s working? What’s risky? What should we do next?
Here are some case studies to show this in action 🛠️
Want more examples that you can apply to your own team? Here you go:
💡 Pro Tip: f you find yourself repeatedly asking the same analytical questions (like “What’s the trend in support workload?” or “Which sprint estimates missed the mark?”), consider setting up a ClickUp Super Agent to automate the analysis loop for you.
Super Agents are AI-powered teammates built right into your workspace that understand your project context, remember patterns over time, and can run workflows or deliver updates on a schedule.
Instead of repeatedly asking, “Are support hours spiking after releases?”, you can configure a Super Agent to monitor Time Tracking after each product launch and flag abnormal workload increases automatically. The insight shows up where your team is already working.
Learn more about how Super Agents work:
AI is powerful—but it’s not magic. And treating it like an all-knowing oracle is a fast way to make very confident, very wrong decisions.
Using AI responsibly starts with being clear-eyed about its limits. It’s not a reason to avoid it, but it’s a way to trust it appropriately.
Using an integrated tool like ClickUp helps mitigate some of these risks. Because your data stays within your secure workspace, you don’t have the same privacy concerns. And because ClickUp Brain has the context of your projects, it’s less likely to produce random, out-of-context hallucinations. But ultimately, AI is a tool to augment human intelligence, not replace it.
📮ClickUp Insight: While 34% of users operate with complete confidence in AI systems, a slightly larger group (38%) maintains a “trust but verify” approach. A standalone tool that is unfamiliar with your work context often carries a higher risk of generating inaccurate or unsatisfactory responses.
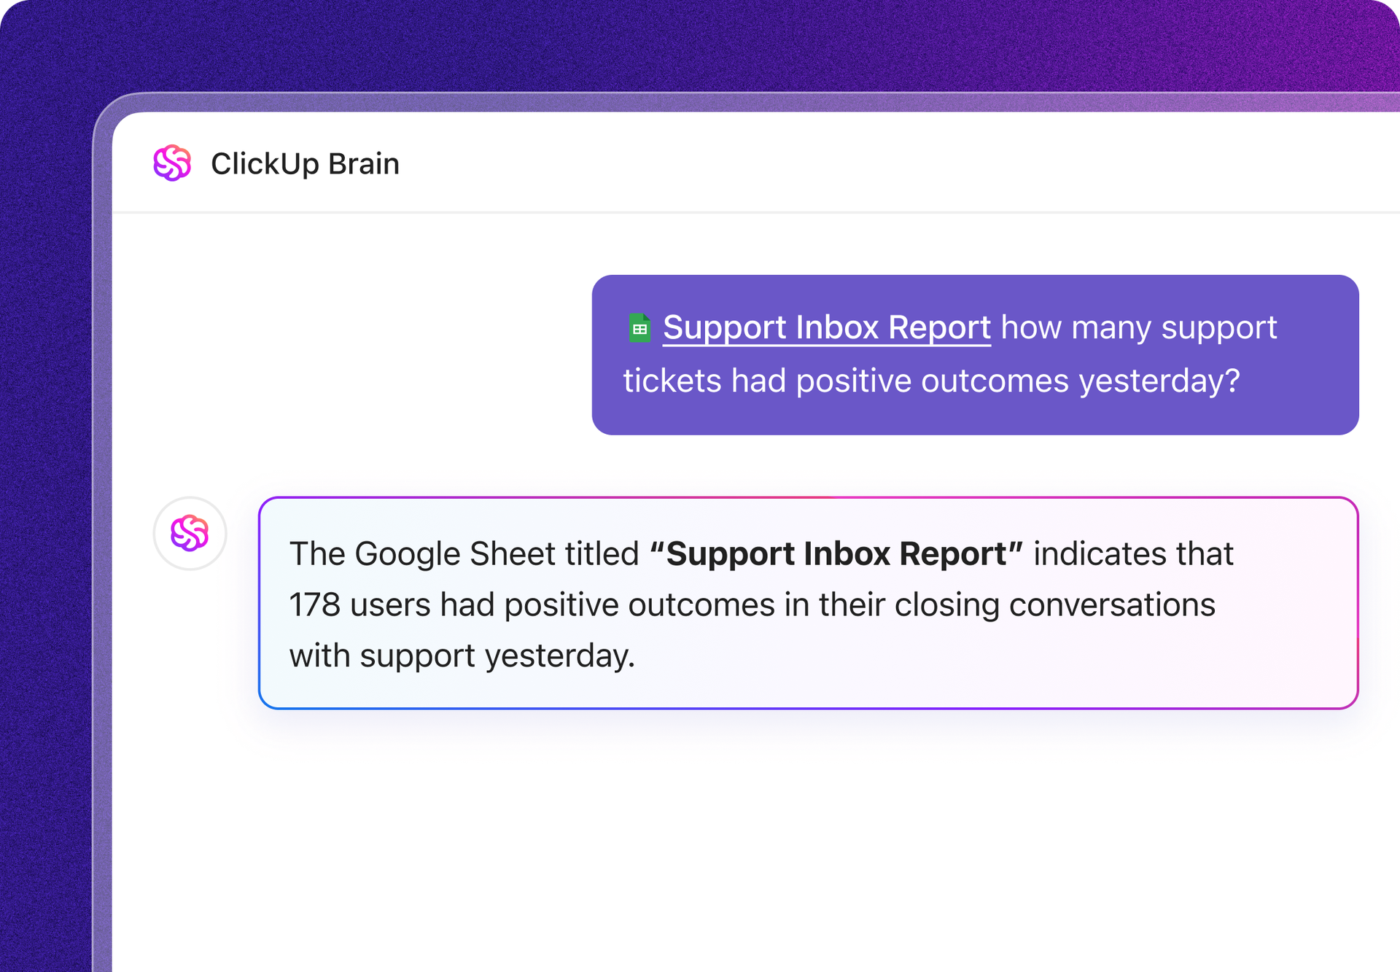
This is why we built ClickUp Brain, the AI that connects your project management, knowledge management, and collaboration across your workspace and integrated third-party tools. Get contextual responses without the toggle tax and experience a 2–3x increase in work efficiency, just like our clients at Seequent.
AI is making statistical analysis faster and more accessible than ever before. But the biggest gains don’t come from simply getting answers faster. They come from closing the gap between insight and action.
Fragmentation is the real enemy of productivity. Every time your team switches between analytics, project management, and communication tools, you lose time, focus, and momentum.
The future of AI for statistics isn’t another powerful tool living in isolation. It’s integrated intelligence—AI that understands your work, your projects, and your priorities, and delivers answers exactly where decisions get made.
If you’re serious about closing the gap between insight and execution, a converged workspace makes the difference. Try ClickUp for free and see what happens when analysis finally keeps up with action. ✨

© 2026 ClickUp

There’s an easier way. Try a free AI Agent in ClickUp that actually does the work for you—set up in minutes, save hours every week.