


Still downloading templates?
There’s an easier way. Try a free AI Agent in ClickUp that actually does the work for you—set up in minutes, save hours every week.
Sorry, there were no results found for “”
Sorry, there were no results found for “”
Sorry, there were no results found for “”

You built the spreadsheet to solve one specific problem.
Now you’re fixing formulas, cleaning columns, and rewriting the same conditional logic for the third time.
Microsoft Copilot for Excel helps you move past that loop. You can ask it to generate formulas, summarize trends, highlight anomalies, or create pivot tables using plain language. It handles the mechanics so you can focus on what the numbers mean.
This guide shows you how to use Microsoft Copilot for Excel automation tasks step by step, where it works well and where its limits become apparent.
We’ll also briefly cover why moving that work into a centralized workspace like ClickUp makes more sense. 😎
Microsoft Copilot in Excel is an AI assistant built into Microsoft 365 that responds to plain-language requests directly within your spreadsheet. You can generate formulas, analyze data patterns, create charts, highlight cells, and summarize information by typing prompts in the Copilot pane.
Here’s how it handles your data:
Put simply, the tool is designed for anyone working with data in Excel who wants to skip manual formula building and formatting.
🔎Did You Know? Microsoft recently integrated GPT-5.2 into the Copilot ecosystem. For Excel users, this means significantly better reasoning capabilities—it’s now much more accurate at following multi-step logic and complex math than the versions available just a year ago.
Understanding Copilot’s benefits can help you decide whether it’s worth adding to your Excel workflow.
Instead of memorizing the syntax for complex functions in Excel, you can describe what you want in the Copilot pane. The tool generates the Excel formula and even explains what it does, so you can learn while you work.
For example, a prompt like, ‘Add a column that calculates the percentage change between Q1 and Q2 sales,’ lets you avoid wrestling with formula syntax.
Copilot doesn’t just wait for you to type a prompt. It proactively offers suggestions based on your data. You might see buttons such as ‘Show trends’ or ‘Highlight outliers’ appear in the Copilot pane, reducing the guesswork about which analysis to run next.
You also get to see a preview of any changes before applying them, so there’s no risk of accidentally messing up your data.
You don’t need to know VBA or be an advanced formula writer to automate tasks.
Copilot handles the technical translation, so people who aren’t Excel power users can still automate tasks with AI assistants, boosting novice worker productivity by up to 34%. You can focus on the outcome you need, while the AI handles the steps to get there.
🔎Did You Know? 70% of Copilot users reported being more productive, while 68% reported improved work quality.
Here is the three-step checklist to get the Copilot pane active:
Copilot in Excel requires a Microsoft 365 subscription, such as a Business, Enterprise, or qualifying personal plan. Both the desktop app (Excel 365) and the web app support Copilot once your subscription is active.
📌Important: If you’re using a work account, you may need to check with your IT admin to ensure you have tenant-level access.
Copilot is a separate add-on license, so it isn’t included with Microsoft 365 by default.
For business users, an administrator assigns the Copilot license through the Microsoft 365 admin center. Personal users can purchase the Copilot Pro add-on through their Microsoft account settings.
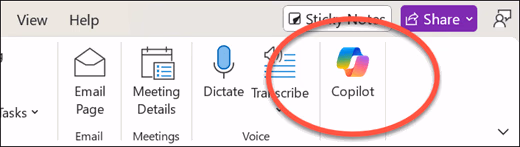
Once your license is provisioned, launch Excel and locate the Copilot icon on the far right of the Home tab. Clicking this icon will slide out the chat interface where you’ll do all your prompting.
📌 Important: If you don’t see the icon, go to File > Account > Update Options to ensure you’re running the latest build, as the AI features are tied to recent software patches.
With Copilot enabled, you can follow this step-by-step workflow to start automating tasks in your spreadsheet.
Copilot requires your data to be in an Excel table, not just a range of cells. This structure provides the AI with the context it needs to interpret your columns and rows accurately.
To do this:
Tables also support features such as structured references, which Copilot uses to generate more accurate formulas.
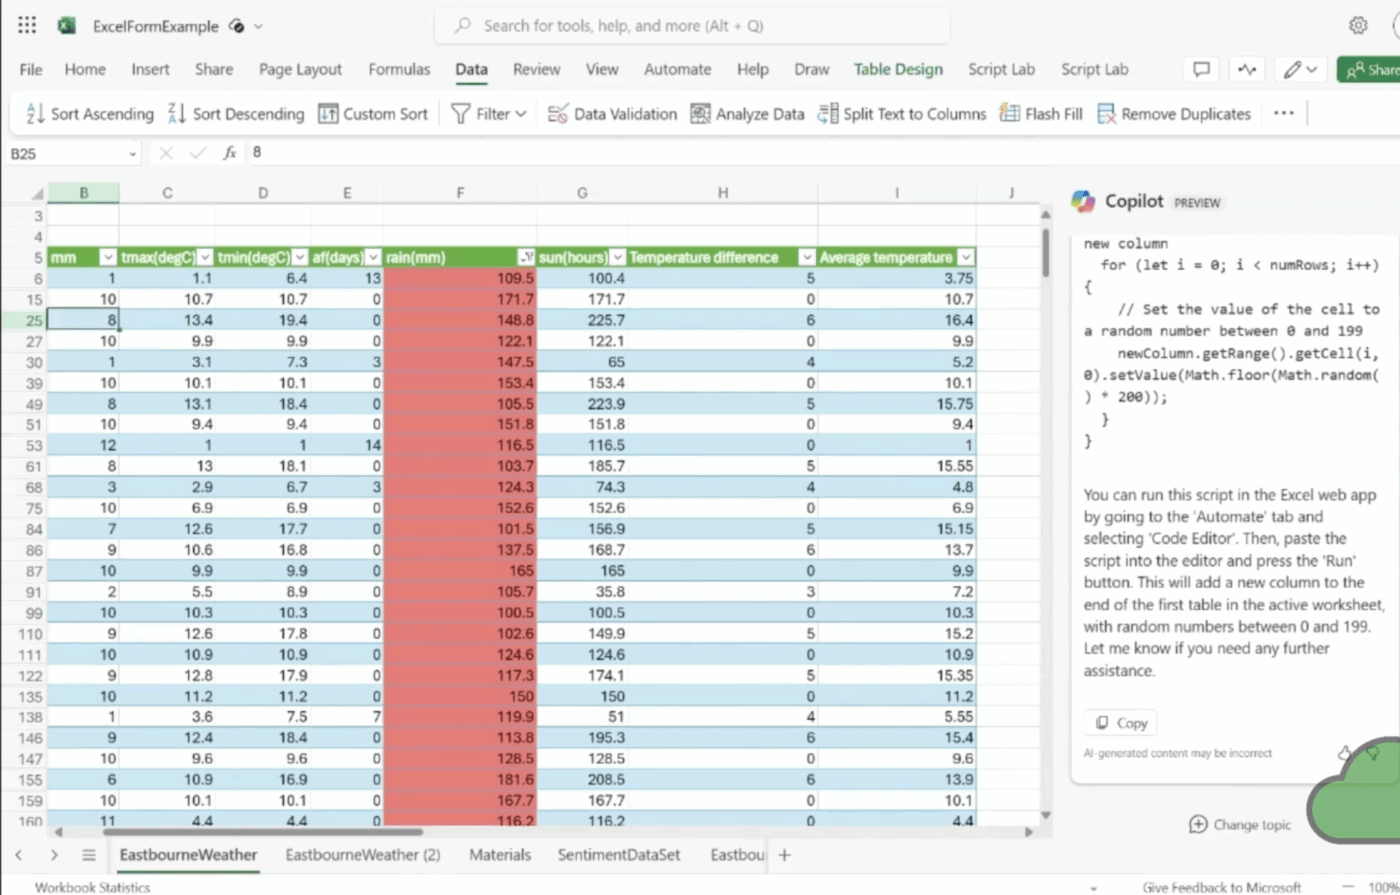
Click the Copilot icon in the Home tab to open the side panel. This panel displays prompt suggestions based on your current data, along with a text box for entering custom requests.
📌 Important: Remember, your workbook must be saved to OneDrive or SharePoint for Copilot to work, as local files are not supported.
You can now type a natural language request, like ‘Sort this table by revenue, highest to lowest’ or click one of Copilot’s suggested prompts. For the best results, be specific in your prompts by including column names and the exact outcome you want.
📖 Read More: Getting the output you want depends entirely on the clarity of your input. To learn how to structure your requests for better accuracy, check out our guide on How to Write AI Prompts? Tips, Templates & Examples. It covers the specific frameworks you can use to turn vague questions into actionable commands.
Copilot always shows you a preview of the changes before applying them to your workbook. Take a moment to review the formula, formatting, or analysis it generated.
You can then choose to accept, modify, or reject the suggestion. If the result isn’t quite right, you can refine your prompt and try again, as Copilot learns from the context of your conversation.
📮ClickUp Insight: While 34% of users operate with complete confidence in AI systems, a slightly larger group (38%) maintains a “trust but verify” approach.
A standalone tool that is unfamiliar with your work context often carries a higher risk of generating inaccurate or unsatisfactory responses.
This is why we built ClickUp Brain, the AI that connects your project management, knowledge management, and collaboration across your workspace and integrated third-party tools.
Get contextual responses without the toggle tax and experience a 2–3x increase in work efficiency, just like our clients at Seequent.
The quality of Copilot’s output depends heavily on how you phrase your prompts. Feel free to borrow a few from here:
| Category | What you want to achieve | Try this prompt |
| Formulas and calculations | Calculate growth metrics | “Create a formula to calculate the year-over-year growth percentage based on the values in column D” |
| Conditional totals | “Add a SUMIFS formula that totals all sales where the region in column C equals ‘West'” | |
| Automated flagging | “Write an IF statement in a new column that labels any order over $10,000 as ‘Priority'” | |
| Cross-sheet data syncing | “Use XLOOKUP to pull customer names from ‘Sheet2’ into this table, matching by the ‘Customer ID’ column” | |
| Data analysis | Rank performance | “Identify the top five products by total revenue and list them in a new sheet” |
| Calculate averages | “Show me the average order value broken down by month for the last fiscal year” | |
| Spot anomalies | “Analyze the ‘Shipping Cost’ column and highlight any outliers that are 20% above the median” | |
| High-level summaries | “Summarize the three most significant sales trends you see in this dataset” | |
| Visualization | Compare categories | “Create a clustered bar chart that compares total sales across all geographic regions” |
| Track trends over time | “Generate a line chart to visualize our monthly revenue growth over the last 12 months” | |
| Market share breakdown | “Build a pie chart showing the percentage of market share for each product category” | |
| Repetitive tasks | Clean up datasets | “Scan the ‘Email’ column and remove all duplicate rows to ensure data integrity” |
| Audit against averages | “Highlight all cells in column B that fall below the current column average in yellow” | |
| Manage deadlines | “Apply conditional formatting to the ‘Deadline’ column to turn any past-due dates bright red” | |
| Segment data | “Filter this table to show only the results from Q4 and sort them by ‘Revenue’ from highest to lowest” |
While single prompts are great for one-off tasks, you can take automation a step further for work you do repeatedly. Copilot can help you generate Office Scripts, which is Excel’s automation language based on JavaScript.
You can also ask Copilot to write a script that, for example, formats new data entries according to a specific set of rules. Then you can connect that script to Power Automate to run on a schedule or when a specific event occurs, such as a new file arriving in a SharePoint folder.
This approach moves you from one-time assistance to recurring automation. Just remember that while Copilot can write the script, you should always review and test the code before deploying it into a critical workflow.
To better understand how AI can streamline your workflow beyond Excel, watch this practical guide on using AI for task automation across different applications and use cases.
Copilot has specific limitations worth knowing before you rely on it.
📌 Important Note: Microsoft has updated Copilot to support modern Excel workbooks stored locally on your computer. This means you no longer have to save every file to OneDrive or SharePoint just to use the AI features. However, you still need to format your data as an official Excel Table for the tool to function. Additionally, while the analysis runs on your machine, some advanced features, such as cross-referencing other documents, may still require a cloud connection to deliver complete results. It makes the pre-existing limitation still relevant.
Automation work scattered across files, email threads, and chat messages creates Tool Sprawl—when teams waste hours searching for information across multiple disconnected apps and platforms.
ClickUp offers a Converged AI Workspace instead that eliminates Work Sprawl by centralizing everything in one place.
A spreadsheet can tell you that your Q4 margins are thin, but it can’t ensure someone does something about it.
By converting your Excel findings into ClickUp Tasks, you move automation projects out of a static file and into an accountable workflow. This transforms a data point into a living work item that aligns with your team’s daily priorities. For example:
Writing documentation for a complex Excel macro or drafting a project brief can take as long as the analysis itself. ClickUp Brain is your contextual AI assistant that already understands your project history, enabling you to generate content in seconds.
Use it to:
Savitree Cheaisang, Assistant Vice President at Bubblely, shared their experience:
My company is much more organized and able to control the timeline on each project, tracking all activities that happen in there. I love the calculate function that gives you a quick review of numbers instead export them in excel and doing a manual calculation.
Excel automation is only as good as the logic behind it.
To prevent isolated knowledge blocks where only one person knows how a complex workbook functions, use ClickUp Docs to build a centralized repository for your logic. Unlike a README file hidden in a folder, these docs are woven into your project workspace.

You can use them to:
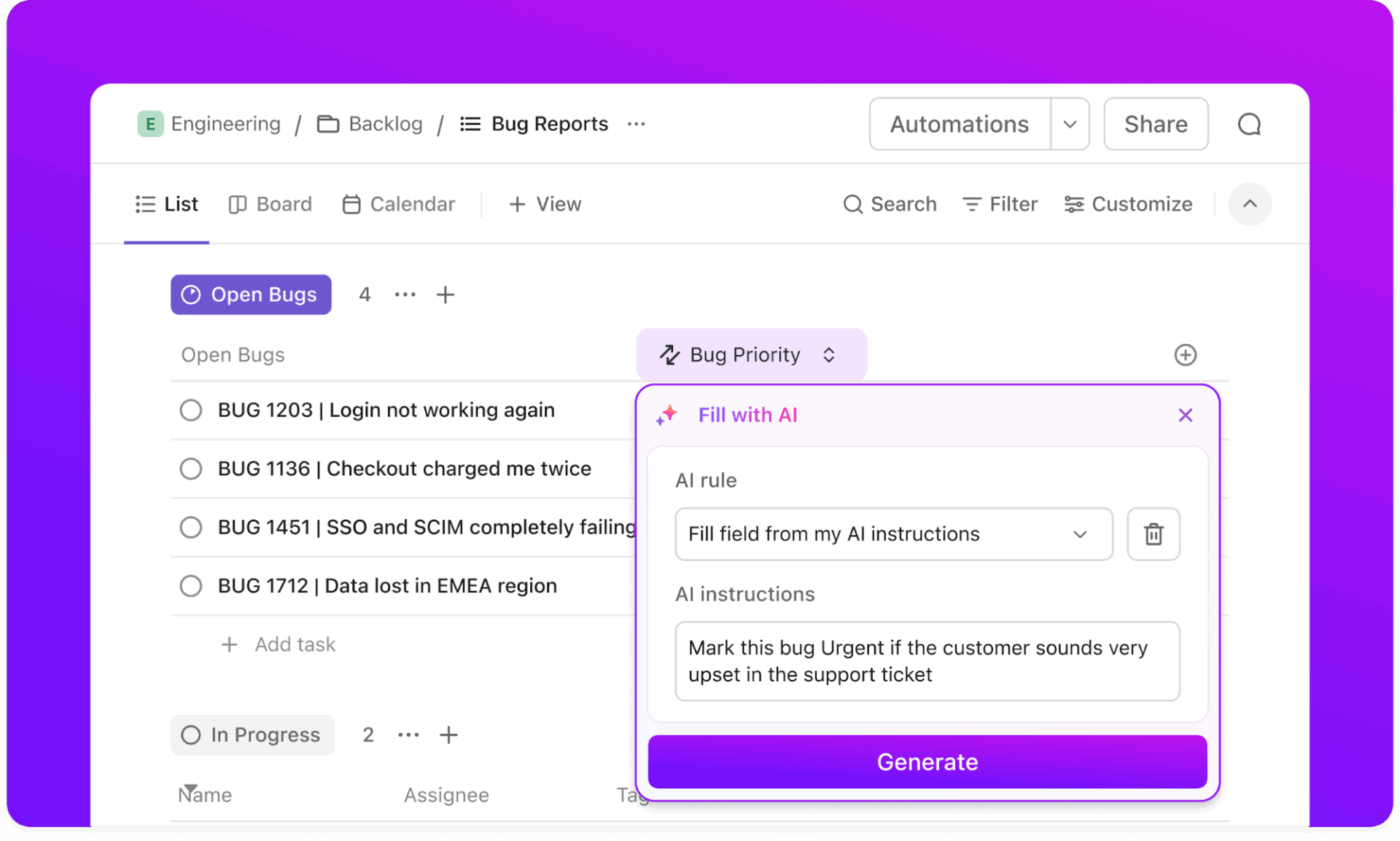
Once your Excel analysis is complete, the next step is usually to notify a stakeholder or move to the next phase of the project. ClickUp Automations and detailed AI fields handle this transition for you, acting as the connective tissue between your data and your process.
It helps you:
When you’re managing multiple automation workflows across different departments, you need a way to see the big picture without opening ten different workbooks.
ClickUp Dashboards act as your command center, pulling data from across your workspace to show you exactly where your resources are going. With it, you can:
Microsoft Copilot in Excel converts your natural-language prompts into formulas, analyses, and formatting, eliminating the need to memorize complex syntax.
The workflow is straightforward: format your data as a table, open the Copilot pane, enter specific prompts, and always review the results before applying them.
However, it’s important to remember that data analysis is only half the battle. To ensure your insights actually lead to results, you need a way to track the follow-up.
Moving your finished reports into a centralized workspace like ClickUp ensures that every automated insight is paired with an owner, a deadline, and a clear path to execution.
✅ Get started with ClickUp today for free!
Yes, while Copilot primarily interacts with data already in your workbook, you can use it to import and analyze data from external sources such as the web, other Excel files, or internal databases. For more advanced integration, you can use Agent Mode to connect to third-party platforms and pull that information directly into your analysis.
The primary difference is contextual integration. Standalone tools usually require you to export and upload your data into a separate chat interface. Copilot lives in the Excel ribbon, so it understands your table structure, headers, and formulas natively. It can apply changes directly to your grid rather than just providing text-based advice.
For the best results, your data must be formatted as an official Excel Table. If you prefer to use a standard range, it must have a single, unique header row without blank headers, empty rows or columns, and merged cells. Additionally, AutoSave must be turned on for the file.
Yes. Since Copilot-enabled files are hosted on OneDrive or SharePoint, multiple users can collaborate on the same workbook in real time. Team members can see the formulas and charts Copilot generates, and you can even use Copilot Pages to share and refine the specific prompts and logic your team used to build the automation.

© 2026 ClickUp

There’s an easier way. Try a free AI Agent in ClickUp that actually does the work for you—set up in minutes, save hours every week.