


Still downloading templates?
There’s an easier way. Try a free AI Agent in ClickUp that actually does the work for you—set up in minutes, save hours every week.
Sorry, there were no results found for “”
Sorry, there were no results found for “”
Sorry, there were no results found for “”


If you’re a developer, you’ve likely been there—wasting hours dragging and dropping shapes to visualize complex systems, struggling to organize workflows, and switching between tools that disrupt your coding flow.
It’s tedious, inefficient, and not worth your time.
Enter Mermaid, a lightweight, code-based tool that turns simple syntax into clear, scalable workflow diagrams in seconds. No clunky UI. No pixel-perfect alignment nightmares. Just write your logic, and let Mermaid handle the visuals.
It’s an efficient way to visualize your workflow. How? Read this detailed guide to learn all about it!
1. What is a Mermaid diagram?
A text-based tool that turns simple syntax into flowcharts, Gantt charts, or mind maps—no design skills needed.
2. Why use Mermaid for workflow visualization?
It saves hours by generating clean visuals directly from text, keeping focus on logic—not layout.
3. What types of diagrams can you create?
Flowcharts, sequence diagrams, ERDs, Gantt charts, and more to map workflows, APIs, or data structures.
4. What are Mermaid’s limitations?
Limited animations and interactivity—best for static workflows and documentation, not dynamic presentations.
5. How does ClickUp enhance Mermaid diagrams?
Embed Mermaid code in ClickUp Docs to visualize workflows, collaborate live, and connect diagrams to actionable tasks.
Mermaid diagrams are code-based diagrams generated directly from text, eliminating the need for time-consuming design tools. They use Markdown-inspired syntax (plain-text syntax that allows you to add formatting elements) to illustrate processes.
You just have to provide clear, structured instructions in text form, and Mermaid will translate the text into a professional diagram automatically. This makes Mermaid a powerful tool for developers, technical writers, and project managers who want to focus on content and functionality rather than formatting.
Here is an example of a simple pie chart Mermaid diagram:

What makes Mermaid even better? It’s open-source. That means the tool keeps improving with updates and new features from the community.
✨ Fun fact: Mermaid got its name from an interesting source of inspiration! The creator of Mermaid, Knut Sveidahl, was inspired by his children watching The Little Mermaid at home.
Need a Template for Diagram? Get instant help with ClickUp Entity Relationship Diagram Template.. Try it now!
Here are the different types of diagrams you can create in Mermaid:
Here are some common diagram examples and how you can use Mermaid to create them:

This flowchart diagram shows decision points for deploying code to production based on whether it is Friday. It begins with the action ‘Deploy to production’ and leads to a decision node asking, ‘Is it Friday?’ If the answer is ‘Yes,’ the flow moves to ‘Do not deploy!’ Otherwise, it proceeds to ‘Run deploy.sh to deploy!’
The ‘flowchart TD’ syntax indicates that the diagram should flow top to down.
💡 Pro Tip: If you’re looking for an alternative to manually creating flowcharts with Mermaid syntax, consider using flowchart templates or dedicated flowchart makers to streamline the process.
You can also create Gantt charts with Mermaid. This Gantt chart example visually represents the project timeline by breaking it into tasks. Each task has a start date, end date, and duration, showing dependencies and overlaps between them. The chart provides a clear overview of the project schedule, progress, and deadlines.
Sequence diagrams help illustrate the flow of messages or events between components in a system. By mapping out each step—such as requests, responses, or triggers—they make it easy to see how components interact, in what order, and how data flows through the system.

This sequence diagram illustrates the authentication process using username/password and JSON Web Tokens (JWT). It represents the interaction between three entities: the Client, the Server, and the Database.
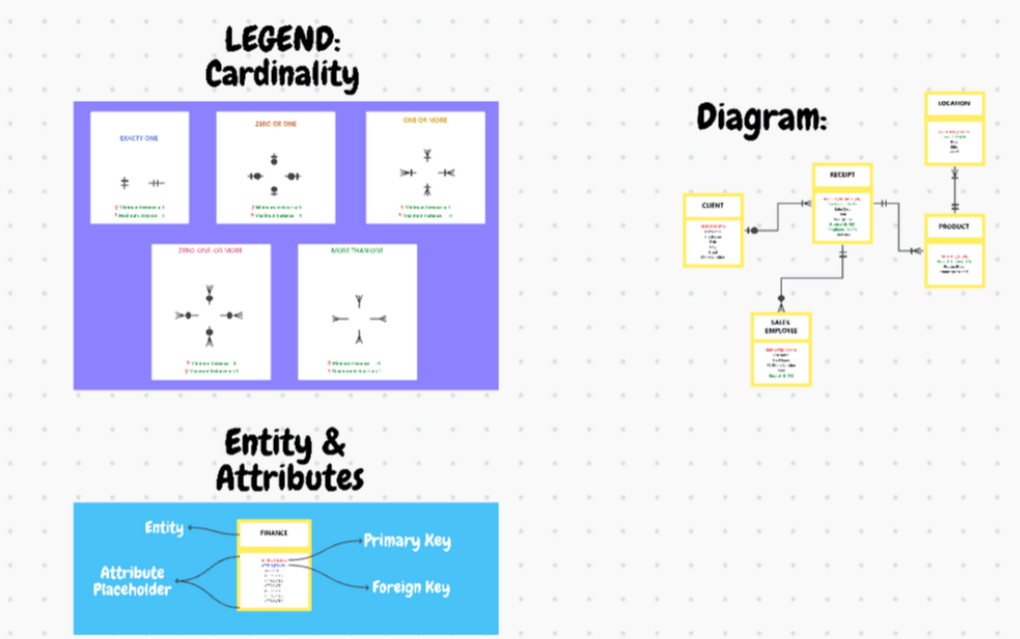
An Entity-Relationship Diagram (ERD) visualizes entities (like users, products, or orders) in a database structure and their relationships (one-to-many, one-to-many, or many-to-many).
You can easily create an ER diagram with the ClickUp Entity Relationship Diagram Template. The template offers an organized structure to visualize relational databases and map out the logical relationships between various entities.
With this template, you can:
Context diagram templates can also help outline system boundaries and interactions before moving to the details of your database schema. For example, a context diagram might show customers placing orders and suppliers updating inventory. This step ensures you understand the bigger picture before focusing on specifics.
Swimlane diagrams are ideal for dividing tasks across teams or departments. You can assign each lane to a specific team, such as design, development, or marketing. This enables you to visualize who handles what and how the tasks flow between them, ensuring everyone understands their responsibilities.
Use the ClickUp Swimlane Flowchart Diagram Template to create clear flowcharts while managing priorities, deadlines, and statuses for a streamlined and efficient process.
This template helps you:
A mind map is a visual representation of ideas or concepts revolving around a central theme. It is used to connect related ideas, structure or analyze information, and outline project plans.
You can create a simple mind map for project planning with the ClickUp Project Mapping Template. It helps you organize project tasks, identify project roadblocks, and track project milestones.
With this template, you can:
Now that you’ve seen how versatile Mermaid diagrams can be, it’s time to set sail and put them to use! They’ll help you organize ideas, explain complex processes, and collaborate with your team.
📖 Read More: How to Create a Swimlane Diagram in Visio?
If you’re a developer, project manager, or someone who values clear visuals, here’s why Mermaid stands out:
Forget struggling with shapes and alignments in traditional tools. Mermaid transforms a few lines of text into a polished diagram. No dragging, dropping, or fiddling around—just clean, effective visuals in seconds.
Mermaid blends right into the tools you already use. You don’t need new software or extra plugins. It works natively with platforms like GitHub, making it easy to incorporate diagrams into documentation, project plans, or code reviews.
Updating complex diagrams to match process changes can be a chore. Mermaid makes it effortless. Since diagrams are created as code, they’re easy to edit and update alongside your project. This means you can version-control, edit, and update your diagrams as your workflow or architecture evolves.
Mermaid gives you enough styling options to personalize your diagrams but keeps it simple. You can tweak colors and layouts without getting lost in endless customization menus. Use a dark mode theme for presentations or tweak node shapes and colors to align with your company’s branding or project needs.
🧠 Did you know? Mermaid runs entirely on browsers using JavaScript, making it lightweight and platform-independent. You don’t need server-side rendering or additional plugins.
Follow these simple steps to create your own Mermaid diagrams:
Think about what type of diagram you actually need. Are you building a flowchart to illustrate a process? A Gantt chart to track project progress? Deciding the diagram type and purpose helps you stay focused and choose the best structure for your diagram.
Once you know what type of diagram you want, it’s time to write the code. Mermaid’s syntax is super simple.
Here is the basic syntax to create Mermaid diagrams:
| Diagram Type | Syntax | Example |
| Flowchart | flowchart TDA –> B | flowchart TDA[Start] –> B[Process] –> C[End] |
| Sequence Diagram | sequenceDiagramparticipant AA->>B: Message | sequenceDiagramparticipant Aparticipant BA->>B: HelloB->>A: Hi! |
| Gantt Chart | gantttitle Projectsection Section 1A :a1, 2025-01-01, 30d | gantttitle My Gantt Chartsection PlanningTask 1 :a1, 2025-01-01, 10dTask 2 :after a1, 15d |
| Class Diagram | classDiagramClassName : AttributeClassName : Method() | classDiagramclass CarCar : +start()Car : +stop() |
| Pie Chart | pietitle Chart Title”Slice A” : 30 | pietitle Favorite Fruits”Apple” : 40″Banana” : 30″Grapes” : 30 |
| Entity Relationship Diagram | erDiagramEntity1 {Field1 string} | erDiagramCustomer {ID intName string}Order {OrderID intCustomerID int} |
Now, head over to the Mermaid Live Editor. Paste the code you wrote into the left panel, and watch your diagram appear on the right side in real time.

Once your diagram is ready, you can tweak it as needed. Add more nodes and links, or change the layout to get everything just right. The Live Editor shows those changes immediately, so it’s easy to play around and perfect your diagram.

After finalizing the diagram, copy the Markdown code from the Live Editor. This is the text-based code that defines the diagram.
You’ll find the code at the bottom of the left panel.

Once your diagram is ready, it’s time to bring it into the bigger picture.
You can paste Mermaid code into Markdown files on GitHub or GitLab, and the platform will automatically render the diagram when viewing the file in a repository. This is a great option if you’re working on a collaborative project and need a lightweight way to integrate diagrams directly into your codebase.
However, if you are looking for a versatile workflow diagram software to connect your visual diagrams to your actual workflow, try ClickUp. It is the everything app for work where you can turn your ideas into actionable tasks, build project roadmaps, create documents, visualize processes, and do much more.
You can copy your Mermaid diagram code and paste it into ClickUp Docs to visualize processes, workflows, or timelines directly within the context of your project.
Whether you’re developing a project plan or organizing ideas, ClickUp Docs is the perfect place to keep everything in one place.
Head over to ClickUp Docs, where you want to add your diagram. Now, type the /command in your Doc to pull up the menu and select Markdown. This is your entry point for embedding all sorts of content, and Mermaid diagrams fit right in!
Once you have your Mermaid diagram code copied from the Mermaid Live Editor, paste it into the Markdown block you created.

Don’t worry about formatting it—ClickUp does that for you. Once you’ve inserted the above code, click Paste. ClickUp will read the code and instantly render the diagram into a clear, visual format for basic understanding.
You’ve got your flowchart, sequence diagram, or whatever diagram you chose—perfectly placed for everyone to see.
Embedding Mermaid diagrams directly into ClickUp Docs makes it easy to visualize workflows and turn them into actionable steps in no time.
No need to wait for someone to finish their updates; everyone can contribute at once. Simply highlight any part of the Doc or diagram and leave a comment right there. You can tag team members, assign comments as tasks, or even track progress.
If you’re a not-so-technical person, get ClickUp Brain, ClickUp’s built-in AI assistant, to generate the mermaid diagram code for you.
Connect your document to ClickUp Whiteboards and enhance collaboration even further. You and your team can map out workflows, create diagrams, and add charts in real time.
For instance, if your dev team is planning a new feature, Whiteboards make it easy to sketch out the architecture. You can drop in diagrams to show how APIs will communicate, outline database relationships, or map out the user journey.
The best part? As you’re brainstorming, team members can assign responsibilities and link everything to your project timeline right from the board. This keeps the entire process smooth and makes sure everyone is on the same page.
Any idea you jot down on a whiteboard can be instantly converted into a task to go from concept to execution without skipping a beat.

And collaboration? It’s effortless. Simply go to Space Settings, click on Sharing & Permissions, and invite your team members. They can join in, contribute to the diagrams, and refine workflows alongside you.

Learn how to brainstorm and execute ideas with ClickUp Whiteboards.👇
Once you have the overall structure visualized, ClickUp Mind Maps lets you break down ideas even further. You can add sub-tasks, draw connections, and group related concepts within a customizable and interactive interface.

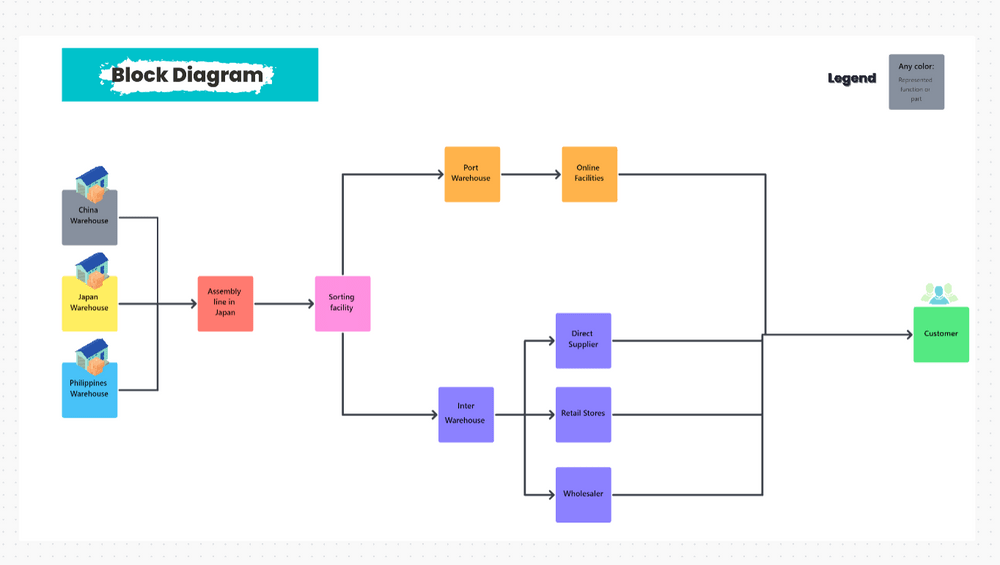
The ClickUp Block Diagram Template turns your static images into an interactive, dynamic workspace.
The template allows you to:
📮ClickUp Insight: About 43% of workers send 0-10 messages daily. While this suggests more focused or deliberate conversations, it could also indicate a lack of seamless collaboration, with important discussions happening elsewhere (like email).
To prevent unnecessary platform hopping and context switching, you need an everything app for work, like ClickUp, that combines projects, knowledge, and chat in one place—all powered by AI that helps you work more efficiently.
Mermaid diagrams provide an efficient, text-based approach that simplifies the process of building diagrams.
While they offer many benefits, it’s important to be aware of a few areas where improvements can be made.
Mermaid’s live editor lacks a drag-and-drop interface, which means users must manually code nodes and connections. This can feel cumbersome for developers unfamiliar with Mermaid syntax.
✅ Best practice: Sketch out your diagram on paper or a simple digital whiteboard before coding. Once you have a rough idea, break it down into smaller components and test them out frequently. For smoother workflows, consider using tools like ClickUp, which combines visual interfaces with code editing, making it easier to create and refine diagrams without writing everything from scratch.
📌 Example: If you’re building a flowchart for an API, start by sketching the endpoints on a whiteboard. Then, create your Mermaid diagram gradually by adding endpoints and connections, testing each one as you go.
As codebase evolves, complex diagrams can quickly become outdated, especially if they represent fast-changing elements like microservices or complex data structures.
✅ Best practice: Assign someone to review and update diagrams as part of project maintenance. Incorporate a system for version control or maintain a changelog to track updates in diagrams alongside the project.
📌 Example: If you’re working on a backend architecture for a SaaS product, update the system architecture diagram every time a new service or feature is added to the codebase. Version control will help keep everything in sync with the latest changes.
Mermaid diagrams lack interactive features like tooltips or clickable elements, which can limit their use for dynamic presentations or websites.
✅ Best Practice: To add more context or interactivity, pair Mermaid diagrams with platforms like ClickUp Docs. These allow you to embed diagrams and add comments, links, and other annotations to enhance the user experience.
📌 Example: For an onboarding flow of a mobile app, embed your Mermaid diagram in a publicly shared ClickUp Doc and use links to direct users to relevant documentation or resources, giving them a richer, more interactive experience.
Mermaid offers basic animations but doesn’t support complex ones, which can reduce its appeal for dynamic storytelling or engaging visuals.
✅ Best Practice: Use Mermaid diagrams for static workflows or quick overviews. For more dynamic visuals, try mind-mapping tools that let you explore ideas in an interactive and visually engaging way.
📌 Example: When presenting the architecture of a new feature to your team, use Mermaid for a simple, clear flowchart, but switch to mind maps if you want to visually represent different feature branches and their interactions dynamically.
Mermaid diagrams might not display consistently across all browsers, potentially causing issues for some users.
✅ Best Practice: Always test your diagrams in the browsers your audience uses most, such as Chrome, Firefox, and Edge. If you encounter rendering issues, export the Mermaid diagram to a PNG or PDF to ensure accessibility across all platforms.
Mermaid’s straightforward approach to creating diagrams makes it essential for simplifying complex ideas and organizing workflows. From mapping out processes to visualizing projects, it’s the kind of tool you’ll find yourself reaching for again and again.
Want to illustrate your workflows better? Integrate with ClickUp to generate diagrams, track progress, and collaborate with your team all in one place.
Dev teams can use it to map out architecture and workflows, project managers can track and manage tasks directly from their diagrams, and cross-functional teams can easily align across departments with clear, shareable visuals.
Sign up for ClickUp today to create Mermaid diagrams effortlessly!

© 2026 ClickUp

There’s an easier way. Try a free AI Agent in ClickUp that actually does the work for you—set up in minutes, save hours every week.