


Still downloading templates?
There’s an easier way. Try a free AI Agent in ClickUp that actually does the work for you—set up in minutes, save hours every week.
Sorry, there were no results found for “”
Sorry, there were no results found for “”
Sorry, there were no results found for “”
Now more than ever, accessing and tracking all of your work in one place is essential.
That’s where ClickUp Dashboards come in. Dashboards are the control center for all your projects—they enable you to instantly access real-time insights, track progress, and create clarity across your entire company.
Millions have already used ClickUp Dashboards to streamline workflows and provide birds-eye visibility into how work gets done.
Today, we’re excited to announce that ClickUp Dashboards are becoming even more powerful with the addition of new use cases, templates, and a Dashboard view that can be added anywhere in ClickUp for instant project insights.
Have you ever wished you could see your project’s progress with just a glance? Well, now you can with Dashboard views! It’s like having superpowers for your work.
With Dashboards as a view, you can take what you’re already working on and turn it into charts and graphs in just a few clicks—click add view, Dashboard view, and choose a Dashboard template. The view automatically pulls data from the tasks/fields you’re working in to create a Dashboard to visualize your work.

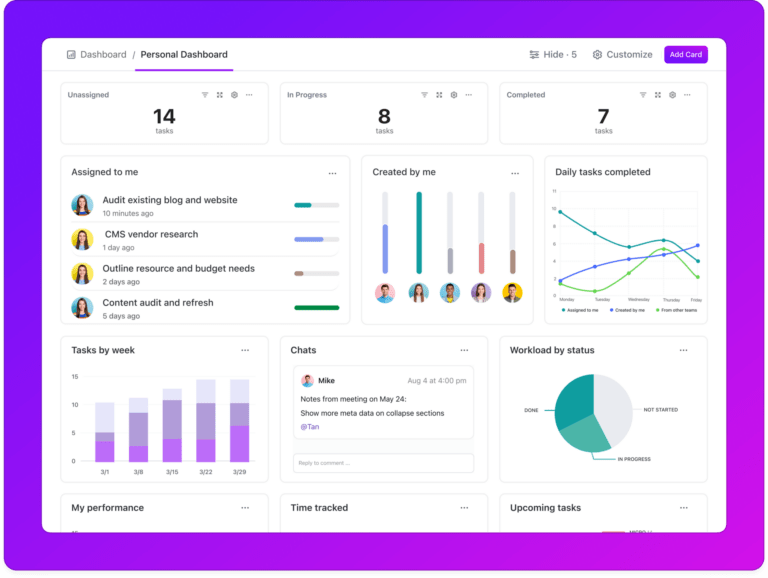
The Simple Dashboard is a great example of how you can dive into your personal productivity by adding a Dashboard as a view using a pre-built template. This will help you prioritize your tasks, track work progress, and focus on what matters most.
It’s your personal command center for an efficient, organized workflow.

Our pre-built Dashboard templates are just the start. Customizing your Dashboard view is as fun as playing with building blocks. With our card functionality, you can pick and choose exactly what information you want to display and how you want to display it.
Want to add new cards to track different aspects of your work? Go for it! Need to resize them to fit just right? You can do that too.
Choose from 40+ Dashboard cards to customize any Dashboard to your exact needs. Some of our most popular cards include:
The power of Dashboards is accentuated further when combined with the flexibility of our Task Types. Now, you can add analytics to any highly customized list created with Task Types.
Don’t know how you’d utilize a Dashboard in your line of work? Let us help! There are endless use cases that can optimize any job function.

The Project Management Dashboard is a great example. By adding this Dashboard template as a view on any project, you instantly see where there are risks or bottlenecks and which team members need help to move the project forward so that you can better focus your time.

The Client Portal Dashboard template is more than a communication channel—it’s a collaborative space that invites clients into the project process, which promotes transparency and partnership.
This Dashboard is the cornerstone of building trust and maintaining strong client relationships.

Another use case is for marketing teams. With this template, teams can create custom Marketing Campaign Dashboards to go beyond basic analytics.
It’s easier than ever to analyze campaign performance, audience engagement, and conversion tracking. This dashboard is an essential tool for fine-tuning marketing strategies and maximizing impact.

Additionally, customer success teams can create CRM and Retention Dashboards to provide a comprehensive view of customer health and highlight areas for improvement and potential growth.
This Dashboard is instrumental for identifying customer risks and nurturing long-term customer loyalty.

Want to get your sales team involved or provide them with an at-glance Dashboard for quick insights? Sales teams and business owners can create powerful Sales Dashboards to visualize sales data in real-time, allowing for quick identification of trends and opportunities.
This Dashboard is about celebrating wins and strategically pushing towards new sales goals.

Software teams get a boost with our pre-built Sprint Dashboard template, which sharpens sprint planning and tracking.
It offers a suite of metrics to guide your sprints toward successful completion, ensuring that your team stays agile and outcome-focused.
As you can see, great visibility leads to great success! The power of ClickUp Brain’s AI functionality only makes these dashboards better and easier to use.
With ClickUp Brain’s AI insights layered on top of your Dashboard, you essentially have a virtual data analyst at your disposal. You can ask any question about your project and ClickUp Brain will instantly search across all the data in your Dashboard to deliver the answer.

This feature reduces the need for manual data analysis and minimizes interruptions.
Incorporating AI insights into your ClickUp Dashboards means embracing a future where technology enhances human capabilities, making project management more efficient, more intuitive, and more impactful. With AI, you’re not just managing projects—you’re mastering them.
Bonus: Google Sheets Dashboards
I hope I’ve convinced you to give ClickUp Dashboards a try. No matter your role, Dashboards are a massive step towards achieving your most ambitious goals.
Dashboards and Dashboard Views are now available across all plans. Learn more here.

© 2026 ClickUp

There’s an easier way. Try a free AI Agent in ClickUp that actually does the work for you—set up in minutes, save hours every week.