Creating diagrams should be simple. If you can explain a workflow or system clearly in writing, you’d expect turning it into a visual to be quick and painless.
But that’s usually not how it goes.
You start with a written outline. Then you switch to a separate tool to build the flowchart or system diagram. Now you’re dragging in shapes, connecting steps, nudging boxes into place, tweaking layouts, and rewriting labels. What felt clear in text suddenly takes a lot more time and effort to turn into something visual.
And when something changes, you have to go through the whole thing all over again.
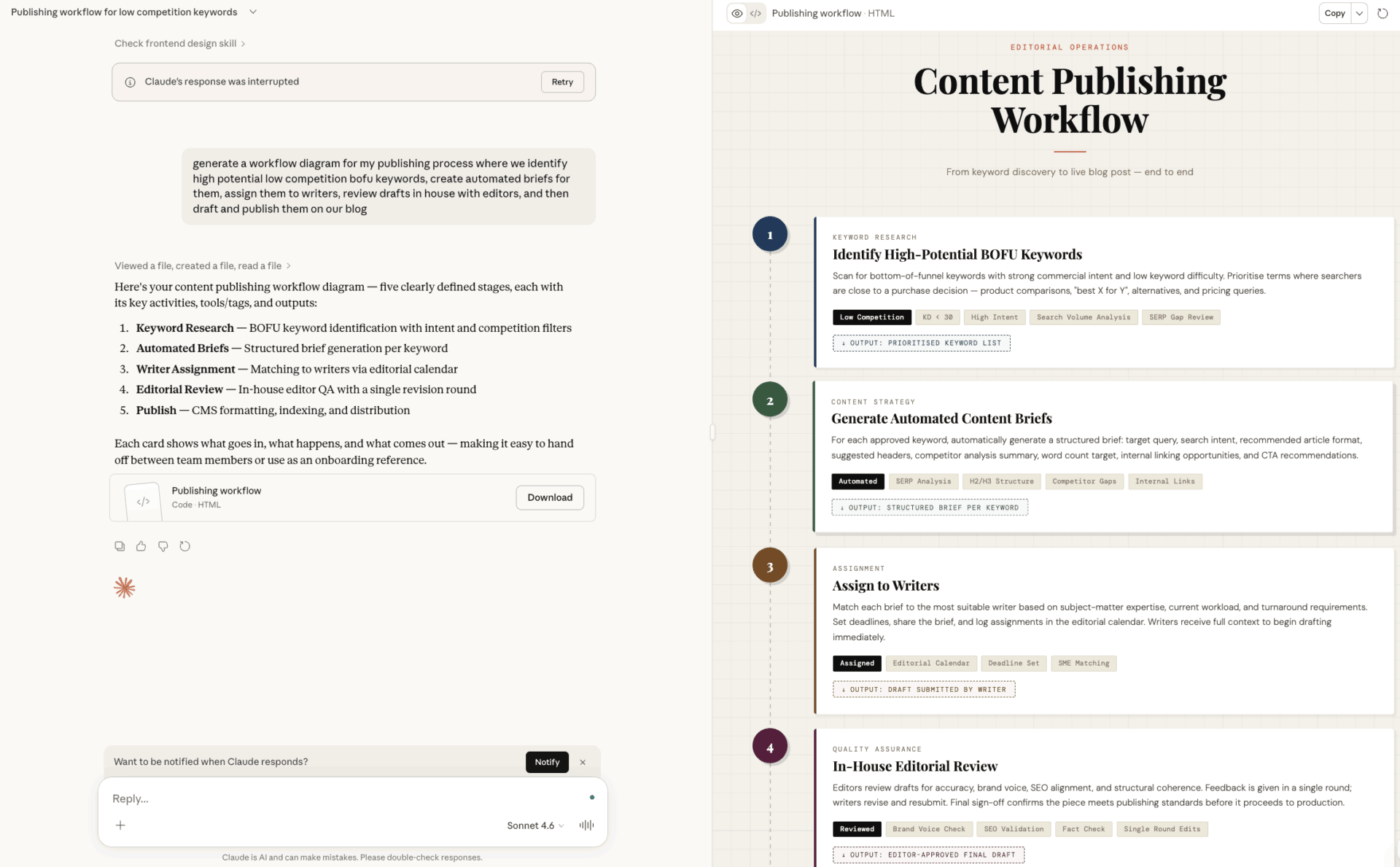
AI tools like Claude can simplify this by turning structured descriptions from your prompts into flowcharts, sequence diagrams, or system maps. In this guide, we’ll look at how to create diagrams with Claude and how creating visuals inside ClickUp’s converged workspace helps keep them aligned with your projects as they evolve. ✨
How to Create Diagrams with Claude: Complete Guide
Summarize this article with AI
ClickUp Brain not only saves you precious time by instantly summarizing articles, it also leverages AI to connect your tasks, docs, people, and more, streamlining your workflow like never before.
Summarize this article for me please
Why Use Claude as an AI Diagram Generator
Creating diagrams manually pulls skilled people away from real work. Engineers end up arranging shapes on a canvas instead of building systems. Project managers lose hours polishing visuals instead of keeping workflow documentation accurate and up to date.
Claude changes that dynamic.
As an AI diagram generator, Claude turns plain-text descriptions into structured diagram code. Instead of navigating complex diagramming interfaces, you simply describe the system in natural language. Claude then generates render-ready output in formats such as Mermaid, PlantUML, and SVG.
That alone saves time. But what makes Claude especially useful is how it handles ambiguity.
If your description isn’t perfectly clear, Claude also asks you clarifying questions. That back-and-forth makes it much more reliable than tools that try to auto-generate visuals from minimal input.
Here are a few ways you can use Claude for diagramming:
Turn your system descriptions into structured diagrams
Work with technical formats like sequence diagrams and architecture diagrams
Iterate quickly without losing context
Of course, AI diagrams still follow a simple rule: unclear inputs lead to unclear outputs. That’s why organizing your thinking before prompting the AI matters.
💡 Pro Tip: If your diagram starts off as messy meeting notes, clean them up first with ClickUp Brain (the built-in context-aware AI inside your ClickUp workspace). Paste the notes into a ClickUp Doc or task comment and @mention Brain to extract components, dependencies, and process steps.
In a few seconds, Brain converts scattered notes into a structured outline (systems, actors, flows). You can then copy that clean structure directly into Claude to generate a much more accurate architecture or workflow diagram.
Stop asking AI questions in isolation. Embed it into your workspace using ClickUpBrain
📮ClickUp Insight: 62% of our respondents rely on conversational AI tools like ChatGPT and Claude. Their familiar chatbot interface and versatile abilities—to generate content, analyze data, and more—could be why they’re so popular across diverse roles and industries. However, if a user has to switch to another tab to ask the AI a question every time, the associated toggle tax and context-switching costs add up over time—especially when workers are interrupted every 2 minutes on average during prime focus hours.
Not with ClickUp Brain, though. It lives right in your workspace, knows what you’re working on, can understand plain text prompts, and gives you answers that are highly relevant to your tasks! Experience 2x improvement in productivity with ClickUp!
Summarize this article with AI
ClickUp Brain not only saves you precious time by instantly summarizing articles, it also leverages AI to connect your tasks, docs, people, and more, streamlining your workflow like never before.
Summarize this article for me please
What Types of Diagrams Can Claude Create?
You usually know when you need a diagram. The problem is choosing the right one.
Most teams default to whatever feels familiar—a quick flowchart, a rough box-and-arrow sketch—hoping it will do the job. But when the diagram doesn’t match the problem, it hides important dependencies, oversimplifies decisions, and slows down reviews because everyone ends up interpreting the visual differently.
Claude helps by supporting the diagram types teams actually use, so you’re not forcing complex ideas into the wrong format. Instead of starting from a blank canvas, you describe what you’re trying to explain, and Claude generates a structured visual that fits the situation.
🧠 Fun Fact: In their study, Bradford and Bharadwaj found that whiteboard animation can be a really engaging and culturally respectful way to share traditional knowledge — helping communities connect with important stories and ideas in a more visual, accessible format.
Here’s how the most common diagram types tend to show up in practice:
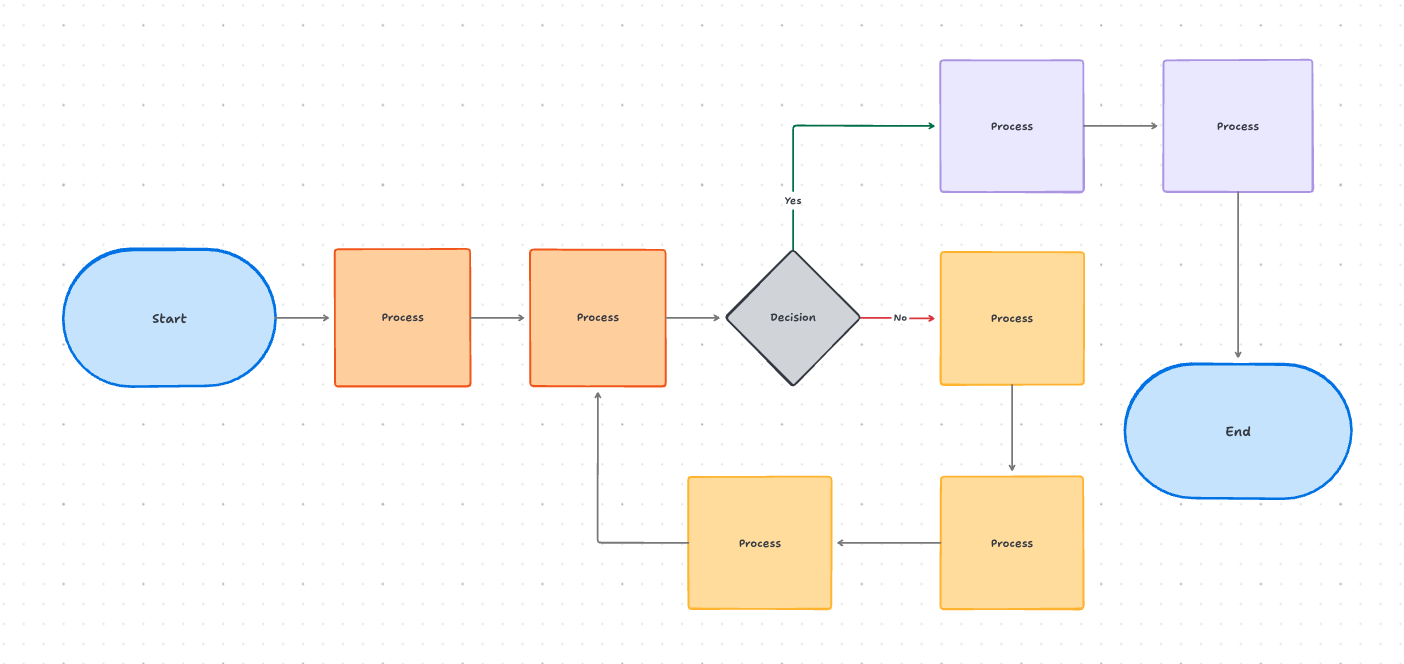
Flowcharts and process maps
Flowcharts are helpful when you want to show how a process moves from one step to the next. They make decision points visible and help you see exactly what happens when conditions change. And if you need a broader view, process maps take it a step further by showing how work moves between people, systems, or teams.
You’ll often use these visuals for onboarding, approvals, or operational workflows—anywhere unclear handoffs can slow things down.
💡 Pro Tip: A great way to conceptualize your diagram before generating it with AI is the ClickUp Flowchart Diagram Template. It provides a ready-made whiteboard layout with shapes, connectors, and visual sections to map processes, decision points, and system flows.
Turn your list of systems, actors, and workflows into a clear flowchart with the ClickUp Flowchart Diagram Template
Instead of starting with a blank canvas, you can quickly outline steps, dependencies, and branching logic. This makes it easier to validate how a workflow actually moves from one stage to the next—so when you later generate a diagram with AI, the structure is already clear and logically organized.
🎥 Bonus: Get our best tips on creating a process maps using AI here:
Architecture and system diagrams
Architecture diagrams help you and your team get aligned on how all the pieces of a system fit together. They show components, connections, and data flows in a way that makes even complex setups easier to understand—and easier to talk about.
If you’re on a technical team, you might use them to document your cloud infrastructure or map out how different services interact. If you’re on a business team, they can help you see how tools connect and how data moves across your organization.
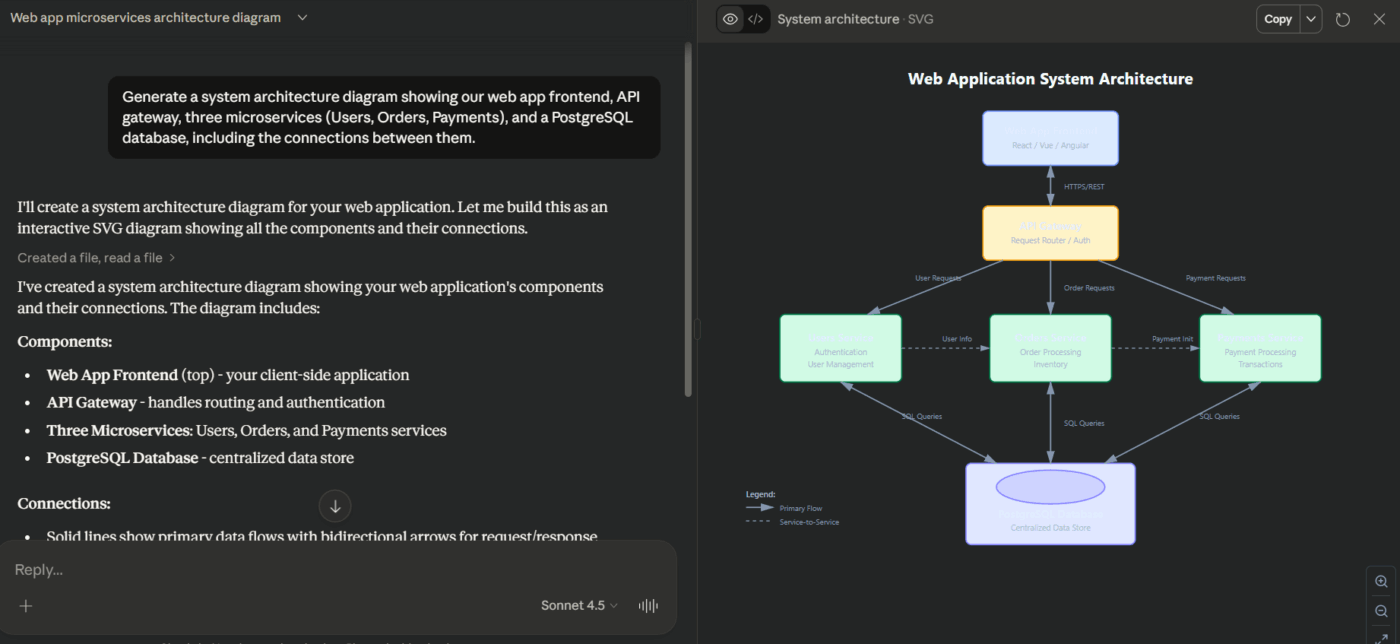
With Claude, you can generate several types of technical diagrams, including C4 model diagrams for software architecture, AWS infrastructure visuals, and entity-relationship diagrams for your databases.
🛠️ Give it a prompt such as: “Generate a system architecture diagram showing our web app frontend, API gateway, three microservices (Users, Orders, Payments), and a PostgreSQL database, including the connections between them.”
Sequence diagrams help you see how interactions unfold over time, making them really handy for charting user authentication flows, API calls, and background processes.
Claude handles sequence diagrams particularly well because they follow clear, predictable rules, often in Mermaid syntax. If you describe the interactions, participants, and message flow clearly, Claude can turn that structure into an accurate visual with very little effort on your part.
Organizational charts
Org charts can get outdated fast as your team changes and responsibilities shift. Manually updating them usually ends up at the bottom of your to-do list. Claude makes it easier for you by generating org charts directly from simple role or team descriptions.
via Claude
Summarize this article with AI
ClickUp Brain not only saves you precious time by instantly summarizing articles, it also leverages AI to connect your tasks, docs, people, and more, streamlining your workflow like never before.
Summarize this article for me please
Step-by-Step Guide to Creating Diagrams with Claude
Instead of relying on trial and error, you can break the diagramming workflow in Claude into three simple stages: describe the system clearly, generate the diagram in the right format, and refine it until it accurately shows how the work really happens.
Step 1: Write a clear system description
The quality of your diagram depends entirely on how well you structure your prompt for Claude.
When you’re writing your description, focus on four key things:
Components: List every element that should appear in your diagram, like the user, database, API, or payment service
Relationships: Explain clearly how these components connect or interact. For example, “The user sends data to the API” or “The API queries the database”
Flow direction: Specify if the diagram should follow a certain sequence, hierarchy, or direction, like top-to-bottom or left-to-right
Scope boundaries: Define what’s included in the diagram and what’s not, so it stays focused and easy to follow
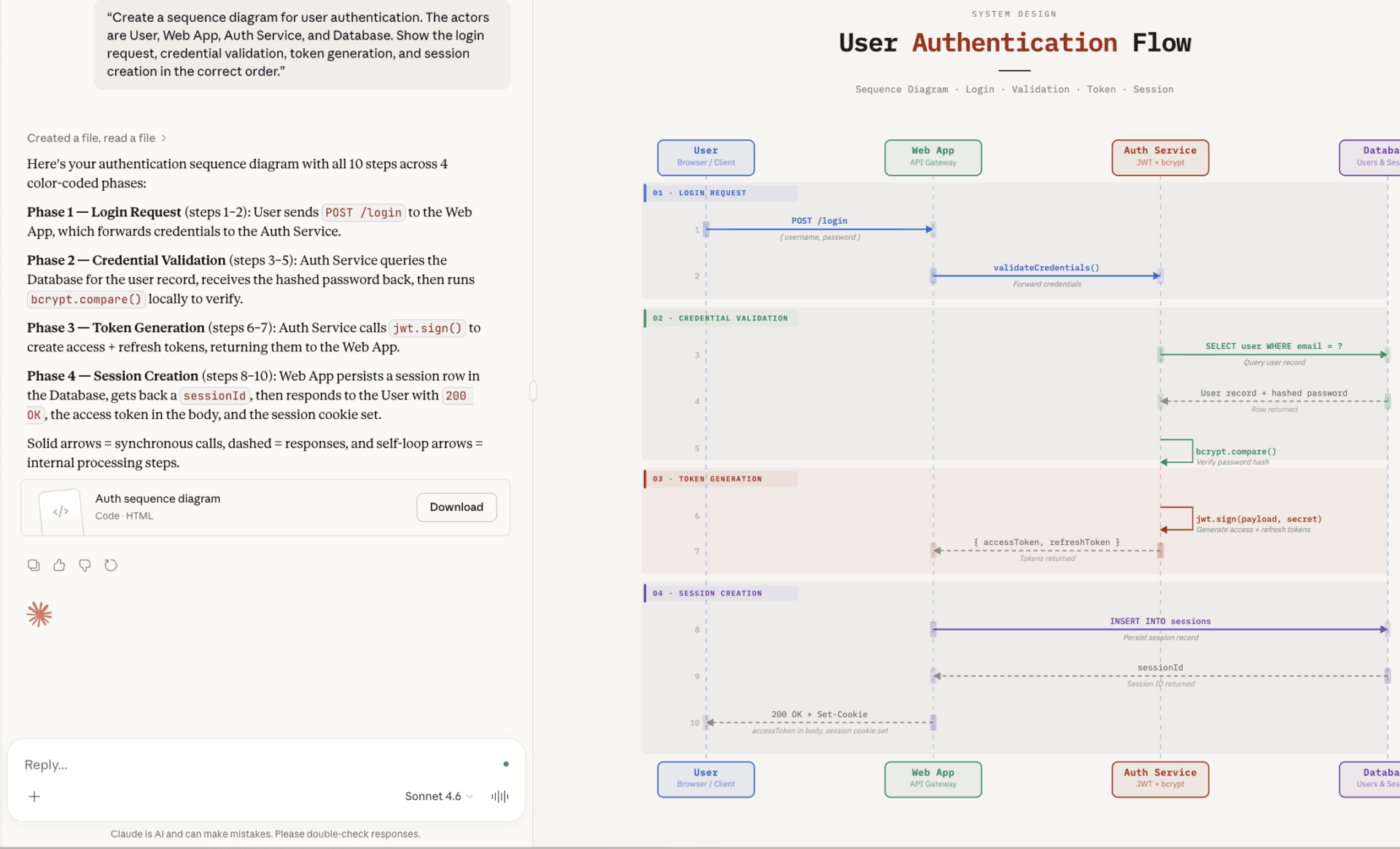
📌 Instead of a vague prompt like “make a diagram of our login system,” you could say: “Create a sequence diagram for user authentication. The actors are User, Web App, Auth Service, and Database. Show the login request, credential validation, token generation, and session creation in the correct order.”
via Claude
🧠 Fun Fact: Structured prompts improve AI accuracy from 0% to 90% on complex reasoning tasks, according to research on prompt engineering techniques.
Step 2: Prompt Claude for diagram code
Once you’ve got your system description ready, the next step is to ask Claude to generate the diagram code. At this stage, the key thing is to be clear about the output format, because that decides how and where your diagram will actually be displayed.
Format
Best for
Rendering options
Mermaid
Flowcharts, sequences, org charts
Mermaid Live, GitHub, Notion
PlantUML
Complex UML, class diagrams
PlantUML server, IDE plugins
SVG
Custom graphics, logos
Any browser, design tools
Different output formats for diagram codes
For most use cases, a direct and specific prompt works best.
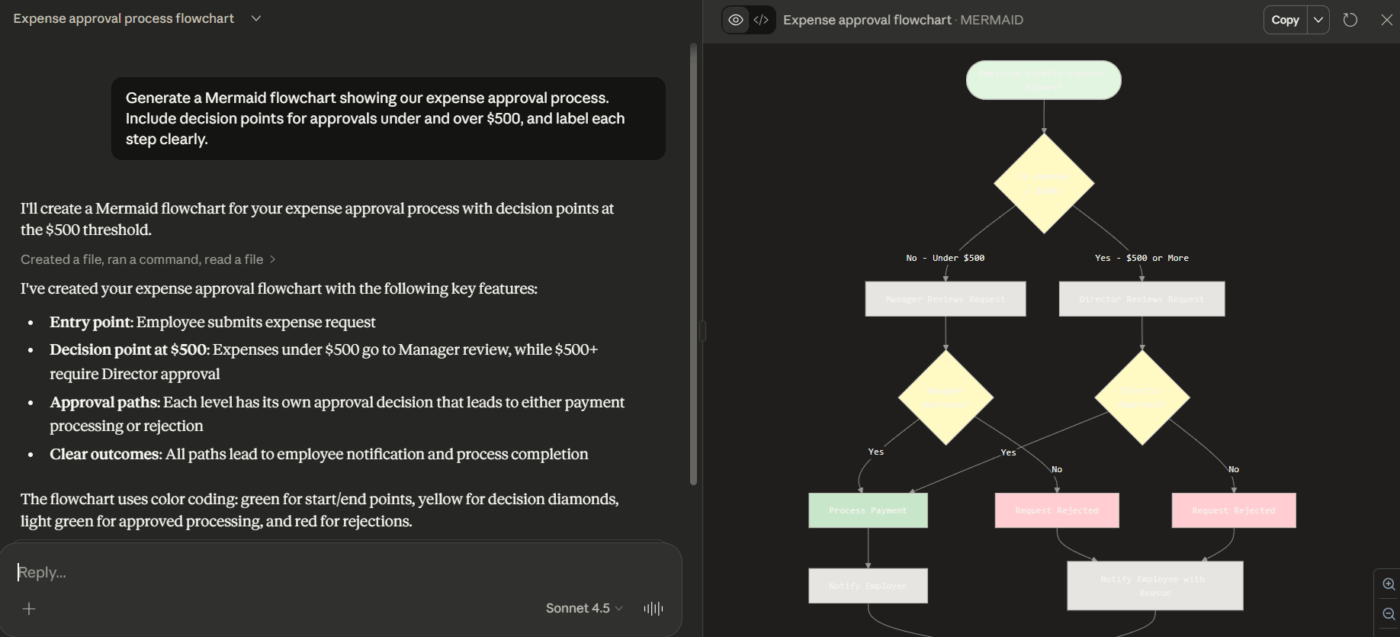
🛠️ Give it a prompt such as: “Generate a Mermaid flowchart showing our expense approval process. Include decision points for approvals under and over $500, and label each step clearly.”
Here is what the output looks like:
via Claude
It can help to ask Claude to give a quick explanation of the code it generates, especially if you plan to edit or expand the diagram later. This makes the output easier for you to understand and simpler to share with teammates who aren’t familiar with diagram-as-code formats.
Step 3: Export and refine your diagram
The first version of a diagram is rarely the one you’ll stick with. One of the best things about Claude is that it can refine its outputs through conversation. Since it remembers the context, you can ask for changes without starting from scratch or rewriting the whole prompt.
Some common ways to refine your diagram include:
🛠️ “Make the flowchart horizontal instead of vertical”
🛠️ “Add color coding to distinguish user actions from system actions”
🛠️ “Group these three components into a subgraph labeled ‘Backend Services'”
Once your diagram is ready, the next challenge is keeping it connected to the work it actually represents. Diagrams that sit in your downloads folder or in separate tools can get outdated fast, especially as systems and processes change.
This kind of fragmentation also means more context switching for you and your team, which slows everyone down and makes it harder to keep documentation aligned with reality.
💡 Pro Tip: Don’t let your diagrams live in isolation. With ClickUp Whiteboards, you can embed flowcharts and diagrams directly inside ClickUp Tasks or Docs, keeping them connected to the actual work they represent.
This is where ClickUp’s Converged AI Workspace becomes useful. Instead of managing diagrams in one tool and execution in another, you can brainstorm the workflow in a Whiteboard, embed it into a Doc for documentation, and link it to tasks where the work actually happens.
The result: diagrams stay visible, contextual, and easier to update as processes evolve—without forcing your team to jump between multiple tools.
Summarize this article with AI
ClickUp Brain not only saves you precious time by instantly summarizing articles, it also leverages AI to connect your tasks, docs, people, and more, streamlining your workflow like never before.
Summarize this article for me please
Best Diagram Tools to Use with Claude
Claude can generate clear, structured diagram code, but that’s only half the battle. To actually use it, you need a tool that can turn the code into a clear, shareable visual. Without the right tool, even correct code can feel stuck, leaving you jumping between apps or spending extra time tweaking diagrams manually.
Rendering tools fix this by turning your diagram code into visuals that are easy to understand and collaborate on.
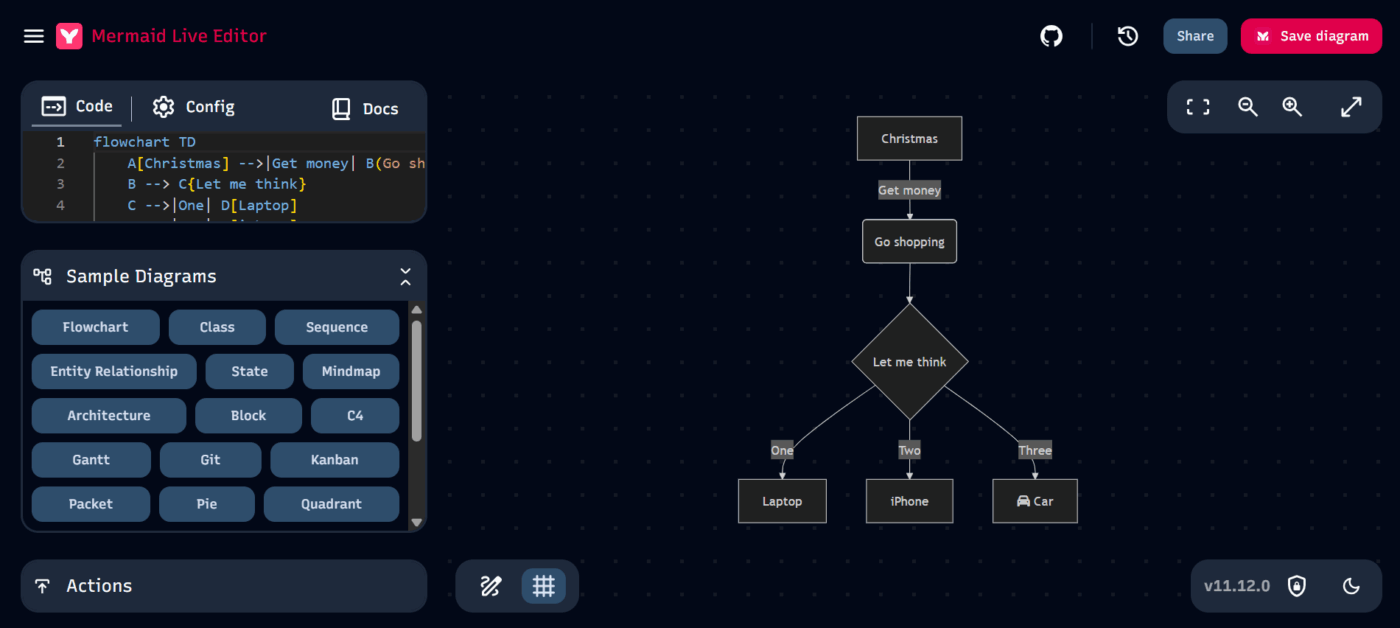
1. Mermaid Live Editor
For many business and project management diagrams, the Mermaid Live Editor is one of the easiest places to start. It’s free, browser-based, and doesn’t require an account. You paste the code generated by Claude, see a live preview, and export the diagram as PNG, SVG, or Markdown-compatible code.
Its fast preview loop makes it useful for quickly testing ideas or refining structure before sharing diagrams with others.
One limitation is collaboration. The Live Editor itself is mainly designed for individual editing, so it doesn’t offer built-in real-time collaboration features.
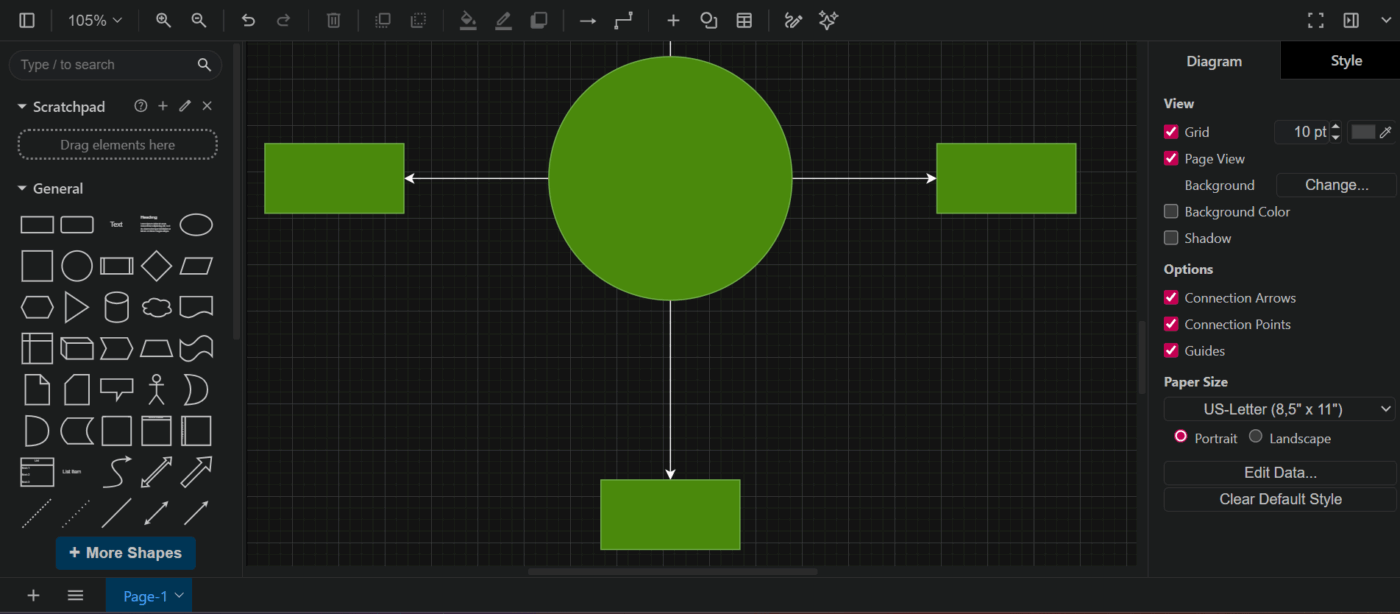
2. Draw.io for XML diagrams
If you want more control, Draw.io (also called diagrams.net) is a solid choice. While Claude doesn’t reliably generate full Draw.io XML diagrams in every case, it can generate structured diagram logic or Mermaid code that you can recreate or import workflows from inside Draw.io.
Draw.io gives you much deeper customization, including:
Extensive shape libraries
Fine-grained layout control
Custom icons and connectors
Layered diagrams
It also integrates with Google Drive, OneDrive, GitHub, and Confluence, and offers a desktop version for offline use. That makes it a good fit for teams that need polished diagrams or standardized architecture visuals.
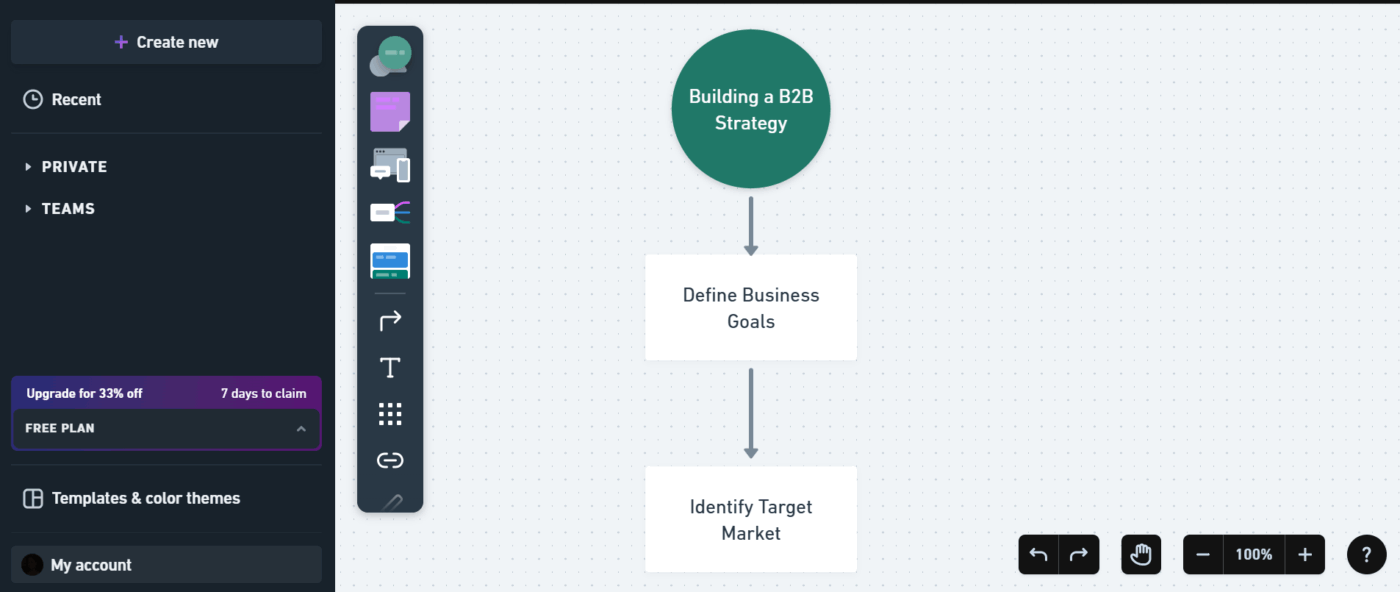
3. Whimsical and other visual tools
If you need real-time collaboration, tools like Whimsical, Lucidchart, and Miro can be really helpful. Many of them now let you import Mermaid diagrams, so you can start with a Claude-generated diagram and keep editing it with your team. These platforms also add features like commenting, version history, and shared templates, which makes collaborating much easier.
The downside is that using multiple platforms can lead to Work Sprawl. Your diagrams, discussions, and updates might end up scattered across different apps, slowing you down and causing confusion.
🔍 Did You Know? 48% of employees describe their work as chaotic due to constant app-switching between diagramming tools, docs, and chats.
Over time, that makes it harder to keep diagrams aligned with the systems and workflows they represent.
📮ClickUp Insight: 1 in 4 employees uses four or more tools just to build context at work. A key detail might be buried in an email, expanded in a Slack thread, and documented in a separate tool, forcing teams to waste time hunting for information instead of getting work done. ClickUp converges your entire workflow into one unified platform. With features like ClickUp Email Project Management, ClickUp Chat, ClickUp Docs, and ClickUp Brain, everything stays connected, synced, and instantly accessible. Say goodbye to “work about work” and reclaim your productive time.
💫 Real Results: Teams are able to reclaim 5+ hours every week using ClickUp—that’s over 250 hours annually per person—by eliminating outdated knowledge management processes. Imagine what your team could create with an extra week of productivity every quarter!
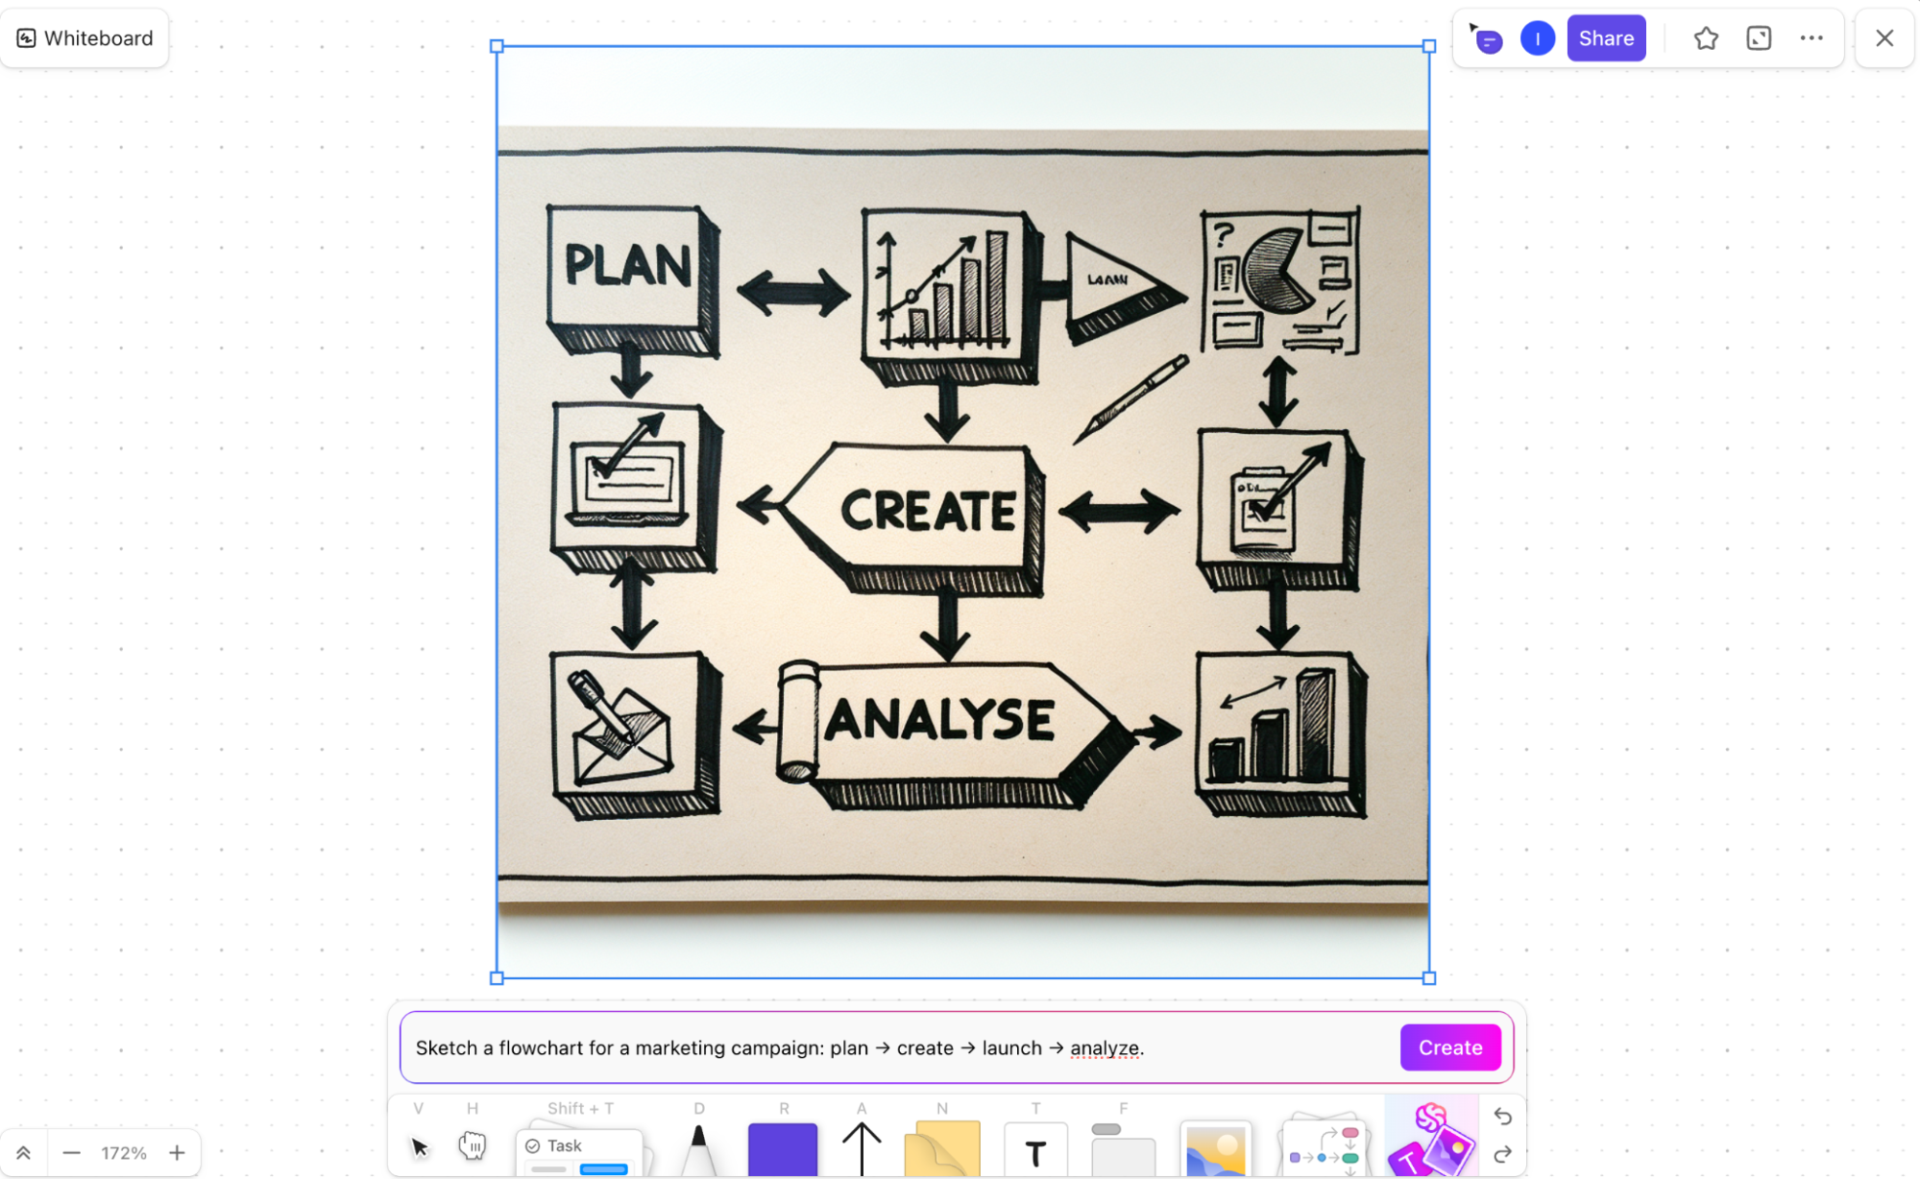
If you want to keep diagrams connected to the work they represent, ClickUp Whiteboards offer a different approach. Instead of exporting diagrams into separate tools, you can build, refine, and share them inside the same workspace where your projects, docs, and tasks already live.
Whiteboards let teams visually map workflows, system flows, and processes using shapes, connectors, and sticky notes. You can also convert elements on the board directly into tasks, which makes it easier to move from planning to execution without rebuilding the structure elsewhere.
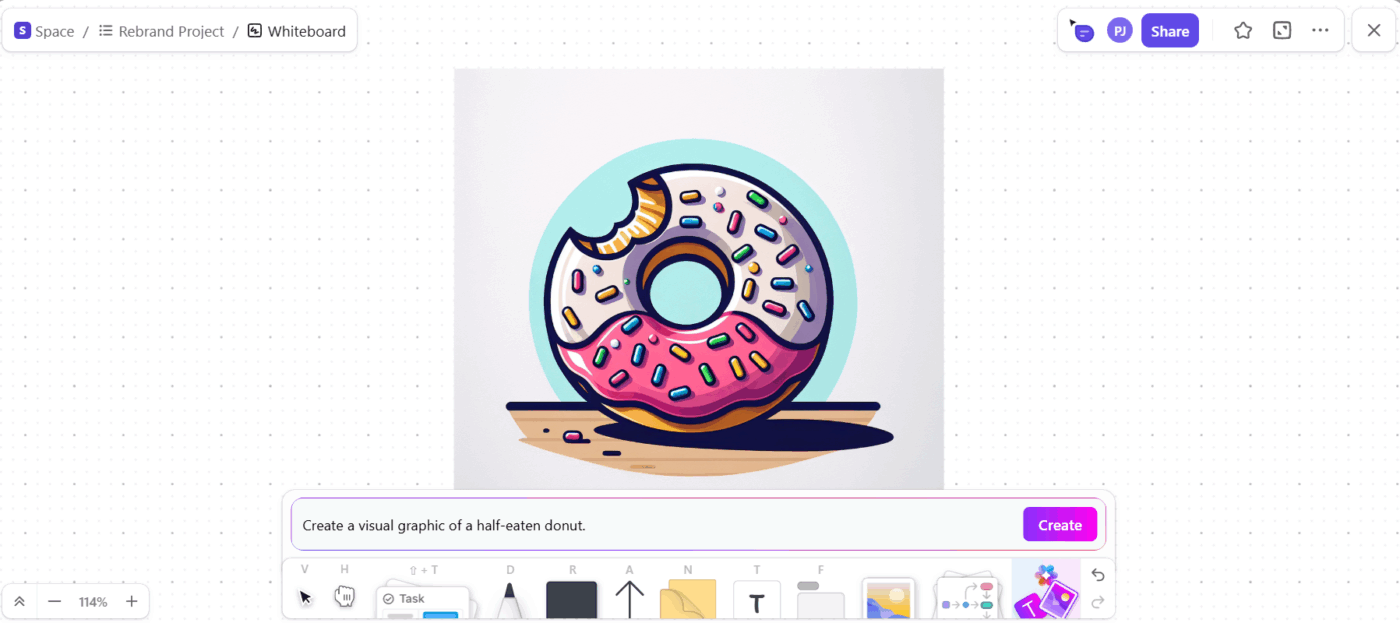
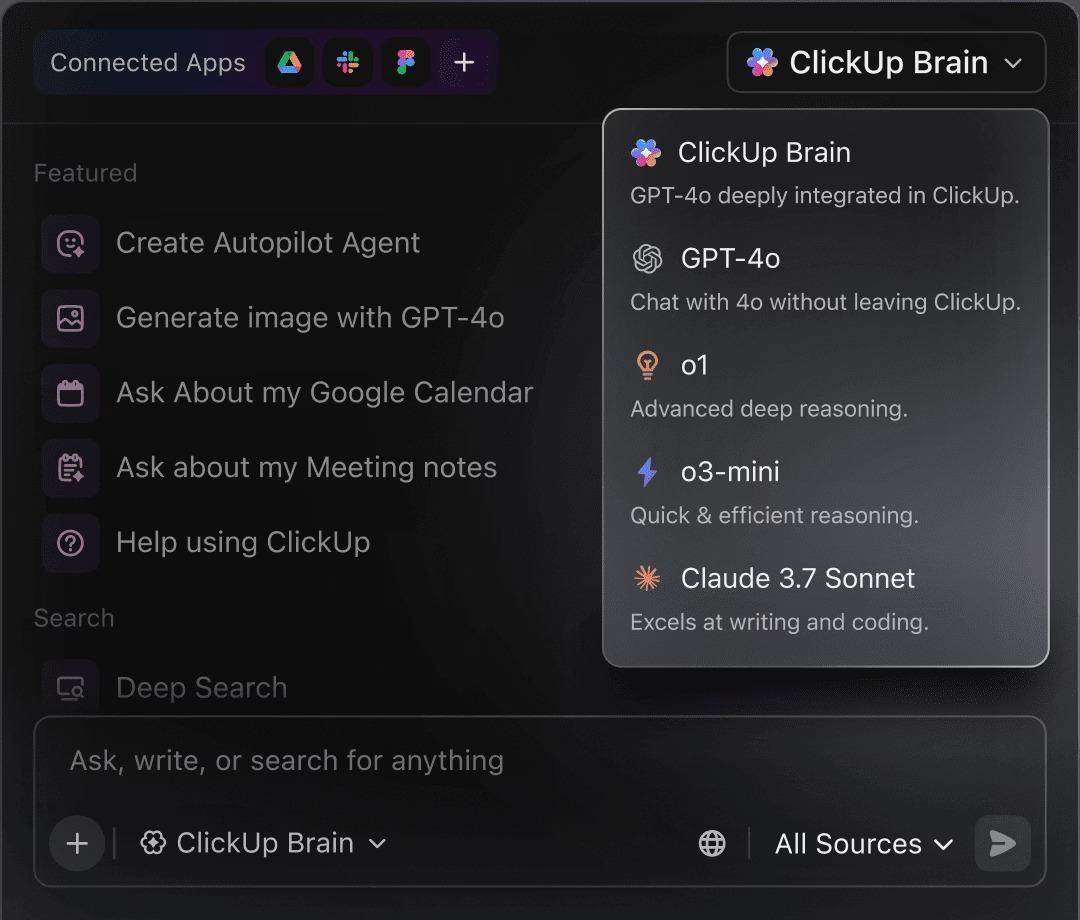
Another advantage is built-in AI. With ClickUp Brain, you can generate AI-powered images or visual concepts directly inside a Whiteboard.
Generate AI images inside ClickUp Whiteboards and connect them to your actual work
🧠 Fun Fact: ClickUp Brain supports multiple AI models—including Claude—so you can prompt the AI to create visual assets or conceptual diagrams without leaving your workspace.
Summarize this article with AI
ClickUp Brain not only saves you precious time by instantly summarizing articles, it also leverages AI to connect your tasks, docs, people, and more, streamlining your workflow like never before.
Summarize this article for me please
How to Export and Share Claude Diagrams
Creating a diagram in Claude is just the first step. Sharing it effectively and keeping it up to date is what really makes it useful. Sending a static PNG might feel quick, but as soon as your system or processes change, that image becomes outdated. Without a consistent approach, version control breaks down and your documentation quickly loses its reliability.
Choosing the right format and sharing method helps keep your visuals accurate and relevant. Here are three common approaches:
Static sharing: Export PNG or SVG files for presentations, non-editable documents, or emails when you just need a simple image
Embedded sharing: Use a Markdown code block for documentation sites, GitHub repositories, or Notion pages where the diagram can render live
Collaborative sharing: Import the diagram into a shared team tool so you can edit, comment, and update it in real time
💡 Pro Tip: Always save the original Claude conversation or the generated code alongside your exported image. When processes or systems change, regenerate the diagram with an updated prompt instead of modifying an old image. This is faster, reduces errors, and keeps your team aligned.
Summarize this article with AI
ClickUp Brain not only saves you precious time by instantly summarizing articles, it also leverages AI to connect your tasks, docs, people, and more, streamlining your workflow like never before.
Summarize this article for me please
Turn Documentation into a Living Workflow
Diagrams, notes, and project plans only help if they’re easy to access, up to date, and tied directly to the tasks and processes you’re working on. When information is scattered across different tools, you end up hunting for context, and version control quickly becomes a headache.
ClickUp makes it simple to keep everything together. With ClickUp Docs, ClickUp Tasks, ClickUp Whiteboards, and ClickUp Brain in one workspace, your team can create, update, and track documentation alongside the projects it supports.
Everything stays linked, changes stay visible, and you spend less time searching and more time getting work done.
Summarize this article with AI
ClickUp Brain not only saves you precious time by instantly summarizing articles, it also leverages AI to connect your tasks, docs, people, and more, streamlining your workflow like never before.
Summarize this article for me please
Frequently Asked Questions (FAQs)
Can Claude generate diagrams for project management workflows?
Yes, Claude is excellent for creating diagrams for project management workflows, such as flowcharts for approval processes, Gantt-style timeline visualizations using Mermaid syntax, and dependency diagrams that show how tasks connect.
How does Claude compare to dedicated AI flowchart generators?
Claude offers more flexibility for understanding complex, nuanced requirements through conversation, while dedicated tools often provide a more polished visual output with drag-and-drop editing features.
What are the limitations of using Claude for automated diagram creation?
Claude only generates code, not rendered images, so it requires a separate rendering tool. It also cannot access external data to auto-generate diagrams from live systems.
Can I use Claude-generated diagrams in collaborative diagramming tools?
Most modern collaborative tools such as Miro, Lucidchart, and Notion accept Mermaid code imports, allowing you to bring your Claude-generated diagrams into a shared team environment.
Everything you need to stay organized and get work done.