Created by mechanical engineer and management consultant Henry Gantt in the 1910s, Gantt charts were initially used to record the progress of production processes and were focused on the start and end dates of operations.
Today, Gantt charts are indispensable project management tools. They are dynamic, flexible, and comprehensive, allowing you to observe your project’s timeline and make real-time changes in seconds.
In this article, we’ll show you how to create a Gantt chart in ClickUp, an award-winning task and project management tool. We’ll also walk you through the features, best practices, and common uses of Gantt charts to help you conquer the project management world. 🌍
- What Is a Gantt Chart?
- ⭐ Featured Template
- Features of a Gantt Chart
- Gantt Chart Best Practices
- How to Create a Gantt Chart in 8 Steps
- How to Add a Gantt Chart to an Existing Space in ClickUp
- Gantt Chart Templates for Project Management
- What Types of Projects Benefit from Gantt Charts
- How Different Teams Use Gantt Charts
- When to Avoid Using Gantt Charts
- Common Gantt Chart FAQs
What Is a Gantt Chart?
A Gantt chart is one of the most popular tools for visualizing work that supports various project management techniques and methodologies. You use it to plan, manage, and monitor the project timeline and schedule, ensuring your project is moving in the right direction.
⭐ Featured Template
Gantt charts feel overwhelming? Try ClickUp’s free Simple Gantt Template to plan clearly and stress less.
Every Gantt chart has two axes—a vertical axis and a horizontal axis. The vertical one lists all your tasks, while the horizontal one represents the timeline. The length of the horizontal task bars reflects the duration of each activity.
Besides visualizing the time it takes to complete every task, Gantt charts illustrate task dependencies, highlighting relationships where a task depends on another’s completion. This helps you identify and eliminate bottlenecks to ensure the orderly progression of tasks. ✨
Features of a Gantt Chart
Reading a Gantt chart can feel like trying to solve the world’s biggest mysteries, especially if you have just entered the project management world.❓
Fortunately, Gantt charts have a universal structure—once you learn it, you’ll have no trouble deciphering even the most complex projects.
Here are the essential components of Gantt charts:
- Task list: A vertical list of all tasks sits on the left side of the Gantt chart. The list is typically color-coded for easier navigation
- Timeline: A specific period your Gantt chart observes. Depending on the level of detail you want to visualize and the project’s complexity, it can display days, weeks, months, or even years
- Bars: Horizontal bars representing your tasks and their duration and progress. You can get info on the duration of each task at a glance just by looking at the bars’ lengths. As you make progress with your tasks, your bars will become more and more shaded
- Arrows: They indicate dependencies and tell you the specific order of certain tasks
- Diamonds: Used to mark project milestones, which are nothing but significant points indicating the completion of a critical project phase
- Assignees: Depending on the project management tool you’re using, you’ll see a small picture or initials of the assignee for a specific task on the right side of the task bars. This helps with resource allocation and ensures even workloads
- Date line: A vertical line indicating the current date so you can quickly identify upcoming tasks
- Progress bar: A horizontal bar between the timeline and task bars showing the progress of the entire project
- Critical path: The longest task sequence you need to complete to execute a project
Gantt Chart Best Practices
Gantt charts can be a powerful weapon in your project management arsenal if you know how to use them properly. Here are a few hacks that will help you get the most out of your Gantt chart:
- Segment large tasks: Large tasks are a pain to manage and visualize. To overcome this problem, break them up into smaller tasks and subtasks so that you can accurately allocate time and create a detailed project schedule. It’s a good idea to use a work breakdown structure (WBS) or mind maps to visualize all tasks
- Account for dependencies: Use dependencies to define the order of task completion and create relationships between your tasks. That way, you’ll get an in-depth view of the project timeline and understand how tasks relate to one another
- Consider non-working days: Your project team doesn’t work 24/7. When creating your Gantt chart, it’s crucial to take into account non-working days, like weekends and public holidays, and your team’s pre-scheduled time off. Include these in your Gantt charts to ensure your schedule and project timeline are on point
- Take advantage of colors: Besides their aesthetic effect, colors are an essential element of every Gantt chart because they help you differentiate between tasks, activities, milestones, or assignees. Use colors to indicate a task’s status or priority and differentiate info at a glance
- Use a quality task and project management tool: All-in-one platforms like ClickUp help you create and manage Gantt charts, make real-time changes, and collaborate and communicate with your team to streamline work. With ClickUp, project managers can easily schedule project tasks, track progress, prioritize, and adjust to unexpected circumstances on the fly
Bonus read: Check out the best project timeline software in 2024!
How to Create a Gantt Chart in 8 Steps
You don’t have to jump through hoops to create Gantt charts—if you use the right project management tool.
ClickUp stands out from other project management platforms due to its unique features that let you centralize work, minimize context switching, and gain an in-depth view of all your projects at all times. It will help you lay the perfect foundation for your Gantt chart and seamlessly adjust to potential changes. 💪
Let’s see how you can create your own ClickUp Gantt chart in eight easy steps.
Tip: If you’re more of a visual type, check out our video tutorial on maximizing ClickUp Gantt charts to manage tasks and dependencies effortlessly.
Step 1: Outline the project
Your first step toward creating an effective Gantt chart is defining your project to gain a clear understanding of its purpose. If you aren’t familiar with your project scope, goals, key deliverables, or available resources, there’s a high chance that important tasks will fall through the cracks and lead to delays, misunderstandings, and even project failure.
ClickUp has a number of options to help you gather and centralize all project info. For example, you can use ClickUp Goals to define your objectives and create targets to track progress. Organize your Goals into folders for added convenience and easier tracking. 🥰

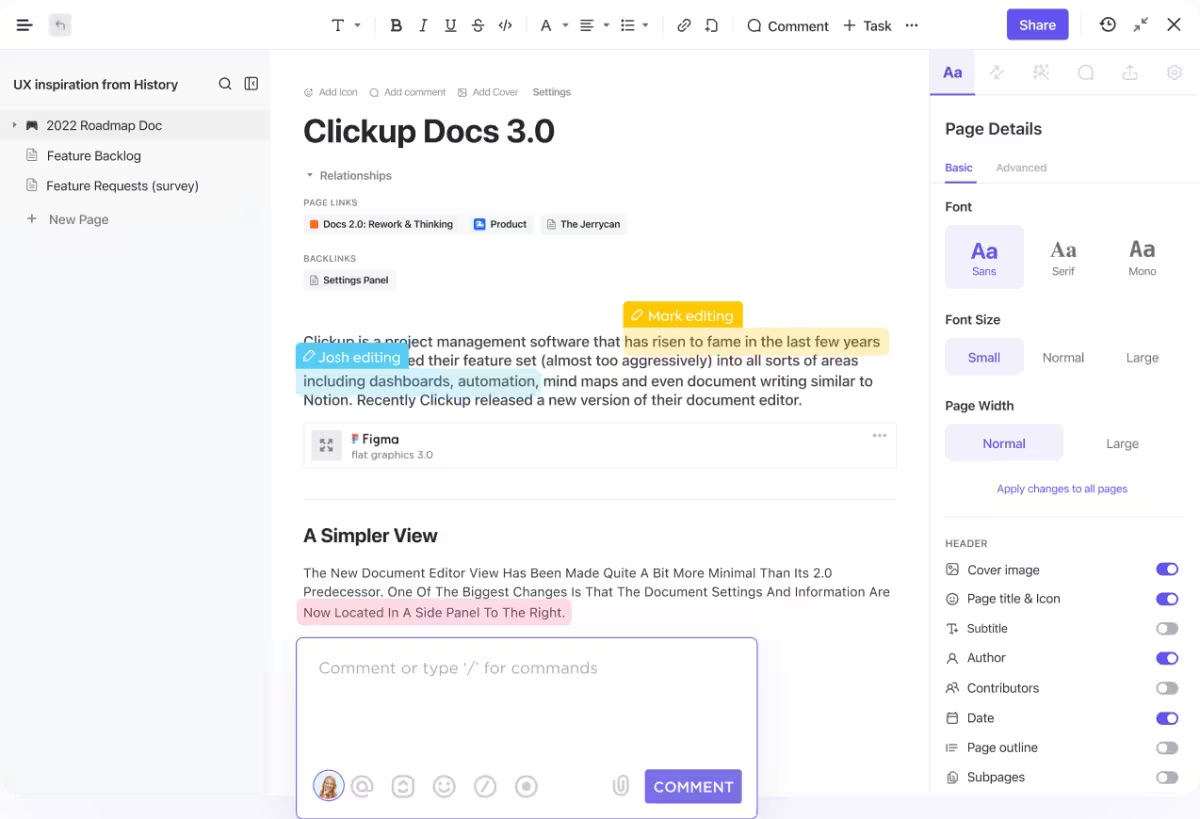
ClickUp Docs is another helpful feature—you can use it to document all project details. Add relevant team members to your Docs and allow them to contribute to their creation. Every person gets a cursor with their name so that the entire team can work together simultaneously without issues. All changes are displayed in real time.
Step 2: List all your tasks
Think about the tasks and activities you must complete to deliver your project and list them. Split huge tasks into several smaller ones and create subtasks to organize activities.
Don’t bother with the proper order yet; just jot down every task you think of.
The perfect feature for organizing tasks is the ClickUp List view, one of the platform’s 15+ views and the only one you get by default in all ClickUp Spaces, Folders, and templates.
Let’s see how to use the List view and create a Space for your Gantt chart at the same time:
- Go to your Workspace and select the plus sign next to Spaces on the right side of the screen
- Choose a name for your new Space and provide a description. Use something recognizable, like Gantt chart folder for my X project
- Select the desired color and avatar for your Space
- Choose the ClickApps you want to use (ClickApps are features you use to customize workflows). Some come by default, like Custom Fields, Priority, or Time Tracking, but you can choose additional ones if you want
- Select the views you want in your Space. In this case, you want a Gantt chart, so you’ll switch the toggle next to it and create the Space
- The List view will be automatically generated, and your Space should look like this

Step 3: Provide details about your tasks
ClickUp has a unique feature called Custom Fields, which allows you to provide details about each task you add to your newly created Space. You can use them to add dates, priority levels, assignees, or progress rates.
Our List view has three fields by default—Assignee, Due date, and Priority. Since a Gantt chart requires start dates for each task, you’ll add the extra column, and here’s how:
- Press the plus sign on the right of the Priority field
- Type Start date in the search box and select it
- Move the Start date column before the Due date column for easy navigation and convenience. ClickUp features a drag-and-drop editor, so all you need to do is click and hold the Start date column and drop it before the Due date
- Fill in the Custom Fields. Provide your tasks’ start and due dates, add assignees, and determine priorities (if you want). In our example, we created five tasks revolving around software testing and launch

Step 4: Create your Gantt chart
In ClickUp, the Gantt chart is one of the multiple project views that allow you to see your tasks from different angles. We’ve already added this view when we created our Space, so the only action left is pressing Gantt at the top of the screen.
In case you didn’t add the Gantt chart view when creating the Space, here’s how to do it now:
- Select +View from the toolbar at the top of the screen
- Select Gantt and press Add Gantt

Once you open the Gantt chart view, you’ll see this:

Don’t worry; it’s not a mistake—just press the small arrow on the left of List, and ClickUp will generate your Gantt chart based on the tasks you entered in the List view. Our Gantt chart looks like this:

Step 5: Customize your Gantt chart
Customization settings will appear on the right side of the screen when you open your Gantt chart. If they don’t, select Customize on the right side of the screen.

This is where you can change your Gantt chart’s name, customize options, and control sharing and permissions. It’s up to you to personalize settings according to your needs and preferences. For now, we recommend hiding weekends—here’s how to proceed:
- Head to Gantt options
- Switch the toggle next to Hide and skip weekends

We also recommend enabling the Reschedule dependencies option in the same settings menu. If you reschedule tasks with dependencies, this convenient option will move the dependent tasks accordingly.
Depending on the number of tasks and the level of detail you want to visualize, you may change the time frame your Gantt chart focuses on. Here’s how to do it:
- Click on the timescales button above the task list. By default, you’ll see week/day selected here
- Choose one of the available options—day/hour, month/day, year/month, or year

Step 6: Create dependencies
One of the reasons every project manager likes Gantt charts is their ability to visualize task dependencies (i.e., tasks that depend on another task).
In our example, every single task depends on the one before it—you can’t modify the software if you don’t test it first, and you can’t present it to stakeholders if you didn’t modify it based on test results. So, we’ll need to create dependencies for every task. Fortunately, doing this in ClickUp is a breeze. 🍃
Here’s how to do it:
- Hover over the task you want to connect to another task and select and hold the gray dot (like in the picture below)

- Connect the line to the desired task by dragging and dropping. In our Gantt chart example, we’ll connect it to the Modify the software based on test results task. ClickUp will draw a connection between the tasks like this:

Repeat the process for any number of tasks you want to create dependencies for to ensure proper order.

Step 7: Create milestones
Gantt chart milestones keep you on the right course, measure progress, and help you identify risks and issues. In ClickUp, Milestones is a Custom Task Type (Custom Tasks let you represent different types of work for easy navigation and enhanced transparency) represented by yellow diamonds. 🔶
Follow these steps to turn a task into a milestone in your Gantt chart:
- Click on the task inside the Gantt chart
- Select Task above the task’s name

- Choose Milestone
Step 8: Monitor and update your Gantt chart
Thanks to ClickUp’s drag-and-drop design, you can easily manage your Gantt chart, reorganize tasks, shorten and extend task deadlines, and coordinate the project timeline as you make progress.
To move individual tasks around, simply press and hold the specific task and drop it to the desired time field.
If you want to extend or shorten a task’s duration, hover over either side of it. Small arrows will appear, which you can drag to customize the task’s start or end date.
If you enabled the reschedule dependencies option in one of the previous steps, you won’t have to worry about moving tasks with dependencies, as all dependent tasks will be relocated accordingly.
Add new tasks to your Gantt chart by selecting the plus sign next to List:

Then, determine its start and due dates in your Gantt chart. For example, we’ll add the Ask customers for feedback task:

If you head back to the List view, you’ll see that the new task appeared there, too, because ClickUp syncs all info in real time. That means you don’t have to worry about reentering task information.

Add subtasks to a specific task by pressing the plus sign next to it:

How to Add a Gantt Chart to an Existing Space in ClickUp
If you’re already managing an existing project in ClickUp and want to reap the benefits of Gantt charts, all you need to do is add the ClickUp Gantt chart view to your Space. Here’s how to do it:
- Go to your Workspace
- Access the Folder or List containing the tasks you want to visualize on a Gantt chart
- Select the +View icon at the top of the screen
- Choose Gantt and press Add Gantt

ClickUp will automatically generate a Gantt chart depicting all the tasks and project details.
Gantt Chart Templates for Project Management
ClickUp boasts an impressive template library with over 1,000 options for various use cases, from human resources and marketing to project management. If you don’t want to create Gantt charts from scratch or are new to the Gantt chart world, use a ClickUp Gantt chart template as a shortcut and guiding star. 💫
Here are our four Gantt chart template recommendations to streamline your work, track tasks, and visualize project schedules:
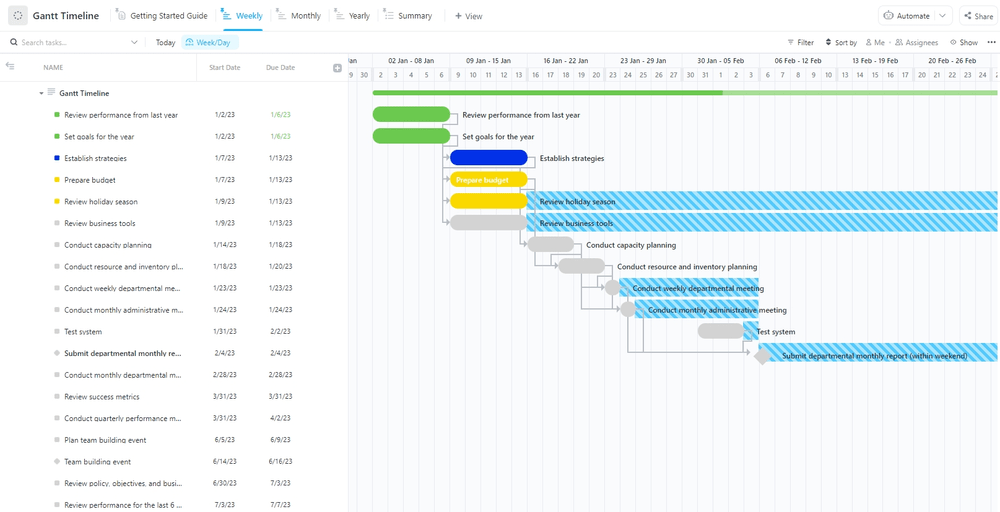
- ClickUp Gantt Timeline Template: Use it to create tasks with timeline bars, identify and allocate resources, track planned vs. actual project progress, and minimize the risk of delays or issues
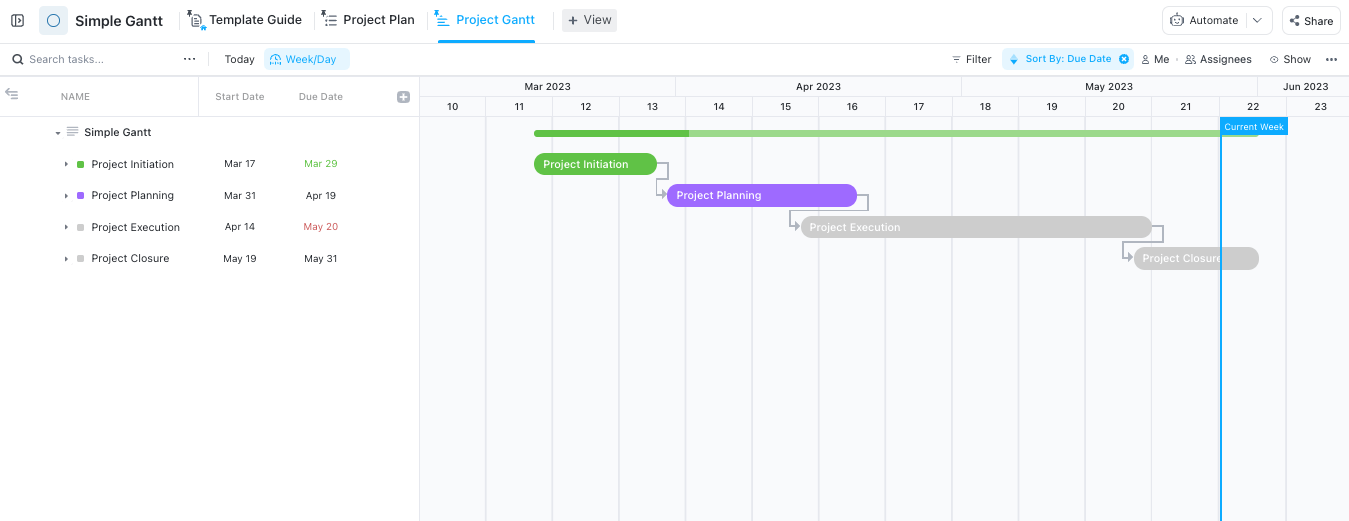
- ClickUp Simple Gantt Template: It helps streamline project management, enhances team collaboration and visibility, and provides clarity regarding task relationships. This Gantt chart template comes with two views (List and Gantt chart) and an example of a project, so it’s excellent for beginners
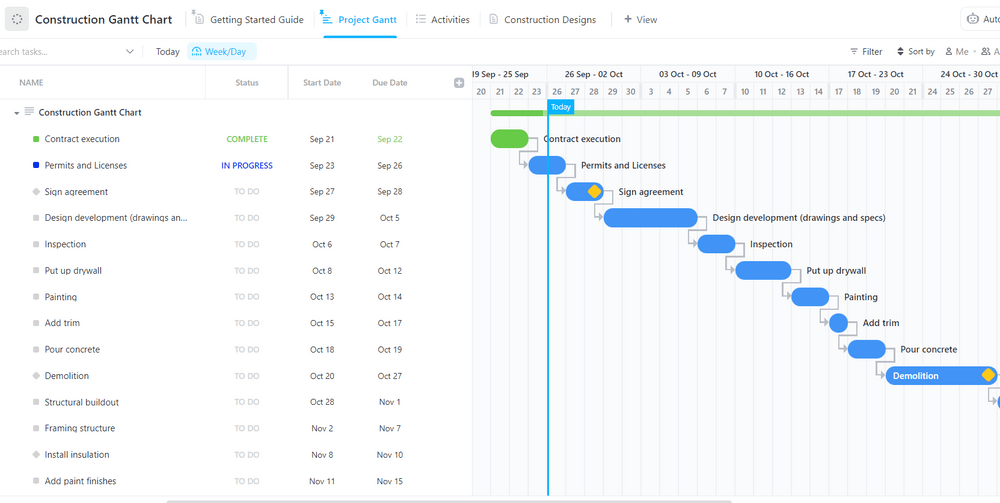
- ClickUp Construction Gantt Template: This modern Gantt chart template helps with resource allocation, project planning, tracking costs and deadlines, and creating and adjusting milestones, making it ideal for a construction project. Of course, you can use it for other projects as well because the template offers in-depth project visibility
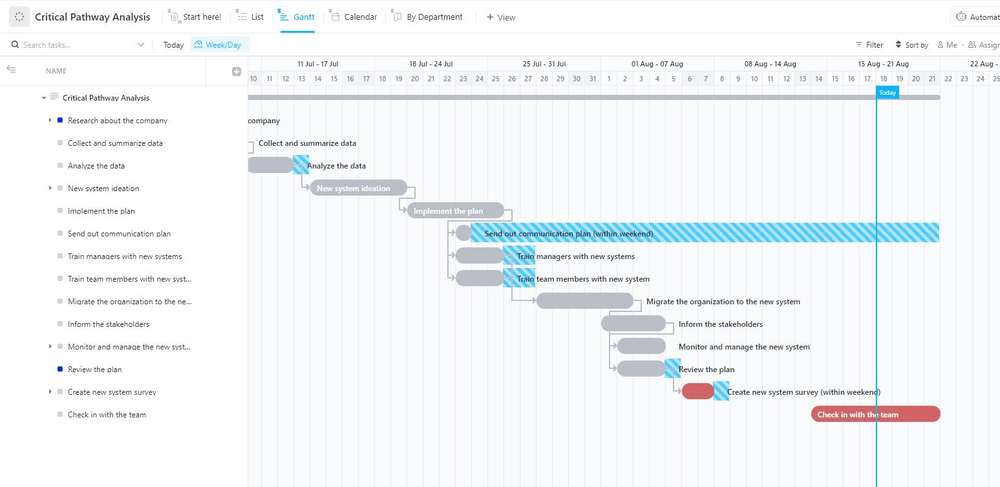
- ClickUp Critical Pathway Analysis Template: This critical path template helps you visualize your tasks in a Gantt chart, determine the best task sequence, and identify risks
What Types of Projects Benefit from Gantt Charts
The beauty of Gantt charts lies in their versatility—they can be used for all kinds of projects as long as they’re time-bound.
For example, you can use a Gantt chart for event planning, from business conferences to weddings and sweet 16 parties. A Gantt chart will help you break down your project into phases, establish proper order, and manage deadlines to ensure everything is completed on time.
Software development is another Gantt chart-friendly industry. Every software development project consists of multiple stages, and you can visualize them all with a Gantt chart. You can assign project tasks, estimate resources, monitor deadlines, identify bottlenecks, and modify your project according to the latest circumstances.
A Gantt chart is a valuable tool for managing marketing projects as well—use it to visualize different campaigns across stages and track their progress, manage content creation, and coordinate your team to achieve goals without hiccups.
You can also use Gantt charts to manage construction, human resources, design, finance, or education projects—as long as there’s a timeline to visualize, a Gantt chart can be useful.
How Different Teams Use Gantt Charts
Let’s check out a few examples of how different teams can use Gantt charts to manage projects:
Marketing teams
Let’s say you’re part of a marketing team and you’re running a new social media campaign on Instagram, Facebook, and TikTok.
With a Gantt chart, you can visualize your entire project (campaign) and divide it into stages, such as collecting info and conducting research, establishing KPIs, posting, and measuring performance. Then, you can create tasks and subtasks for every stage, distribute the workload, and create a detailed project timeline.
As marketing campaigns have many moving parts, Gantt charts give you the necessary flexibility to adjust your timeline on the fly with only a few clicks.
Bonus: Use ClickUp templates with Gantt charts to manage your marketing campaigns. We recommend the ClickUp Campaign & Promotion Management Template because it helps you organize timelines and tasks, automate workflows, and analyze performance.

Design teams
Imagine you’re a member of a design team tasked to create a new label for a jar of honey. 🍯
You’ll divide your process into easier-to-manage phases, such as research, design iteration, consulting the marketing team, collecting client feedback, design approval, printing preparation, and printing.
To ensure the entire process goes smoothly, you’ll break up the phases into tasks and subtasks, organize your team’s workloads, and set deadlines.
Pro tip: Design teams love ClickUp Whiteboards. These infinite digital canvases help you brainstorm ideas and collaborate with your team in real time.

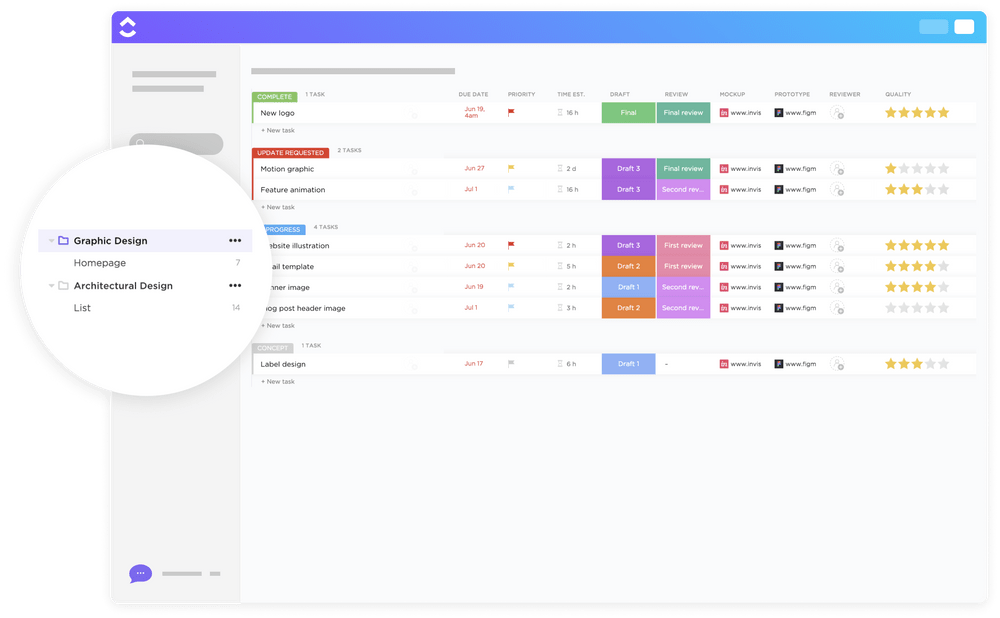
If you want to save time, take advantage of the ClickUp Graphic Design Simple Template and bring your project from ideation to completion in a jiff.
Event plannners
Imagine you’re a wedding planner. A Gantt chart helps you break up your project into several phases, such as meeting with the bride and groom, choosing the venue, ordering decorations, crafting flower arrangements, or selecting vendors.
You can further divide these phases into multiple tasks and subtasks to make them easier to track. Create and manage timelines and dependencies to ensure proper order and prevent last-minute crises.
Tip: Use the ClickUp Singular Event Planning Template to manage guests, select vendors, plan a budget, manage staff, and complete other event planning activities.

When to Avoid Using Gantt Charts
A Gantt chart can be a fantastic tool for visualizing your project timeline, but it doesn’t fit into all scenarios. Here are three scenarios where you might want to skip on a Gantt chart:
1. A Gantt chart isn’t the best option in the initial planning phase
Creating your own Gantt chart makes sense only when you and your project team have already divided the project into tasks and understand how long each will take (at least approximately). A Gantt chart is a visualization of your tasks, not a tool that helps you figure out your tasks in the very beginning.
2. A Gantt chart doesn’t help with resource allocation
A Gantt chart helps you allocate time but doesn’t let you manage resources like budget and equipment.
Tip: In addition to the Gantt chart, ClickUp offers 15+ views, allowing you to represent and coordinate all resources without breaking a sweat.

3. A Gantt chart may not be the best solution for complex projects
A Gantt chart is detailed only to a certain point because it primarily focuses on the time variable. If you want to visualize a high-detailed project, a Gantt chart isn’t the best option because it will quickly become cluttered and even impossible to read.
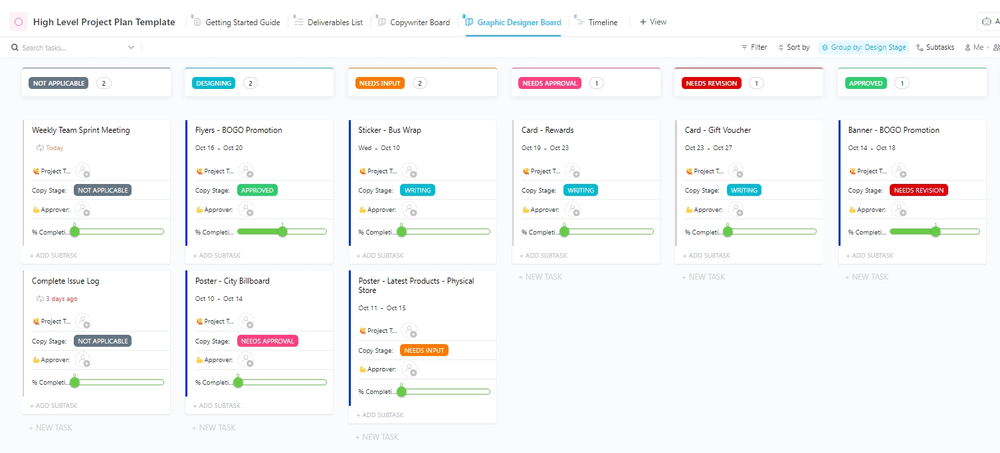
Bonus: Try the ClickUp High Level Project Plan Template to represent and manage complex projects. It allows you to create a high-level project overview, organize phases, tasks, and subtasks, and set and manage goals.
Common Gantt Chart FAQs
1. How do I create a Gantt chart in Excel?
Here’s how to create a Gantt chart in Microsoft Excel:
- Create a table in Microsoft Excel and add your project data to it
- Go to the Insert tab and add a stacked bar chart
- Right-click on the stacked bar chart and press Select Data to add data to your chart
- Format the bar chart
It’s worth noting that you can only create a simple Gantt chart with limited flexibility in Excel.
2. Does Google have a Gantt chart tool?
Google doesn’t have a tool specifically designed for creating Gantt charts. Still, you can use Google Sheets and Google Docs to create a basic Gantt chart for simple projects.
3. Does Microsoft have a Gantt chart tool other than Excel?
Besides Microsoft Excel, you can use Word or PowerPoint to create Gantt charts. As these tools don’t provide flexibility and can’t represent tasks with a high level of detail, their use is limited.
4. Do people still use Gantt charts?
Yes! Many project teams use Gantt charts because they help them visualize timelines and schedules and pave the way toward project completion.
5. What is the best Gantt chart tool?
ClickUp is the best Gantt chart maker because it allows you to represent critical tasks and visualize complex projects in a few clicks. The platform’s feature-rich charts offer flexibility, and since every change happens in real time, your project teams can stay on the same page even if they don’t work from the same location.
Plus, as a first-class task and project management tool, ClickUp offers loads of options for coordinating your work and streamlining processes.
Sign up for ClickUp today, create Gantt charts for free, and explore how they can integrate into your workflows!


