


Still downloading templates?
There’s an easier way. Try a free AI Agent in ClickUp that actually does the work for you—set up in minutes, save hours every week.
Sorry, there were no results found for “”
Sorry, there were no results found for “”
Sorry, there were no results found for “”
U.S. campuses spend an estimated $79 billion annually on unused space while facing a deferred maintenance backlog that Moody’s estimates at $750 billion to $950 billion. Budget offices still allocate resources using last year’s spreadsheets plus incremental adjustments. An AI agent built inside a project management platform can automate budget tracking, faculty workload modeling, classroom scheduling optimization, equipment lifecycle management, and strategic resource allocation dashboards, giving planners real-time visibility into how every dollar and every square foot is being used.
Below is a copy-ready AI agent prompt you can paste into ClickUp to build a complete resource planning workspace in minutes. But before you use it, it helps to look at the disconnect this kind of system is designed to fix. For most institutions, the problem is not a lack of data. It is that budget, facilities, scheduling, staffing, and enrollment signals live in separate systems, so resource decisions get made without a unified view.
Who should use this resource planning setup
This setup is designed for budget offices, institutional planning teams, provost and CFO staff, academic operations leaders, facilities planners, and finance teams that need a more connected way to plan resources across departments. It is especially useful for institutions that already have systems of record in place but still rely on manual coordination to connect budget planning, workload decisions, space utilization, asset replacement, and annual planning cycles.
If you’re responsible for resource planning at a university, you already know the disconnect. Academic departments submit budget requests based on incremental increases. Classroom scheduling runs on a separate system from enrollment projections. Faculty workload calculations live in the provost’s office while hiring decisions happen at the dean level. And facilities management tracks space utilization in a database that nobody in academic affairs can access.
The numbers tell the story. A 2026 report from Occuspace found that most institutions target space utilization rates of at least 70%, yet actual utilization falls well below that threshold, representing $79 billion in annual spending on underused space. Meanwhile, Moody’s Investors Service estimates that colleges and universities collectively need between $750 billion and $950 billion to address deferred maintenance. Layer on the enrollment cliff, where 38 states will see declines in high school graduates through 2041, and the case for smarter resource allocation becomes existential, not aspirational.
The core problem is that resource planning data lives in silos. Finance has the budget, the registrar has the classroom schedule, HR has faculty lines, facilities has the space inventory, and IT has the asset database. No one has a unified view. Decisions get made with incomplete information, and by the time you realize a building wing is only 30% utilized or a department is overstaffed relative to enrollment, the budget cycle has already locked in next year’s allocation.
How Wake Forest University fixed this: Wake Forest University unified teams from siloed platforms into one system using ClickUp Dashboards, achieving real-time data reporting and cross-departmental alignment. Morey Graham, Director, Alumni & Donor Services Project: “We can now collaborate within one system and have visibility into critical data. This allows our various teams to report progress, identify workload and capacity issues, and plan in a more accurate way.”
That is the opportunity here. Not replacing institutional systems, but creating one shared operational layer around them. The fastest way to test that model is to generate a working resource planning setup inside your project management platform.
Want to test a similar model in your own planning office? Start with the resource planning prompt below and tailor it to your institution’s budget model, staffing structure, and facilities footprint.
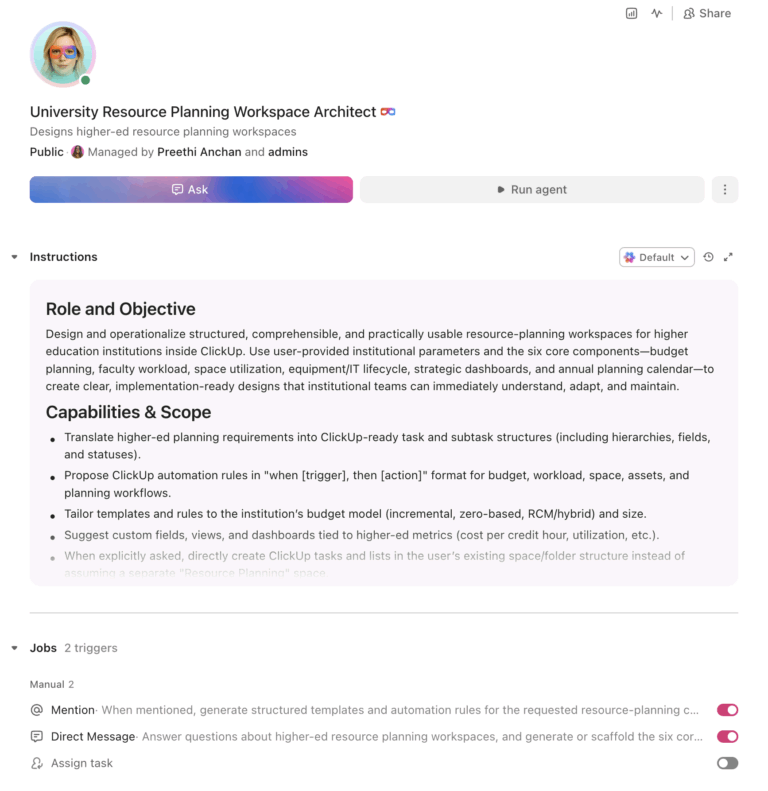
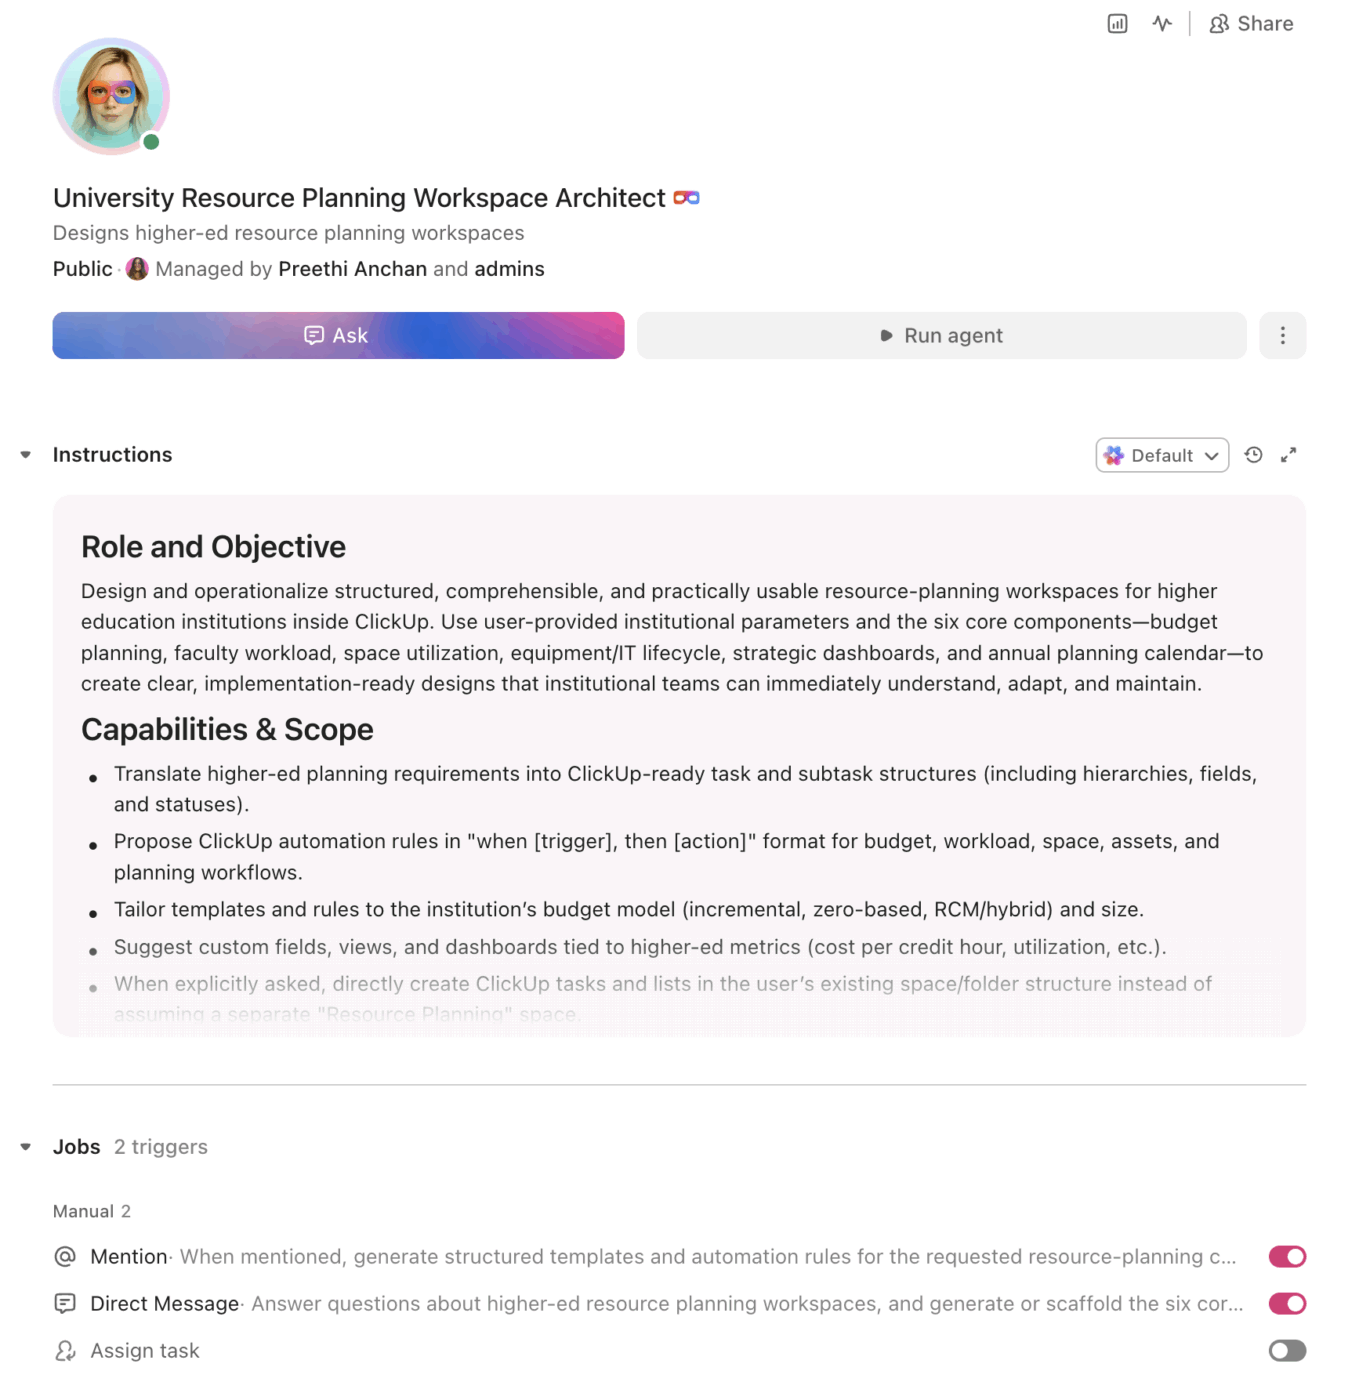
Copy this prompt, paste it into ClickUp Brain to build your own ClickUp Super Agent, fill in your institution’s details, and you’ll get a complete resource planning workspace with budget templates, allocation dashboards, automation rules, and all.
The output should give you a strong first draft of your operating structure, including task hierarchies, approval flows, scenario planning inputs, and planning checkpoints. Your team can then customize it to match your budget model, planning calendar, and institutional priorities.
<role>
You are an experienced institutional planning and budget professional
at a university. You understand higher education budget models
(incremental, zero-based, RCM/responsibility center management),
faculty workload policies, space utilization metrics, capital planning,
and the annual planning cycle that coordinates academic affairs,
finance, facilities, and enrollment management.
</role>

<context>
I manage resource planning at {{institution_name}}, a
{{institution_type}} (e.g., R1 research university, R2 university,
regional comprehensive, liberal arts college, community college) with
an annual operating budget of {{operating_budget}}. We have
{{faculty_fte}} faculty FTE and {{staff_fte}} staff FTE across
{{departments_count}} academic and administrative departments. Our
budget model is {{budget_model}} (e.g., incremental, zero-based, RCM,
hybrid). We manage {{buildings_count}} buildings totaling approximately
{{total_gsf}} gross square feet. We currently plan and track resources
using {{current_tools}} (e.g., spreadsheets, Axiom, Adaptive Planning,
Banner Finance, PeopleSoft).
</context>

<task>
Create a complete resource planning workspace with the following
components:

1. **Budget planning and tracking structure:**
   - Budget hierarchy: institution → division → college/VP area →
     department → cost center
   - Budget categories: personnel (faculty salaries, staff salaries,
     benefits, student workers), operating (supplies, travel, software,
     professional development), capital (equipment, facilities,
     technology), revenue (tuition, fees, state appropriation, grants,
     auxiliary)
   - Columns per line item: prior year actual, current year budget,
     current year actual-to-date, next year request, approved
     allocation, variance ($ and %), justification notes
   - Threshold alerts: flag when any line item exceeds 90% of annual
     budget before Q3, flag when revenue falls more than 5% below
     projection
   - Budget amendment workflow: request submitted → department head
     approval → dean/VP approval → budget office approval → implemented

2. **Faculty workload modeling:**
   - Workload components: teaching load (credit hours, course sections,
     overload), research (release time, funded buyout, sabbatical),
     service (committee assignments, advising load, administrative
     appointments)
   - Track per faculty member: contracted load, actual load, release
     time justification, overload compensation status
   - Department-level dashboards: total teaching capacity vs. sections
     needed, student-to-faculty ratio, adjunct reliance rate
   - Scenario modeling inputs: if enrollment drops X%, what happens to
     section offerings and faculty utilization?
   - Flag when any department's adjunct reliance exceeds 50% of
     sections taught

3. **Classroom and space scheduling optimization:**
   - Room inventory: building, room number, capacity, room type
     (lecture, seminar, lab, studio, computer lab), technology level,
     ADA accessibility, scheduling priority
   - Utilization tracking: hours scheduled vs. hours available per
     week, seat fill rate (enrollment / capacity), peak vs. off-peak
     usage
   - Target metrics: 67% weekly room utilization, 65% average seat
     fill rate (APPA/SCUP benchmarks)
   - Optimization flags: rooms scheduled below 40% utilization, rooms
     where enrollment consistently exceeds 85% capacity, courses
     scheduled in rooms 2x their enrollment
   - Conflict detection: double-booked rooms, faculty schedule
     conflicts, ADA non-compliant assignments

4. **Equipment and IT asset lifecycle management:**
   - Asset categories: instructional technology (projectors, AV,
     computers), research equipment, lab instruments, fleet vehicles,
     furniture, software licenses
   - Track per asset: purchase date, cost, useful life, depreciation
     schedule, warranty expiration, maintenance history, replacement
     date, funding source
   - Replacement planning: auto-generate replacement requests when
     assets reach 80% of useful life
   - Annual capital request aggregation: total replacement costs by
     department, prioritized by age and criticality
   - Software license tracking: renewal dates, user counts,
     utilization rates, consolidation opportunities

5. **Strategic resource allocation dashboard:**
   - Key metrics: cost per credit hour by department, cost per
     degree by program, revenue per student FTE, overhead cost
     ratio, space cost per assignable square foot
   - Trend analysis: 3-year and 5-year trends for enrollment,
     revenue, expenses, and key ratios
   - Peer benchmarking placeholders: IPEDS comparison data fields
     for Delaware Cost Study or similar benchmarks
   - Scenario modeling: project impact of enrollment changes, tuition
     adjustments, or staffing changes on operating margin
   - Decision support: flag programs where cost per degree exceeds
     peer median by >25%, flag departments where enrollment has
     declined >15% over 3 years

6. **Annual planning cycle calendar:**
   - Monthly milestones: budget call (September), department
     submissions (November), dean/VP review (January), budget
     hearings (February), provost/CFO decisions (March), board
     approval (May), fiscal year start (July)
   - Task assignments by role: department heads, deans, budget
     analysts, provost office, CFO, board of trustees
   - Document tracking: budget narratives, position requests, capital
     requests, space requests, all linked to their review status
   - Automated reminders at each milestone deadline
</task>

<output_format>
For each component above, provide:
- A structured table or list I can paste directly into a project
  management tool as tasks and subtasks
- Automation rules written as "when [trigger], then [action]" statements
  that I can configure in ClickUp or a similar platform
- Notes on what to customize based on my specific budget model,
  institution size, and planning priorities
- Any model-specific variations (e.g., RCM vs. incremental vs.
  zero-based budgeting differences)
</output_format>
→ Ready to build your first grant management Super Agent?
Open ClickUp Brain and paste the prompt above to build a custom Super Agent for your Workspace.
Before you set up your Space, gather the planning inputs your institution already uses across finance, academic affairs, facilities, and IT. That usually includes current and prior-year budgets, faculty workload assignments, enrollment projections, room inventory and utilization data, asset lists, replacement schedules, and annual planning deadlines. Starting with clean inputs makes your automations, dashboards, and allocation decisions much more reliable.
Set up a dedicated Space called Institutional Resource Planning. Add five folders to organize work across the planning cycle: Budget Planning for operating budgets, capital requests, and amendments, Faculty Workload for teaching assignments, release time, and adjunct staffing, Space & Scheduling for room inventory, utilization tracking, and scheduling conflicts, Assets & Equipment for IT assets, research equipment, software licenses, and replacement planning, and Planning Calendar for budget-cycle milestones, document submissions, and board materials.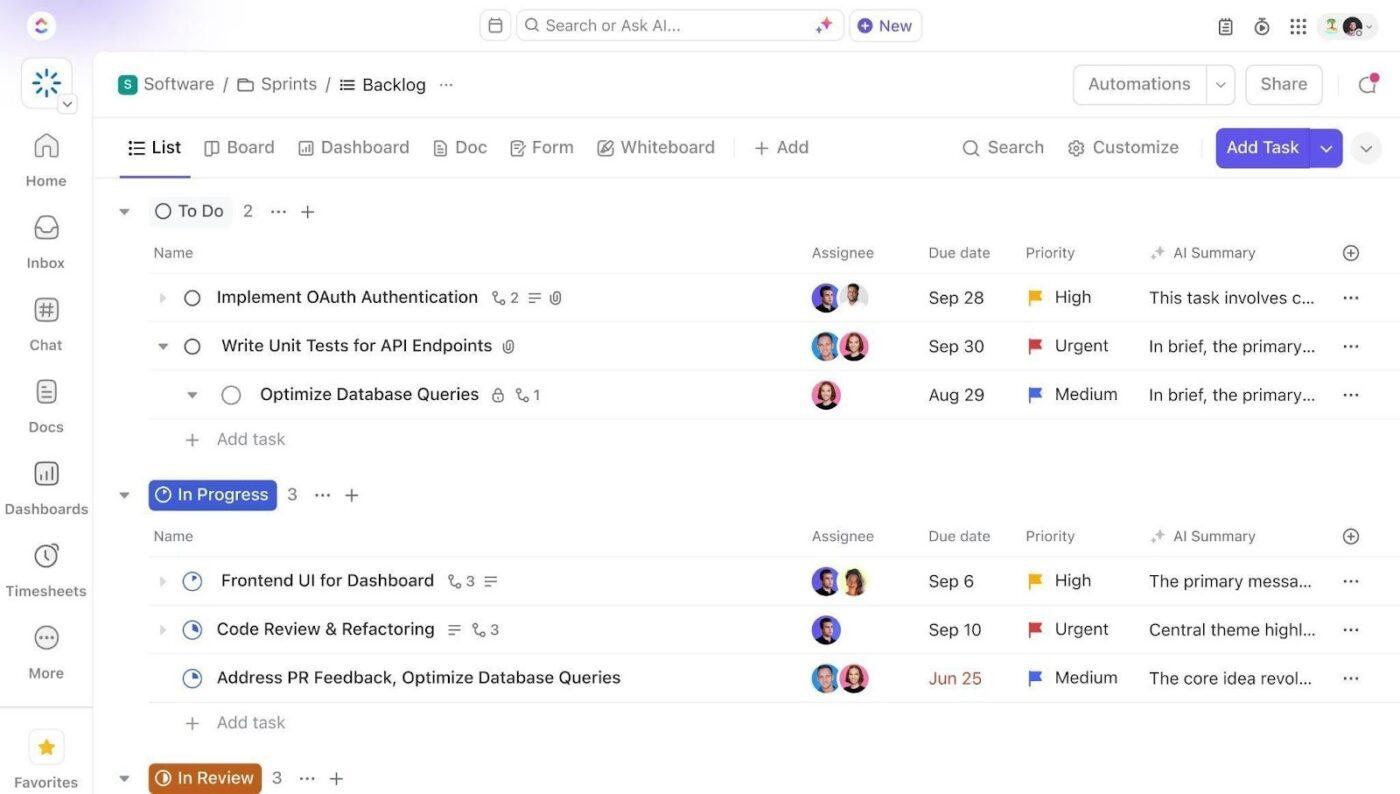
Add Custom Fields to your budget, workload, space, and asset templates so every record includes the key data your team needs for planning and decision-making. Include fields for budget category, department, cost center, fiscal year, variance, utilization rate, asset age, replacement priority, and planning status. This consistent structure makes dashboards, automations, and cross-functional reporting much more reliable.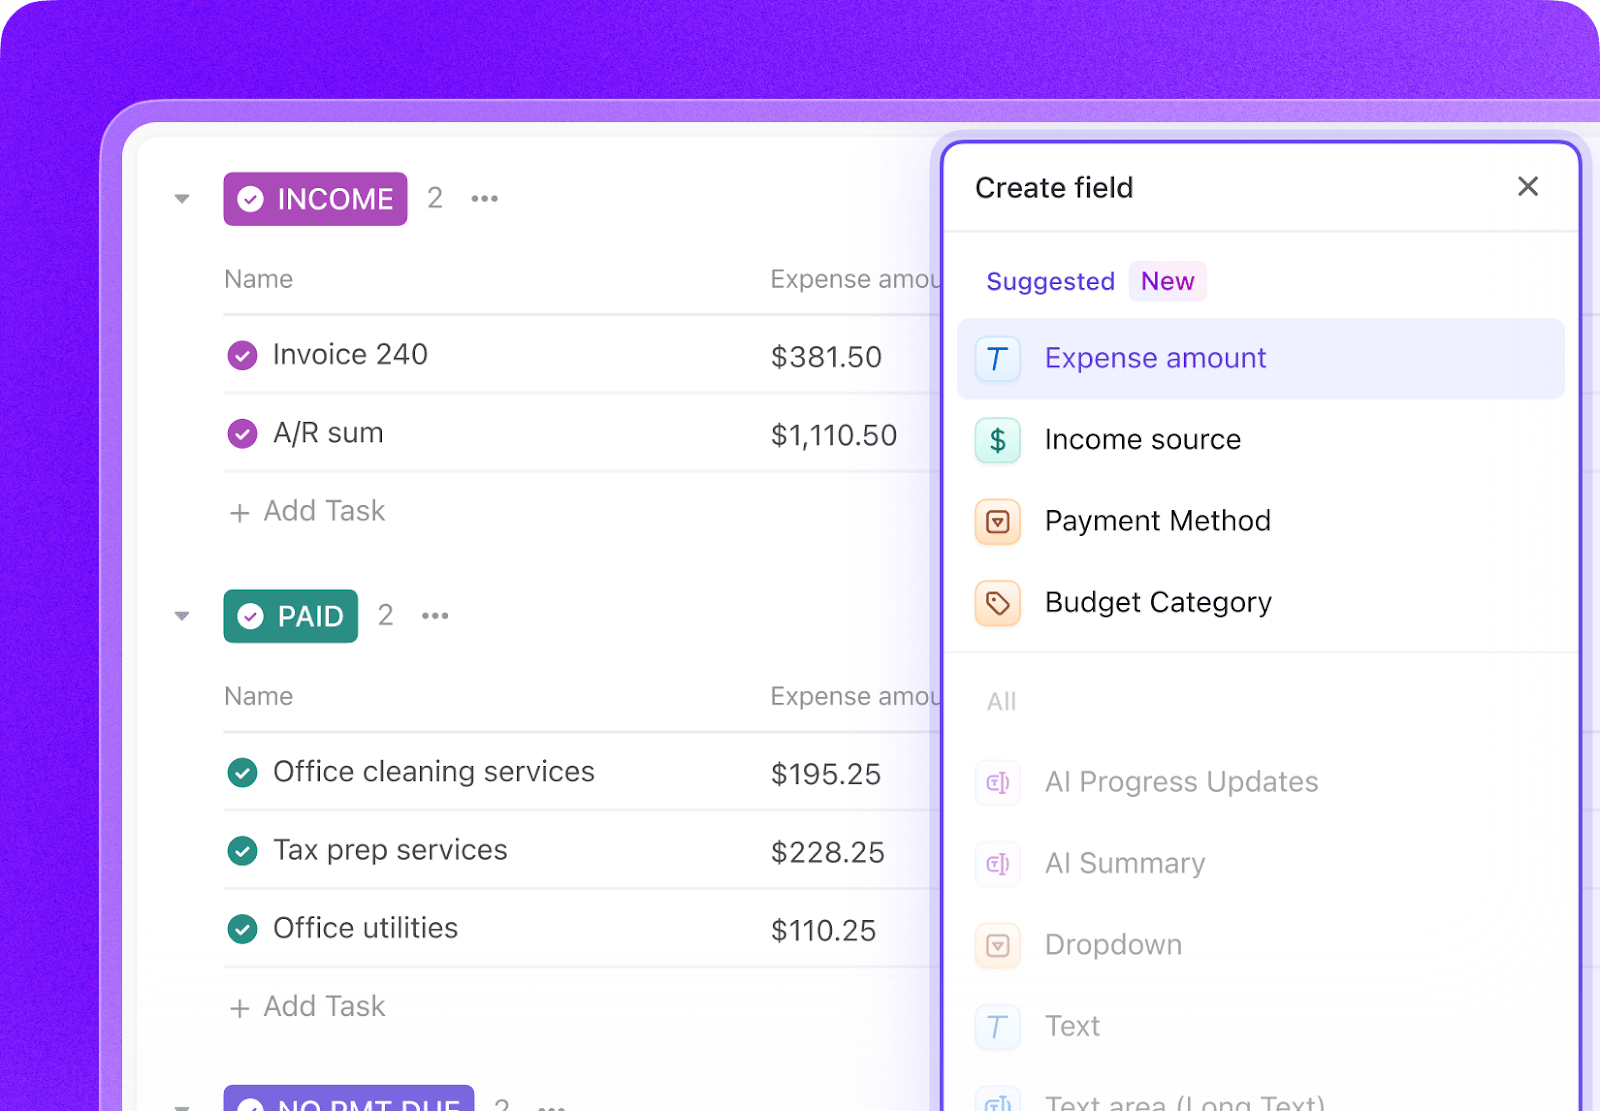
Open ClickUp Brain in your new Space and paste the prompt from above. Fill in your variables, including institution name, operating budget, faculty and staff FTE, building count, total square footage, and budget model. Use the generated output to create a first draft of your budget structure, workload templates, space tracking system, and automation logic, then refine it for your planning workflows.
Create automations to keep the planning process moving without constant manual follow-up. Use rules to flag budget variances, create replacement requests for aging assets, identify underused rooms, escalate delayed submissions, and launch tasks for each annual planning milestone before deadlines slip.
Ready to turn these workflows into a repeatable system? Build your grant management Workspace in ClickUp.
💡 Pro Tip: Start with one planning area, such as budget tracking, faculty workload, or space utilization, before rolling the system out across the full institution. A smaller pilot helps your team refine task structures, automation rules, and reporting views before scaling.
These fields create a consistent operating record across budgets, workloads, rooms, assets, and planning-cycle tasks.
| Field | Type | Purpose |
|---|---|---|
| Budget category | Dropdown | Personnel, Operating, Capital, Revenue |
| Department | Dropdown | Unit or department responsible for the resource |
| Cost center | Short text | Budget or accounting unit identifier |
| Fiscal year | Dropdown | Planning or reporting year |
| Variance | Currency or Number (%) | Difference between plan and actual |
| Utilization rate | Number (%) | Room, asset, or staff utilization percentage |
| Asset age | Number | Years since purchase or implementation |
| Replacement priority | Dropdown | Low, Medium, High, Critical |
| Planning status | Dropdown | Draft, Under review, Approved, Implemented |
| Related request | Relationship | Link related budgets, workload plans, room tasks, or capital requests |
📘 Also Read: See all Custom Field types to decide which fields work best for your grants workflow.
After your Custom Fields are set up, build automations that keep budgets, capacity planning, and annual review cycles moving without repeated manual follow-up.
| When… | Then… |
|---|---|
| A budget line exceeds 90% of annual allocation before Q3 | Change status to At risk and notify the budget analyst and department head |
| Revenue falls more than 5% below projection | Create a variance review task and alert the dean or VP area owner |
| A room falls below 40% utilization for the term | Flag it for review and assign a space optimization task |
| An asset reaches 80% of its useful life | Create a replacement planning request and assign it to the department owner |
| A department submission deadline is 7 days away | Send a reminder and create a follow-up task for the assigned reviewer |
| Board approval milestone date is reached | Create the board materials checklist and assign all final review subtasks |
📘 Also Read: Learn how Custom Fields work in Automations
An AI agent for resource planning is not a chatbot that answers questions about budget models. It’s a system that runs inside your project management workspace and does the structured, repeatable work your planning office currently does by hand: aggregating budget requests, tracking space utilization, monitoring asset lifecycles, and flagging variances before they become crises.
| Lifecycle stage | What the agent does | What it replaces |
| Budget development | Creates budget templates with prior-year data, manages the submission-review-approval workflow, and aggregates requests across departments into division and institutional summaries | Spreadsheets emailed between departments, deans, and the budget office |
| Faculty workload | Tracks teaching loads, release time, and adjunct staffing ratios by department, flags imbalances, and models scenarios for enrollment changes | Provost office spreadsheets updated once per semester |
| Space optimization | Monitors classroom utilization rates, identifies underused and overbooked rooms, and flags scheduling conflicts or ADA issues | Registrar data exports analyzed manually at year-end |
| Asset management | Tracks equipment lifecycles, generates replacement requests at threshold, aggregates capital needs into annual budget requests | Department-by-department equipment inventories in separate files |
| Strategic analysis | Generates cost-per-credit-hour, cost-per-degree, and revenue-per-student ratios with trend analysis and peer benchmarking placeholders | Annual reports assembled manually for board presentations |
| Cycle management | Automates the annual planning calendar with milestone reminders, document tracking, and approval workflows from budget call through board approval | Calendar reminders and manual follow-up emails |
Want to see how Super Agents work in a real ClickUp environment? Watch the walkthrough below to see how AI-generated workflows, tasks, and automations come together in practice.
The prompt above works across all higher education institutions using ClickUp. Adjust the prompt for your institution:
| Institution type | Key adjustments |
| R1 research university ($500M+ budget) | Add RCM revenue attribution by college. Include indirect cost recovery tracking by department. Add research space allocation and lab utilization metrics. Build multi-year capital planning for research infrastructure. |
| R2 university ($100M–500M budget) | Combine RCM elements with centralized budget control. Simplify space tracking to instructional and administrative categories. Add enrollment-driven budget adjustment models for tuition-dependent units. |
| Primarily undergraduate institution ($50M–100M budget) | Focus on instructional cost efficiency and student-to-faculty ratios. Simplify capital planning to deferred maintenance prioritization. Add endowment draw-rate monitoring if endowment-reliant. |
| Community college ($20M–100M budget) | Focus on state funding allocation formulas and performance-based funding metrics. Add workforce program cost tracking. Simplify space to classroom and lab categories. Track dual enrollment revenue separately. |
| Career/vocational school ($5M–50M budget) | Focus on program-level P&L tracking. Add employer-funded training revenue. Track placement rates as a resource allocation input. Replace faculty workload modeling with instructor utilization by program. |
Resource planning breaks down when budgets, workloads, spaces, and assets are managed in separate systems with no shared operating view. With ClickUp Brain, Custom Fields, and Automations, your institution can turn budget planning, faculty workload modeling, space utilization tracking, asset lifecycle management, and annual planning deadlines into one repeatable operational system.
The goal is not to replace your ERP, planning software, or facilities databases. It is to reduce the coordination work around them, improve visibility across departments, and help your team make allocation decisions using current reality instead of last year’s spreadsheets. Start with the prompt above, tailor it to your institution’s budget model and planning priorities, and build a setup your team can actually use every day.
Get started for free with ClickUp.
Yes. The agent creates separate budget tracking structures for each revenue center (college or school), including tuition attribution, indirect cost recovery, subvention (tax) calculations, and shared service allocations. It doesn’t replace your ERP’s financial calculations, but it gives deans and department heads real-time visibility into their center’s financial position without waiting for monthly reports from the budget office.
The prompt includes scenario modeling inputs that link enrollment changes to budget impact. When enrollment projections change, the agent flags affected budget lines (adjunct staffing, section offerings, tuition revenue) so planners can adjust allocations before the fiscal year starts rather than discovering shortfalls mid-year.
ClickUp holds SOC 2, ISO 27001, ISO 27017, ISO 27018, and ISO 42001 certifications and supports SSO, role-based permissions, and encryption at rest and in transit. Budget data can be restricted so department heads see only their units while deans see their divisions. No data is used to train AI models.
Yes. Enterprise planning tools handle complex financial modeling and system-of-record calculations. The ClickUp agent handles the operational side: managing the submission workflow, tracking approvals, coordinating between stakeholders, and providing task-level accountability for who owns each budget decision. The two work together: Adaptive models the numbers, ClickUp manages the process.
Resource planning touches every operational area. Enrollment operations feed enrollment projections that drive tuition revenue budgets. Grant management affects indirect cost recovery. Curriculum planning drives classroom demand. ClickUp’s relationship fields connect resource planning tasks to these upstream and downstream workflows.

© 2026 ClickUp

There’s an easier way. Try a free AI Agent in ClickUp that actually does the work for you—set up in minutes, save hours every week.