
Sorry, there were no results found for “”
Sorry, there were no results found for “”
Sorry, there were no results found for “”
In the wildly popular management book, Goal by Eliyahu M. Goldratt, he argues that the fundamental goal of every business is to make money. Though extremely simple to understand, it’s not easy to implement.
The goal of making money needs to be broken down into increasing throughput, reducing expenses, and minimizing inventory, all leading to maximizing revenue and profit. Depending on the business you’re in, this can get quite complex.
For instance, for a freelance content writer, increasing throughput could be as simple as writing more articles each week. However, for a car manufacturer, it involves optimizing thousands of processes, each with its own goals.
Tracking this needs purpose-designed software like ClickUp. Let’s see how you can set effective goal metrics and achieve them in your organization.
Goals are broad objectives that an individual, team, or organization aims to achieve. This could be increase revenue from new product line or expand to a new market.
Goal metrics are specific, measurable indicators to achieve these goals. They break down goals into actionable steps and help monitor performance and evaluate success.
While used in conjunction, goals and metrics are fundamentally different concepts.
| Goals | Metrics |
|---|---|
| Broad objectives | Focussed measures of performance |
| Provide guidance and clarity of work | Provide checkpoints for measuring output |
| Outcome-based such as revenue growth, customer satisfaction, etc. | Typically output-based, such as leads generated, NPS, etc. |
| Set for the long term, typically quarterly or yearly | Set for the short term. Teams sometimes track metrics daily/weekly |
Goals and metrics have a symbiotic relationship. Goals guide the organizational journey in the right direction, metrics ensure you are moving at the right pace.
For example, if your goal is to increase revenue within the next business year, you might set metrics such as:
Tracking these metrics on a weekly or monthly basis helps achieve the yearly goal you’ve set. Business leaders break down organization-wide goals into smaller goals for teams. They then use goal metrics to determine progress towards these goals.
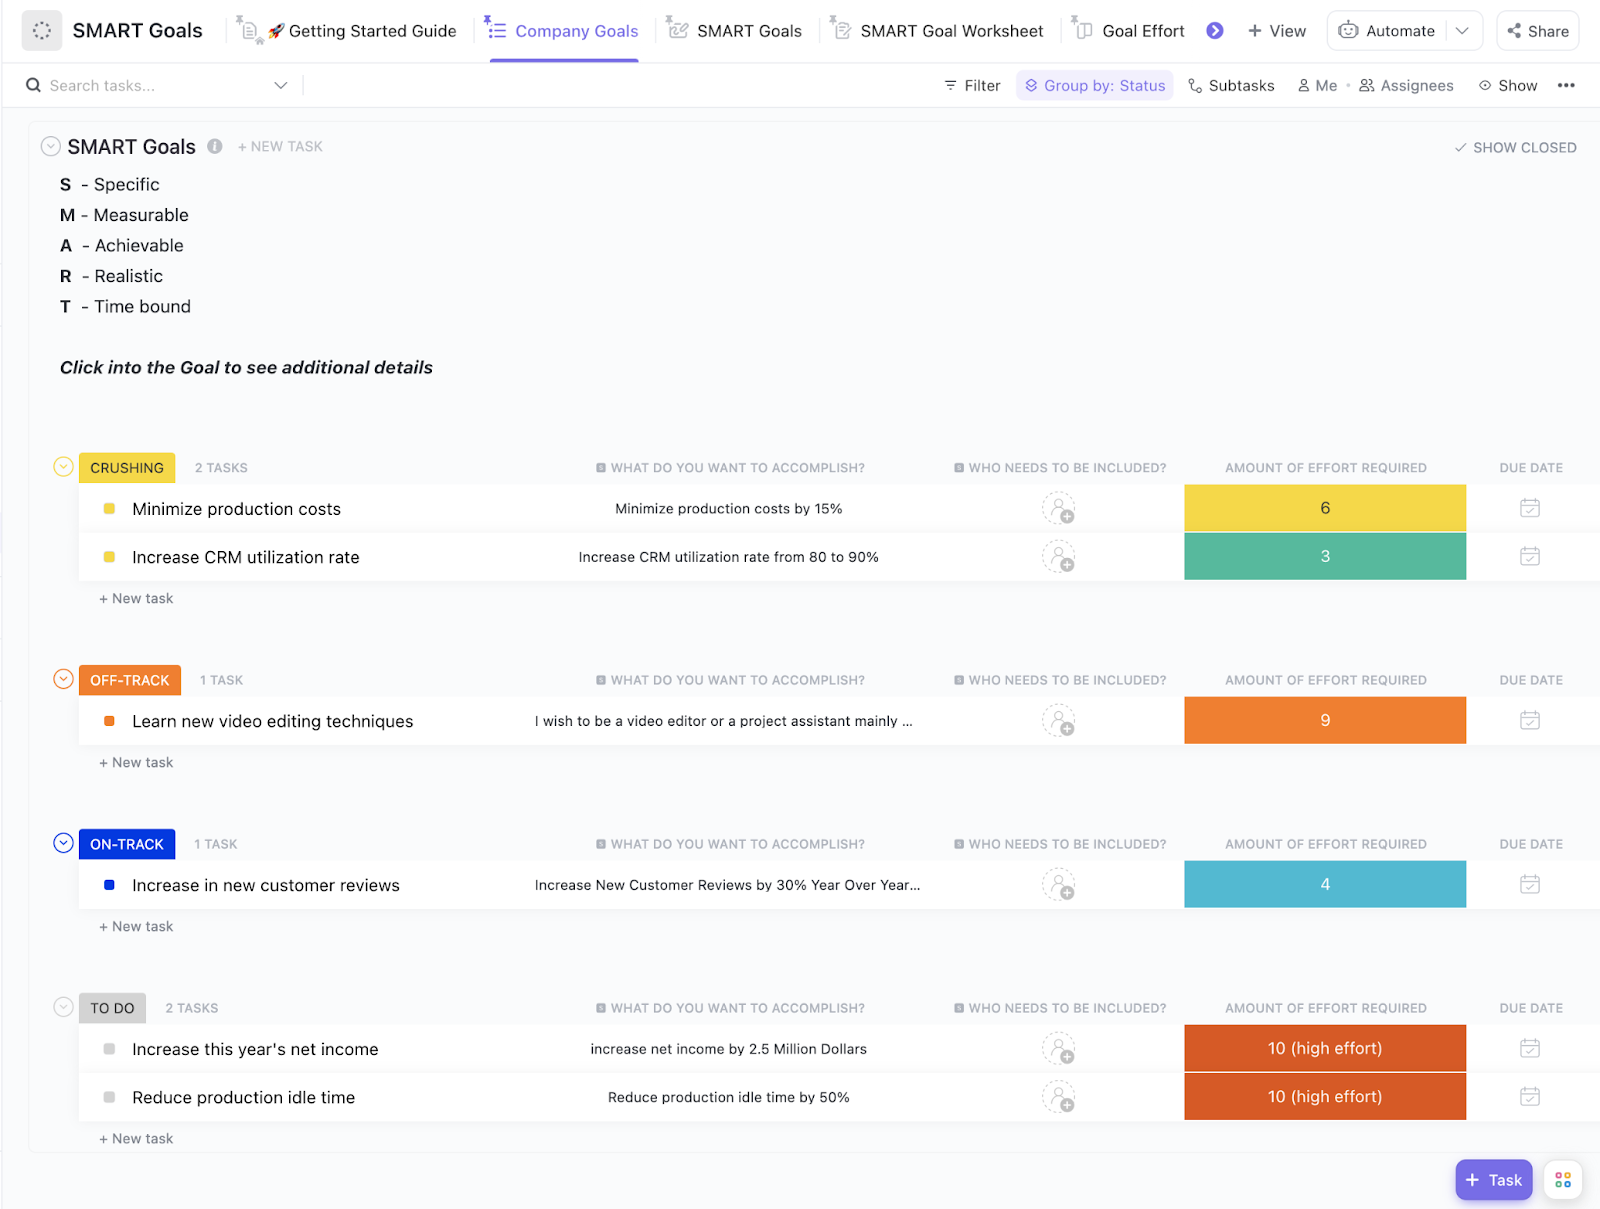
Trying to define goal metrics that actually guide progress? The ClickUp SMART Goals Template gives you a built-in space to tie each goal to measurable outcomes, so you’re not guessing whether it worked.
In figuring out goals vs objectives vs metrics, there are a number of terms that you will encounter. Let’s discuss a few for disambiguation.
Key Performance Indicators (KPIs): A KPI is a specific measure of a project, department, or organization’s success in meeting its goals. For productivity goals, a KPI might be number of hours worked.
Service-level agreement (SLA): An SLA is the standard of performance you’ve committed to. For example, a software maintenance team might have an SLA of 4 hours as the response time for high-priority complaints.
Click-through rate (CTR): A popular marketing KPI, click-through rate measures the number of times someone clicks a link against the number of times displayed. If your Facebook ad is seen by 100 people and clicked-on by one, your CTR is 1%.
Active users: In the SaaS world, Daily Active Users (DAU) and Monthly Active Users (MAU) are key metrics. It refers to the number of people actively using the product, a leading metric for potential revenue.
With a strong foundation of that theory, let’s look at some examples.
Goal metrics might vary depending on the kind of work you do. To give you a clear idea, we’ve chosen examples from multiple business functions.
1. Customer Acquisition Cost (CAC): All customer acquisition expenses, including sales expenses and marketing efforts. CAC is an important expense that needs to be minimized.
2. Sales activities per rep: The number of tasks a sales representative completes within a particular timeframe. Most organizations track sales calls. This is a productivity metric that helps teams achieve sales goals.
3. Conversion rate: Rate at which leads convert into clients. This goal metric tracks the quality of leads and the efficiency of the sales engagement process.
4. Sales cycle length: Average duration of the sales process from the initial contact stage to closing. Together with activities per rep and conversion rate, this metric helps forecast revenue outcomes.
5. Customer lifetime value (CLV): Total revenue a business can generate from a customer over the lifetime of their relationship. CLV helps rationalize CAC and allocate budgets accordingly.
6. Marketing qualified leads (MQL): Number of leads that the marketing team considers likely to convert into customer. MQLs add an element of quality to the leads generated.
7. Cost per lead (CPL): All expenses towards acquiring a lead. CPLs are a leading indicator of CAC.
8. Impressions, clicks, and leads: Number of people who’ve seen an ad, clicked on an ad, and filled the form to be captured as a lead. These KPI metrics help measure top of the funnel performance.
9. Bounce rate: Percentage of marketing emails that bounce when the ID is incorrect, inactive, or unavailable. Bounce rate is an indicator of the health of your subscriber database.
10. Marketing return on investment (ROI): Ratio of revenue generated from marketing and marketing expenses. This is an important measure of marketing effectiveness.
11. Gross profit margin: (Revenue – Cost of Goods Sold)/100. Gross margin is a critical indicator of the project’s operational strengths and financial health.
12. Earned value: Actual work completed x budget. If your budget is 30,000 for a 30-day project and you’ve completed 10% in 6 days, your earned value in project management is 3,000. And your planned value is 6,000. This, along with other financial metrics, helps measure in $ terms how behind/ahead you are of schedule.
13. Cost variance: Budgeted cost – actual cost. One of the main goals of good project delivery is completing on budget. Cost variance is a key metric for that.
14. Schedule variance: Planned delivery – actual delivery. In the above example, you should have completed 20% in 6 days. So, your schedule variance is 10%.
15. Utilization rate: Hours worked/available hours. In a 40-hour work week, if you’ve worked 30 hours, you have a 75% utilization rate. This is a leading indicator of productivity and resource allocation, an integral part of project goals.
16. Deployment frequency: How often code is deployed to production. Sometimes considered a north-star metric for teams adopting agile, this is a key indicator of engineering team’s productivity and speed.
17. Sprint goal success rate: Percentage of items from the sprint backlog that were completed. This metric shows the team’s ability to plan effectively and meet business goals.
18. Response time: Time taken by the system to respond to a query. This is a key measure of agility and responsiveness.
19. Code coverage: Percentage of code covered by automated tests. This agile metric identifies testing efficiency as well as those parts that need additional attention.
20. Mean time to recover (MTTR): Time taken by the engineering team to recover from an incident. In a world where security/performance incidents are inevitable, MTTR is an indicator of resilience.
21. Security incidents: Number of incidents or breaches. In conjunction with mean time to detect, mean time to recover, and severity of incident, this measures the software’s security capabilities.
22. Customer retention: The percentage of customers retained over time. This metric indicates the product/service’s ability to be valuable to the customer, thereby reducing budgets spent in acquiring new customers.
23. Net Promoter Score (NPS): A customer’s likelihood of recommending a product or service. This is a metric for customer delight in most product/service organizations.
24. First response time: Speed of the first response to customer inquiries. Typically outlined in SLAs, first response time is a key indicator of customer service efficiency.
25. Resolution rate: Percentage of tickets resolved within SLA.
If any of these goals seem right for you, here is how you can track and report on them to optimize performance.
Once you’ve set your goal metrics, ensure you have clear visibility into them at all times. Goal tracking apps like ClickUp are perfect for this.
Set numerical, monetary, true/false, and task targets with ClickUp Goals. For instance, set numerical targets for weekly lead generation goals. Set monetary targets for sales.
If you don’t know where to start, try the ClickUp SMART Goals Template.
Assign users to each goal metric. You can also break down a metric for multiple team members who collectively achieve targets.
Identify the data sources for each metric and integrate them with ClickUp. This could include internal systems, external databases, customer feedback, or employee surveys. Ensure data accuracy, reliability, and accessibility.
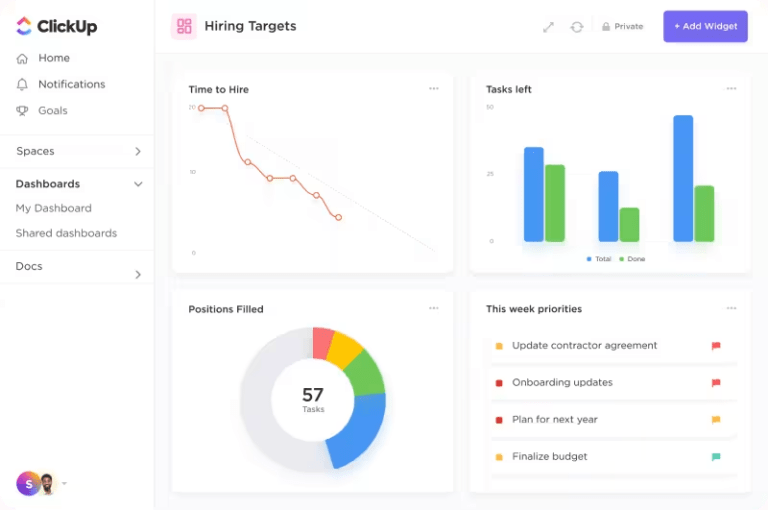
Customize ClickUp Dashboards to display the metrics that matter to you. Get real-time updates on each metric so you can adapt your efforts to improve performance.
One of the primary aspects of setting a goal or defining metrics is defining benchmarks accurately. A startup in its first year of operation might be able to achieve a goal of 100% increase in revenue, but a multinational corporation might not be. To know the difference, benchmarks are necessary.
In goal-setting, benchmarks:
In short, a goal is what needs to be achieved. A metric is the indicator of performance towards that goal. Benchmark is the number for the metrics.
For example, in a software engineering product, increase throughput is a goal. Number of features deployed to production is the metric. 10 features per sprint is the benchmark.
Begin setting your benchmarks and metrics with any of these goal-setting templates.
In the journey towards organizational success, goal metrics are the milestones you need to cross. Here’s how they can help operations teams improve performance.

Visibility: Goal metrics make the destination visible to everyone on the team. It helps them guide their progress based on what they need to achieve throughout the course of the year.
Measurability: Projects often last months, if not years. Waiting for the end to know whether you’re successful can be demotivating. Goal metrics help team members know at regular intervals how they’re progressing.
Purpose: For team members, goal metrics offer a sense of purpose. It helps create a collective responsibility towards achieving the objectives.
Continuous improvement: Based on the visibility, measurability, and purpose, teams can create a continuous improvement plan. If you see that your performance is swaying away from the plan, you can make adjustments instantly.
Enable visibility through ClickUp Dashboards. Conduct regular retrospectives and document lessons on ClickUp Docs. Debate ideas on comments and stay on top of all conversations with the ClickUp Chat view.

Implement changes, track progress, rinse, repeat!
📮 ClickUp Insight: 78% of our survey respondents make detailed plans as part of their goal-setting processes. However, a surprising 50% don’t track those plans with dedicated tools. 👀
With ClickUp, you seamlessly convert goals into actionable tasks, allowing you to conquer them step by step. Plus, our no-code Dashboards provide clear visual representations of your progress, showcasing your progress and giving you more control and visibility over your work. Because “hoping for the best” isn’t a reliable strategy.
💫 Real Results: ClickUp users say they can take on ~10% more work without burning out.
Despite its many benefits, implementing goal metrics isn’t easy. There are several challenges you’re likely to face, Here’s how you can overcome them.
The best metrics need to be aligned to team goals. They measure performance on the desired goal. However, often, teams struggle to identify the right metrics for their goals.
Overcome this challenge with ClickUp. Create folders to track sprint cycles, OKRs, weekly employee scorecards, etc., and derive metrics for each of them.
Teams enthusiastically set goals, metrics, and targets at the beginning of the year. It is common to forget all about it when the rush of everyday work begins.
ClickUp helps you avoid this by automating progress tracking.
One of the reasons teams set and forget goals is that they don’t have constant visibility. Scattered spreadsheets with various adaptations of the goals and metrics make it tedious to access.
ClickUp solves this problem by bringing goals within the context of everyday tasks. It keeps goals visible and relevant to work.
Without a robust project management tool, something as basic as, “how many tasks have we completed?” could be too time-consuming to answer.
ClickUp’s comprehensive task management module is designed to overcome this. By simply using ClickUp, your teams can collect data around tasks, time-tracking, workload, and more.
Every business is always working towards a goal, an outcome they desire. You might disagree with Goldratt and think your primary goal is to change the world. We’re not going to judge.
Whatever your goal, ClickUp will support you. Use ClickUp’s task management, scheduling, monitoring, and goal-tracking capabilities to achieve your goals. Get started right away.
Success metrics are indicators of performance. The goal of success metrics is to give team members clarity, direction, and purpose.
KPI goal metrics are specific measurements used to evaluate an organization’s, team’s, or individual’s performance against predefined goals.

Manasi Nair
Max 18min read

Praburam Srinivasan
Max 21min read
Praburam Srinivasan
Max 14min read

© 2026 ClickUp