Sorry, there were no results found for “”
Sorry, there were no results found for “”
Sorry, there were no results found for “”
Ever stared at a blank page, trying to make sense of a complex idea, only to end up more confused than when you started? 😵💫
Without clarity, even your best ideas can feel scattered, misaligned, and downright overwhelming. Whether you’re a student, teacher, or professional, poor visualization can lead to poor execution.
But here’s the good news: this article is your no-fluff, step-by-step solution for how to make a graphic organizer that actually works. From tools to graphic organizer templates to pro tips—we’ve packed everything you need into one place. 🧠
A graphic organizer is a visual thinking tool that helps you capture, arrange, and connect information in a structured way. Instead of reading through blocks of text or messy notes, you get a clear, visual layout with boxes and images that makes complex ideas easier to understand.
The purpose of a graphic organizer is to visualize information so that your mind:
Here’s how graphic organizers are used in real life:
| Who uses them? | How do they use graphic organizers? |
| Students | To break down lessons, summarize chapters, compare concepts, and structure essays |
| Teachers | To explain topics visually, engage students, and simplify complex subjects |
| Project teams | To map workflows, plan tasks, align goals, and visualize strategies |
| Marketers and Creators | To brainstorm content ideas, design funnels, and plan campaigns |
| Managers and Founders | To structure big-picture thinking, simplify decisions, and share vision |
| Everyday users | To plan personal goals, organize to-do lists, and make clear decisions |
Graphic organizers are powerful thinking tools that enhance comprehension and collaboration. Here’s what you get when you start using them regularly:
🌟 Stat alert: Did you know visual learners make up 65% of the population, yet most information is still shared in plain text? No wonder things get missed or misunderstood!
Not all graphic organizers offer the same functionalities (and that’s a good thing). From mind maps to Venn diagrams to T-charts, here are some of the most popular types, each based on different visualization techniques to help make your ideas crystal clear. We’ll also cover when to use which kind.
Before we go into detail, here’s a quick comparison of the various categories.
| Type | Key Features | Example Use Case |
| Mind maps | Central idea with branching subtopics, visual links between ideas | Planning a blog on “Top 10 Marketing Trends” with branches like AI, Influencer Marketing, etc. |
| Flowcharts | Step-by-step logic, decision paths, process start-to-finish clarity | Mapping out an email campaign journey from brief creation to performance tracking |
| Venn diagrams | Overlapping circles to show shared and unique elements | Top-down branching, parent-child relationships, and structure-based visualization |
| Hierarchical charts | Chronological layout with dates, linear progression, and milestone tracking | Outlining a startup org chart from the Founder to department heads and their teams |
| Storyboards | Panel-based layout, step-by-step idea progression, often paired with notes | Mapping a user journey or presentation flow using visuals with annotations |
| Timelines | Tracking events over time, planning launches, and historical mapping | Planning a product launch with stages like Design (Jan), Beta (Feb), Marketing (Mar), and Launch Day (Apr) |
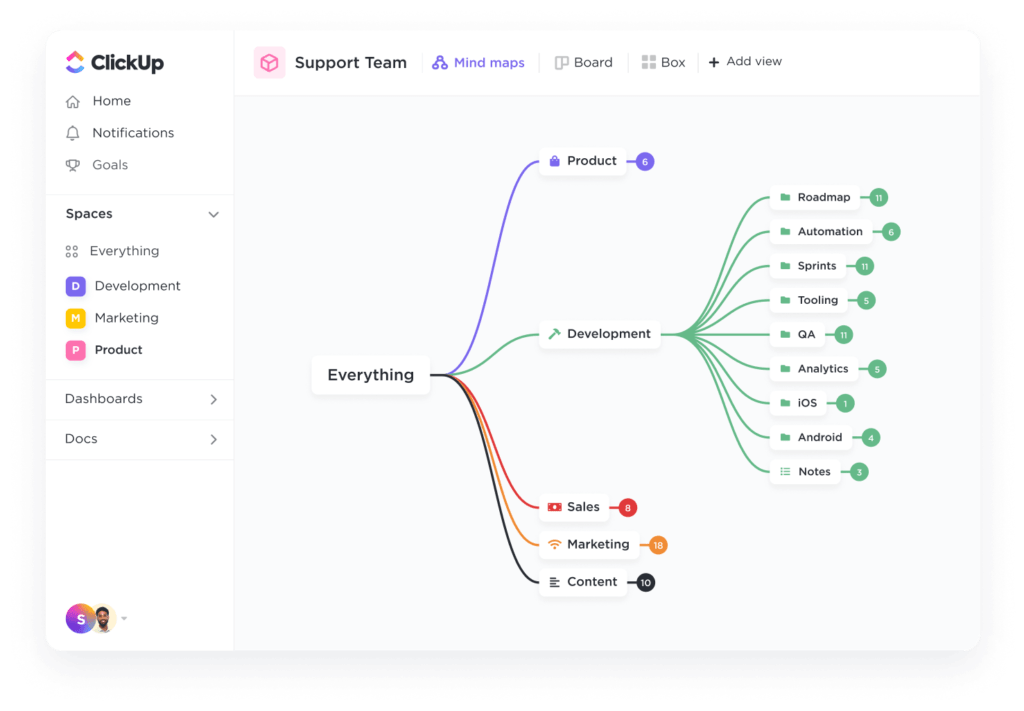
Mind maps are perfect when brainstorming ideas, connecting related thoughts, or exploring a central concept. Typically, you start with one main idea in the center, then branch out into related points.
✅ Best suited for:
📌 Example: Let’s say you plan a blog on ‘Top 10 Marketing Trends Today.’ Your mind map could have the central idea as the blog title, with branches like AI in Marketing, Short-form Video, Influencer Marketing, and Voice Search.
Each branch can then be split further into tools, platforms, and stats, giving you a complete content roadmap at a glance.
Mind maps are especially helpful when your thoughts are scattered and you need to ‘see’ the connections clearly.
Looking for inspiration? Check out some mind map examples to see how teams brainstorm and plan visually across different industries.
💡 Pro Tip: Templates save time. Get started quickly with ClickUp’s Blank Mind Map Whiteboard.
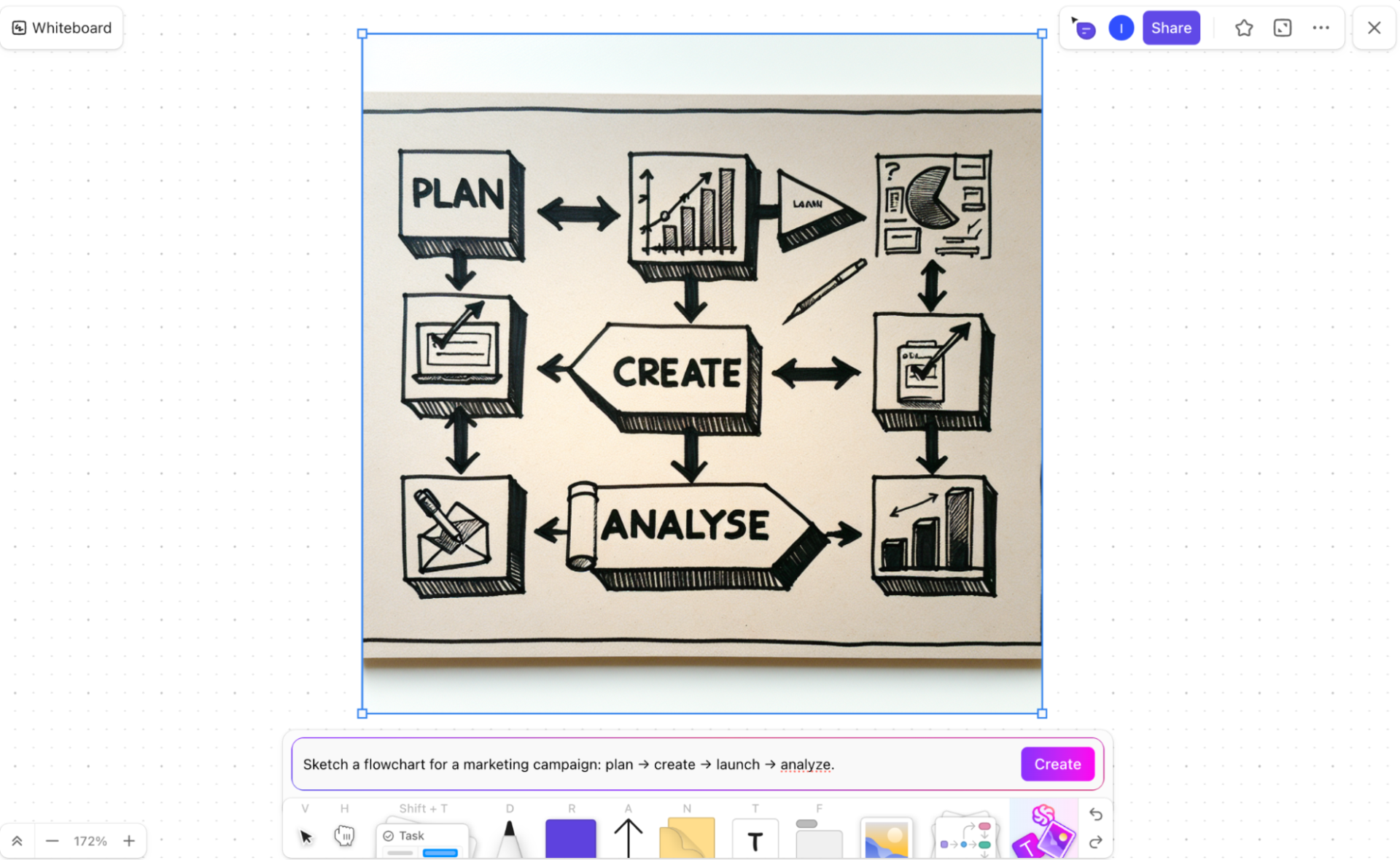
Flowcharts are your go-to tool when you need to visualize a process or workflow step by step. They act like roadmaps that show where things start, what decisions happen along the way, and where they end. 🛣️
Whether you’re simplifying a business process or outlining how a customer moves through your funnel, flowcharts help clarify complex steps.

✅ Best suited for:
📌 Example: Let’s say you’re launching an email campaign for a new product feature. A flowchart can show the whole journey from planning to launch.
You’d start with ‘Campaign Brief Creation,’ then branch out to Audience Segmentation, Copywriting, Design, and Legal Review.
From there, you’d map decisions like ‘Has the copy been approved?’ or ‘Are we A/B testing subject lines?’ Each path leads to steps like scheduling, sending, and performance tracking.
💡 Pro Tip: Of course, we have flowchart templates, too. Try the Process Flow Whiteboard by ClickUp.
Venn diagrams help you compare and contrast two or more things. They’re overlapping circles showing what’s different, what’s shared, and where things connect. 🎯

Here’s the basic idea:
✅ Best suited for:
📌 Example: You’re launching a premium software tool, and you want to understand your ideal customer overlap.
Sets:
The Venn diagram would include:
💡 Pro Tip: Create accurate Venn diagrams with ease using ClickUp’s Venn Diagram Template
🎯Also Read: How to Create a Venn Diagram in Google Docs
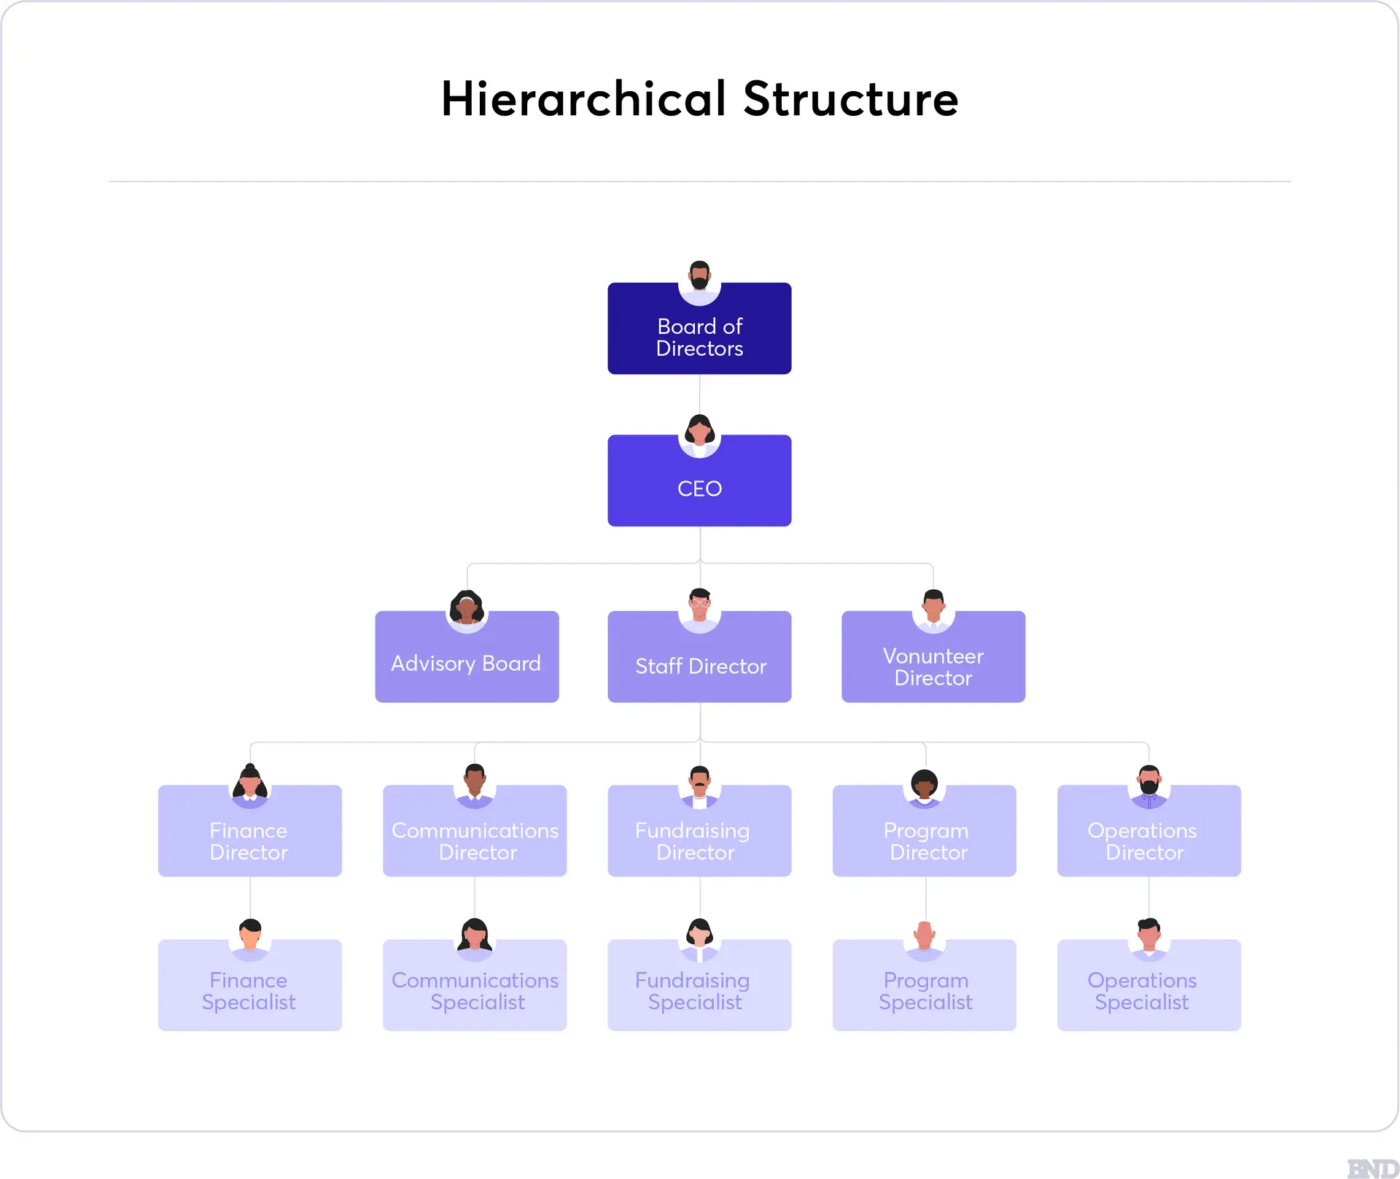
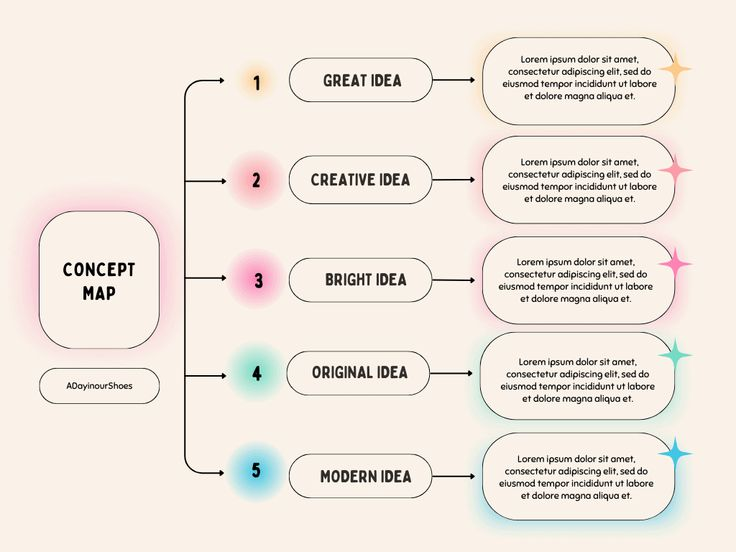
Hierarchical charts help you organize information from top to bottom, showing who reports to whom or what depends on what. They’re like family trees for ideas, teams, or systems. 🌳
They are almost similar to concept maps, which focus on connecting related ideas in a logical, branching format.
✅ Best suited for:
📌 Example: Suppose you’re building a startup team structure. Your chart starts with the Founder at the top and branches out to the Heads of Marketing, Sales, and Product. You add Specialists or Interns below each head. This helps clarify roles and reporting lines in a growing team.
💡 Pro Tip: Hierarchical charts are also great for things like sitemaps. Here’s a free Sitemap Template from ClickUp.
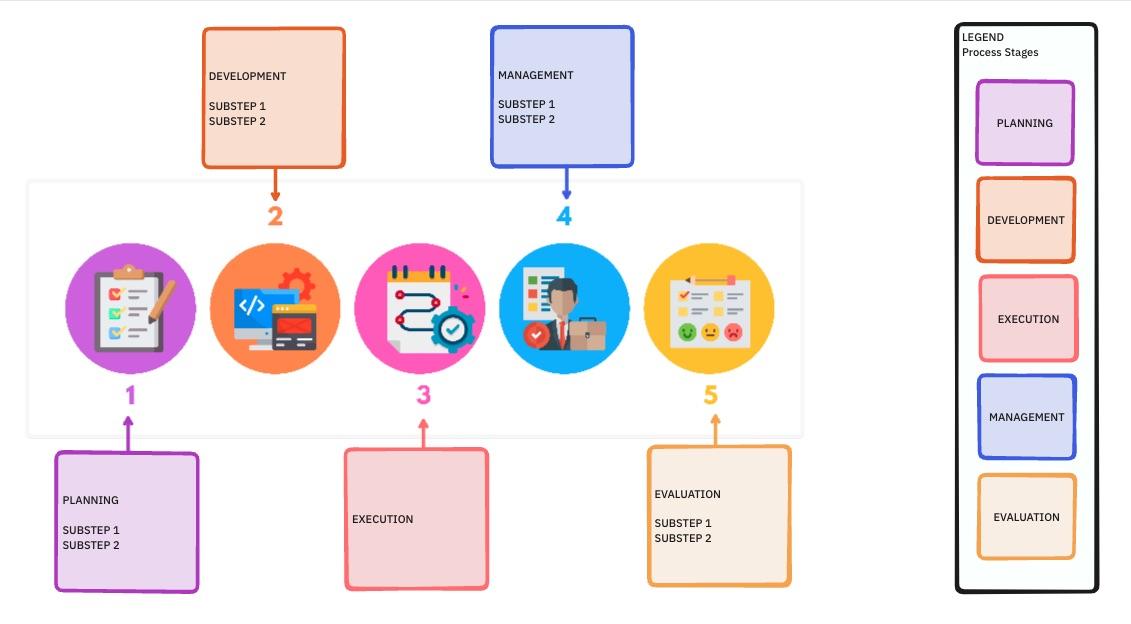
Storyboards and timelines visualize events or actions in a specific sequence. They help you plan what happens, when it happens, and what comes next.
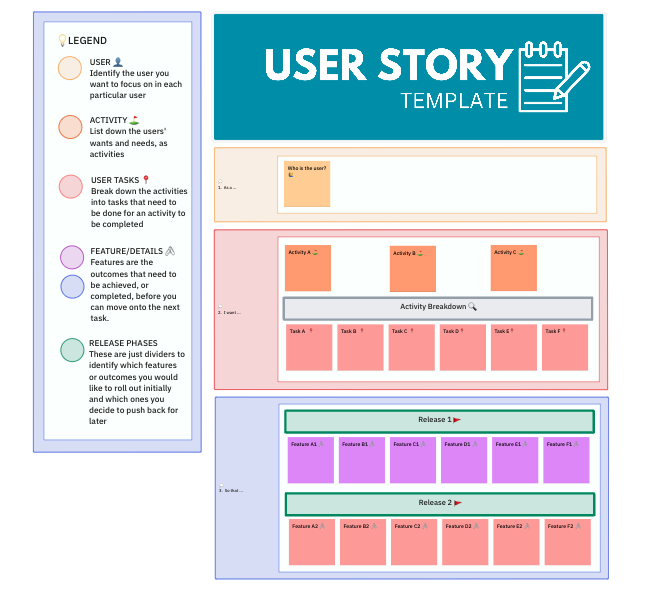
In detail, storyboards use a sequence of boxes or panels to visually represent the progression of a story, process, or sequence of events. They’re a planning tool, primarily visual but often paired with textual notes.
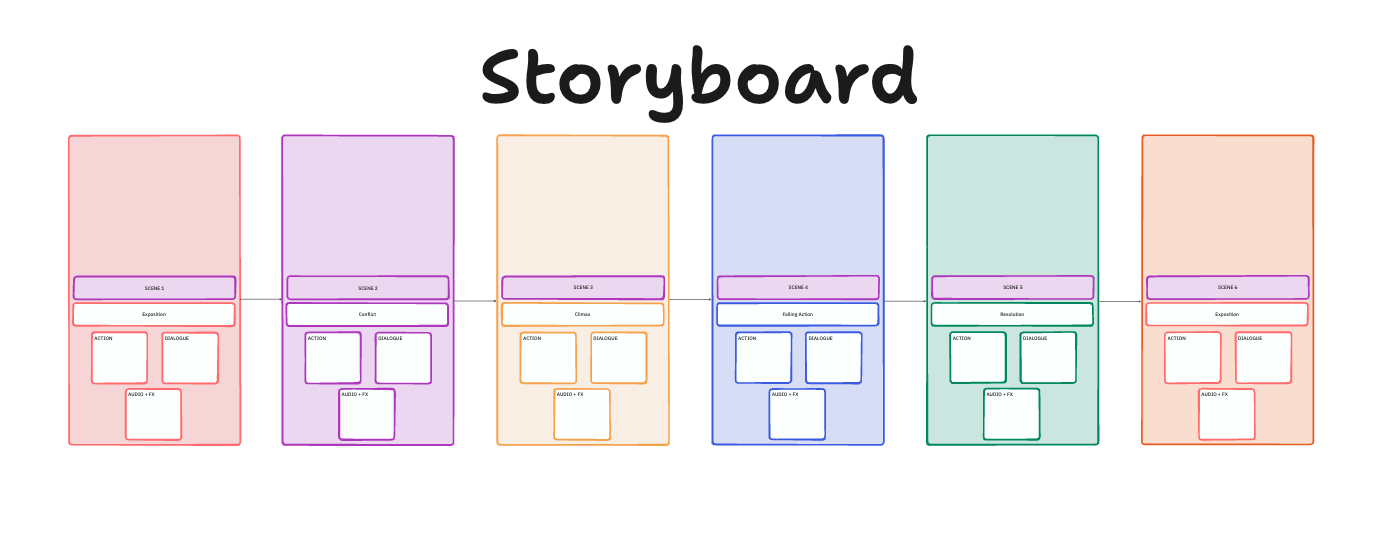
Originally used in film and animation to plan shots, storyboards are now widely used in education, business, UI/UX, and marketing to map out any process that unfolds over time or steps.
✅ Best suited for:
💡 Pro Tip: Create a range of storyboards efficiently with the ClickUp User Story Template
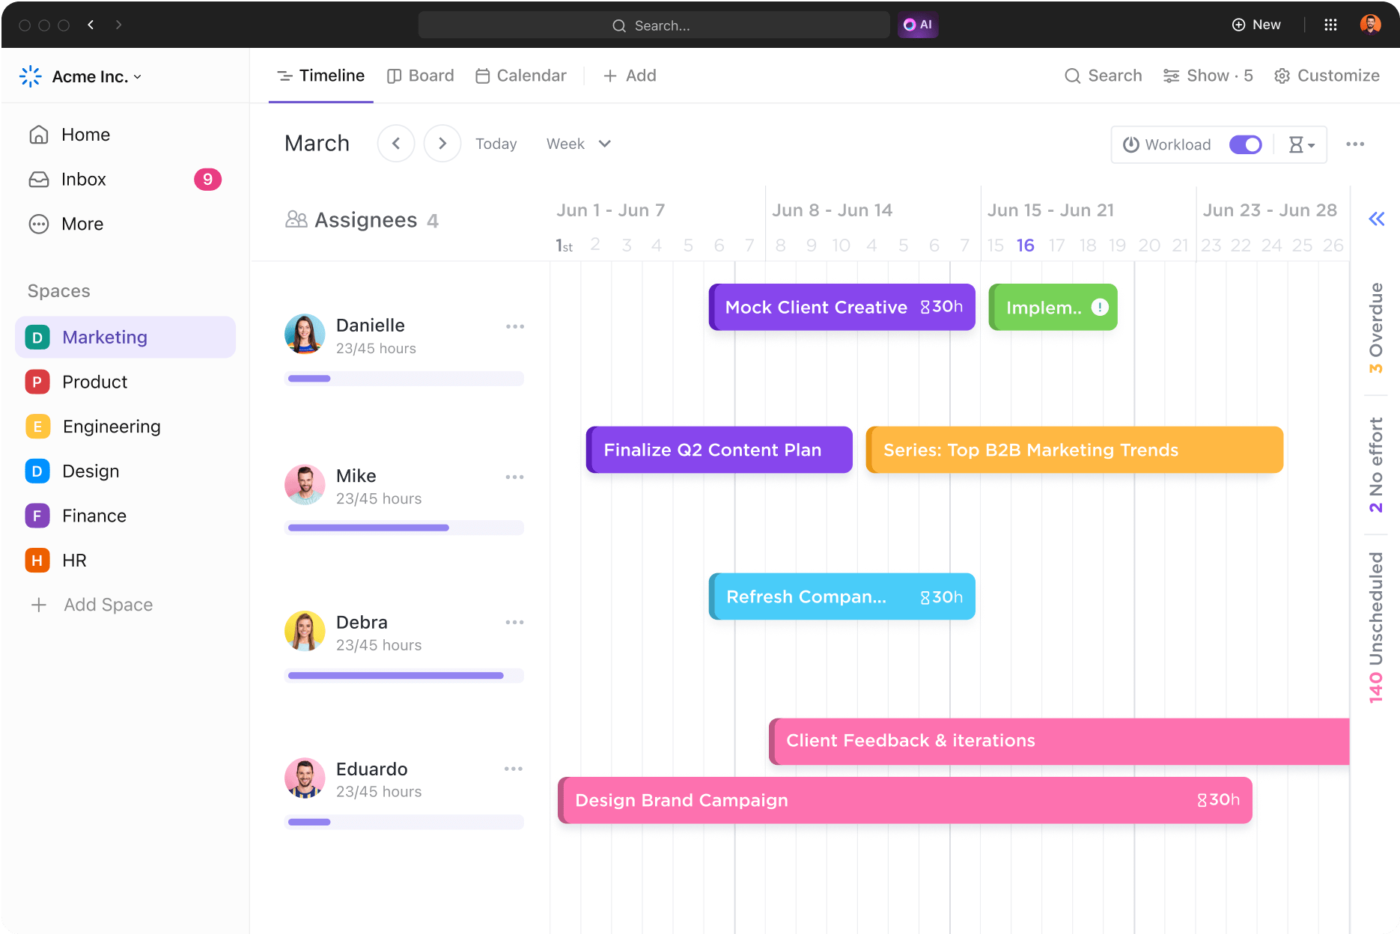
On the other hand, a timeline arranges events in chronological order along a linear path, typically a horizontal or vertical line. Each event is marked with a date or time and a brief description.
Timelines are focused on temporal progression, meaning they’re all about what happened when.
✅ Best suited for:
📌 Example: Let’s say you’re planning a product launch. Your timeline could start with ‘Product Design’ in January, move to ‘Beta Testing’ in February, then ‘Marketing Rollout’ in March, and finally ‘Launch Day’ in April. This gives your team clarity on timing, roles, and what needs to happen when.
At a glance, let’s look at how storyboards and timelines differ:
| Criteria | Storyboard | Timeline |
| Focus | Sequence of actions or ideas | Sequence of events in time |
| Structure | Panel-by-panel breakdown | Date-driven line with event markers |
| Best for | Storytelling, UX, presentations, process mapping | History, planning, roadmaps, progress tracking |
| Used in | Film, design, education, marketing | History, project management, business strategy |
Whether you’re organizing ideas for a project, lesson, content piece, or team plan, your graphic organizer should do one main thing: make information easier to understand, use, and act on.
In this section, we’ll walk you through the exact steps to create a graphic organizer that’s not just good-looking but actually helpful. The best part is that we’ll show you how to do it all using ClickUp’s visual tools, templates, and AI support.
Creating a graphic organizer with ClickUp in five steps:
Before dragging shapes onto a board or opening a template, stop and ask: What is this graphic organizer actually meant to do?
Clarity at this stage is everything. Without it, you risk creating something that looks good but doesn’t help anyone make decisions, find clarity, or take action.
To define your purpose, ask yourself:
These answers shape everything: what format you choose (mind map, Venn, flowchart, timeline), how detailed it should be, and what information to include (or leave out).
Now that you know why you’re creating a graphic organizer, it’s time to pick the best format.
Your chosen format will make your message crystal clear (or totally confusing). So take a minute to match your purpose with the right structure.
Think about:
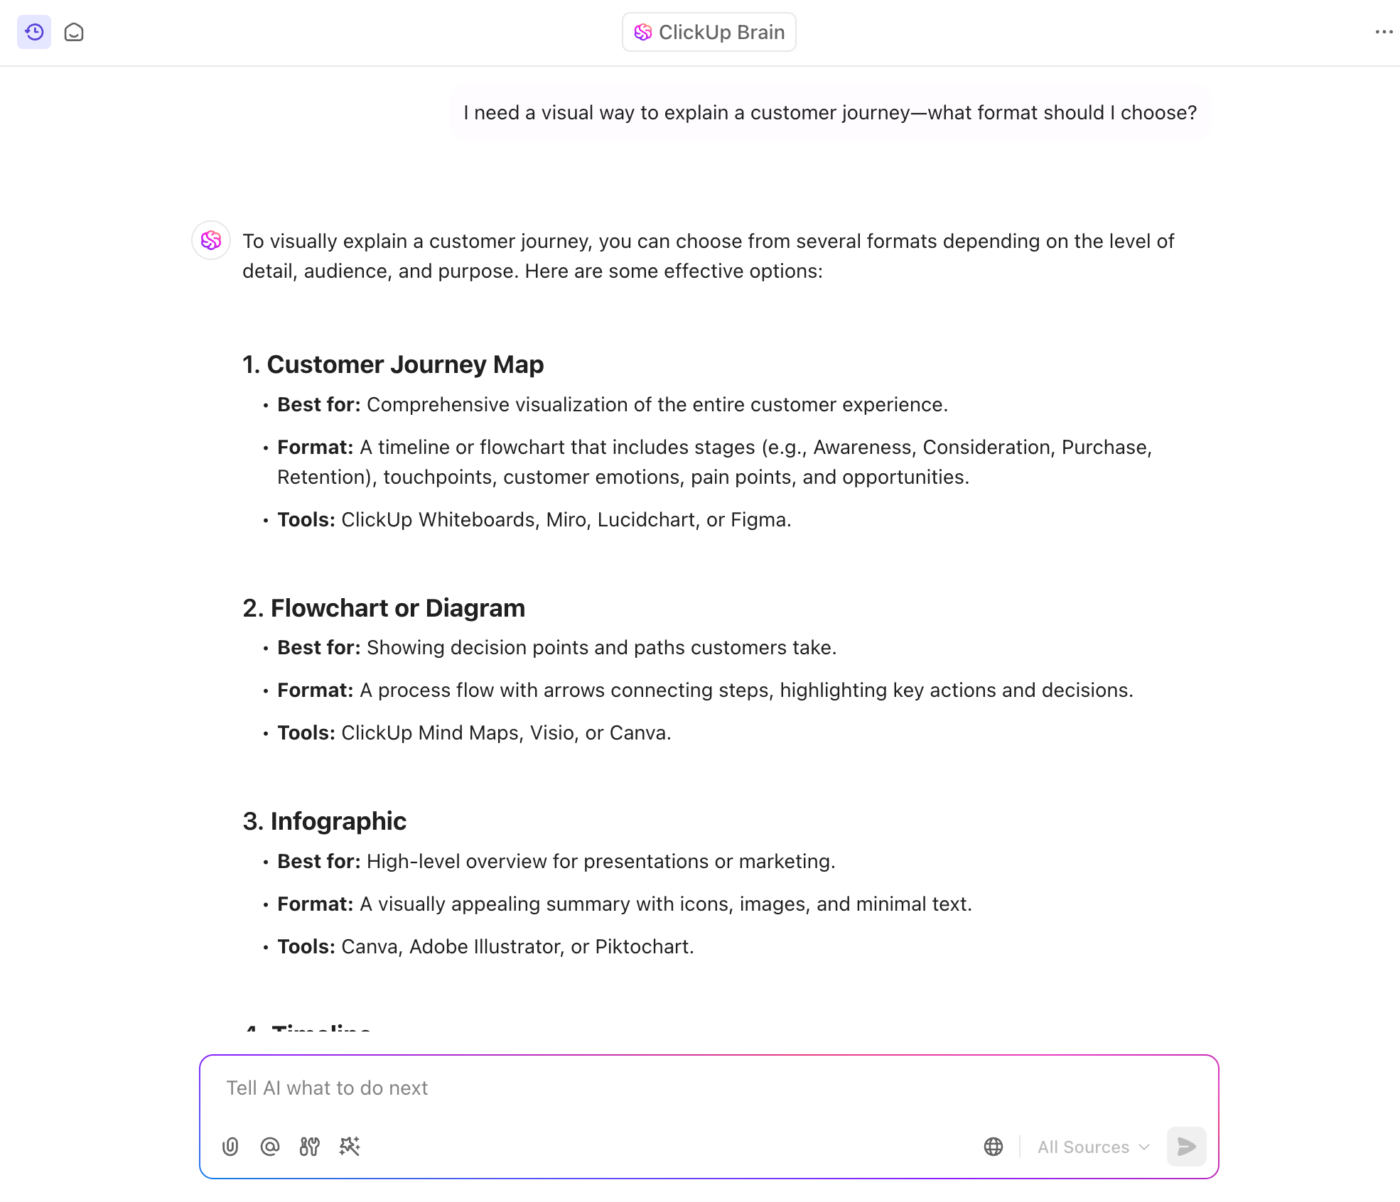
And if you are stuck choosing the format, you can ask ClickUp Brain for help. It’s an AI-powered assistant built into ClickUp that helps you think clearly, plan faster, and avoid decision fatigue.
Try prompts like:
Want to streamline your workflow with ready-to-use frameworks?
Try these templates:
Mind Map templates help you visually organize ideas around a central topic. These are ideal for planning essays, presentations, research, or complex projects where you need a clear overview of relationships between ideas.
Workflow templates outline the sequence of steps needed to complete a task or project. When you’re creating a graphic organizer for process management or task planning, a workflow template helps collaborators follow the process easily.
Brainstorming templates are perfect for capturing spontaneous ideas in a structured way for marketing plans, product development, or creative projects like content planning.
Project roadmap templates visually lay out major phases, milestones, timelines, and deadlines. Built for project planning, they help keep the big picture clear while letting you drill down into specific tasks.
Once you know what your graphic organizer is for and which format you’re using, it’s time to collate the information you’ll put inside, including drawing elements.
For starters, ask yourself 👇
💡 What are the must-know insights, facts, or takeaways my audience needs to walk away with?
💡 Are there clear buckets, phases, or themes I can group this information into?
💡 Does the information follow a sequence, hierarchy, or cause-and-effect flow?
💡 If someone used this organizer without context, would they still get it? If not, what’s missing?
Once you’ve answered these, you’ll have a rough pile of notes, ideas, or data points. Now it’s time to shape that raw material into something structured and scannable.
Think about:
Now, this is where your graphic organizer starts functioning as a visual task management tool. It shows not only what needs to be done or understood, but also how it all fits together.
Once your information has a home, you can bring it to life visually.
💡 Pro Tip: Don’t overfill your organizer. The goal is clarity, not completeness. It’s better to show less and make an impact than cram in everything and lose your message.
Now that your content is organized, it’s time to breathe life into it.
This is where you turn ideas into visuals. Applying the right creative techniques and drag-and-drop tools makes all the difference.
To get started, use ClickUp, the everything app for work and a powerful graphic organizer software.
ClickUp Whiteboards is one of the best whiteboard software for sketching out absolutely any type of graphic organizer—mind maps, flowcharts, timelines, and even Venn diagrams.

Here’s what you can do:
📮ClickUp Insight: 11% of our respondents leverage AI primarily for brainstorming and ideation. But what happens to these brilliant ideas afterward?
This is where you need an AI-powered whiteboard, like ClickUp Whiteboards, which helps you instantly turn ideas from the brainstorming session into tasks.
And if you can’t quite explain a concept, simply ask the AI image generator to create a visual based on your prompt. It’s the everything app for work that enables you to ideate, visualize, and execute faster!
If you’re starting with a raw concept or idea board and need to structure it around a central theme, then ClickUp Mind Maps is what you need.
You can choose between two modes:
Topping it off, use ClickUp Mind Maps to further:
🔍 Did You Know? The popular technique of mind mapping, often used in graphic organizers, was popularized by British author Tony Buzan in the 1970s.
Creating graphic organizers is just the first half of the job. The real value comes when you can actually turn your visuals into action.
Instead of keeping your graphic organizer as a static file or screenshot (like in traditional tools), use visual collaboration software like ClickUp to save and embed visuals directly into your workflow so everything is actionable.
Here’s how you can plug your visuals into your workflow:

You’ve built your graphic organizer—now it’s time to polish it up and share it with your team or audience. This final step ensures that your visual actually works for everyone.
Here’s how to refine:
A well-refined graphic organizer should be clean, clear, and immediately helpful.
Speaking of helpful, ClickUp makes it incredibly easy to share your graphic organizer and work on it as a team.
Here’s how:
ClickUp Whiteboards are built for teamwork. Whether you’re brainstorming or fine-tuning a final version, everyone can jump in—together. It’s a powerful way to support workplace collaboration, ensuring your entire team can contribute efficiently.
Here’s what you can do:
⚡ ClickUp Hack: When you need to spark creativity faster, use ClickUp Brain directly on Whiteboards to generate rough visuals, diagrams, or early mockups right in the moment. Once done, share them across your team or invite them to collaborate on the same platform.
ClickUp gives you full control over how and with whom you share your graphic organizer:
📚 Also Read: Visual Project Management Guide
Creating a great graphic organizer is about clarity, structure, and action. 💡
Each step plays a big role, from choosing the right format to organizing your ideas and designing your layout. You could choose to do this with a separate online graphic organizer maker, but why bother when you can do it all in ClickUp? And with ClickUp, you don’t just stop at planning—you take action. ✨
Whether you’re mapping a process, brainstorming with your team, or building a strategy board, ClickUp turns visuals into tasks, timelines, and real progress.
So next time you look for an online graphic organizer or maker, just open ClickUp and start building.
Sign up for ClickUp today!

Sudarshan Somanathan
Max 25min read

Manasi Nair
Max 24min read

Praburam Srinivasan
Max 23min read

© 2026 ClickUp