

“Efficiency is doing better what is already being done,” wrote Peter Drucker, the father of modern management, while discussing it as a key factor in business optimization.
Across industries, geographies, sizes, and types, efficiency is a fundamental way in which businesses maximize their profitability. Whether optimizing a manufacturing line, reducing pizza delivery time, or improving developer productivity, efficiency reduces costs and increases revenue.
In this blog post, we explore a specific type of efficiency—flow efficiency—which opens up a new perspective in operations management.
How to Calculate Flow Efficiency to Improve Productivity
What is Flow Efficiency?
Flow efficiency is the proportion of active time you spend performing a task versus the total time the task takes.
Let’s take the example of making pizza. It typically involves preparing the dough, making the sauce, assembling the pizza, baking it, and serving it to the customer at the table.
- If each of these five steps takes 2 minutes, the time spent performing the task is 10 minutes
- However, if there is a delay of 6 minutes because the oven is not available, the total time the task takes is 16 minutes
- Flow efficiency is 10/14, which is 62.5%
In contemporary project management, achieving high flow efficiency is synonymous with operational excellence. So, calculating that accurately is the first step to optimizing your processes.
How to Calculate Your Flow Efficiency?
Flow efficiency calculation is a straightforward process that involves understanding the time spent on active work versus the total cycle time of a task or project.
Here’s a step-by-step guide to help you in tracking flow efficiency accurately.
1. Outline what ‘task’ entails
Depending on the work you’re doing, the task can be one step or a series of multiple steps. To calculate flow efficiency, you need to know what constitutes your task.
For example, as a software engineering team, if your ‘task’ is launching a feature, it might include:
- Design
- Development
- Testing
- Deployment
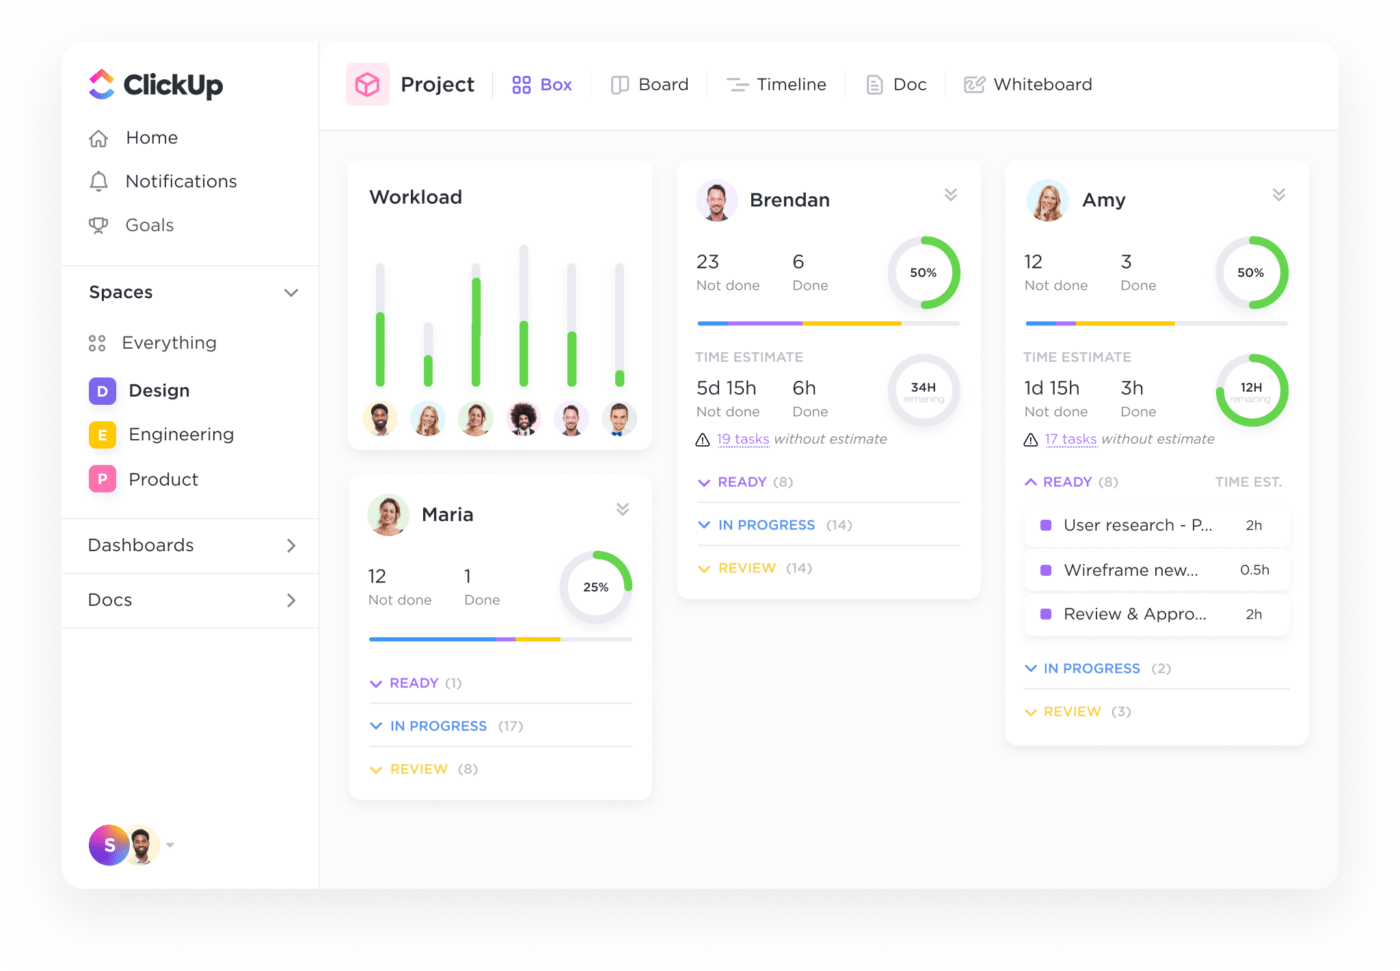
If you’re using a project management tool like ClickUp, you might already have this breakdown set up. If not, no sweat! Any process-mapping tool can help you map it out. You can also use ClickUp Whiteboard to outline the team’s collaborative workflow.

2. Calculate active work time
Active work time is the weeks/days/hours when the task is being actively worked on. In the software project we saw above, this is the number of hours a designer is coding the software or a quality analyst is running tests.
The best way to capture this information is by tracking time on each task. ClickUp time-tracking allows every team member to track their active work time by starting a timer or adding in manually.

Let’s say, the software engineering team works on each task in the following way.
- Design: 10 hours
- Development: 24 hours
- Testing: 4 hours
- Deployment: 2 hours
The total active work time is 40 hours or one person-week.
It is important to note here that testing taking four hours doesn’t mean it can be delivered in half a day. Depending on availability, capacity, urgency, priority, etc., the quality analyst can do it at once or spread it over a week.
3. Calculate total cycle time
Total cycle time is the duration from when the task starts to when it is completed, including both active work and idle time. This is typically measured in days/weeks instead of hours.
The simplest way to calculate total cycle time is completion date—start date. So, if the design began on January 1st and deployment was completed on January 28th, your cycle time is four-person weeks.
With ClickUp, you can assign a start date and end date to every task, making it extraordinarily easy to find cycle time.
4. Calculate flow efficiency
Once you have the total active time and total cycle time, use the formula below for measuring flow efficiency.
Flow efficiency = (Active work time/total cycle time)×100
Extending the above example: Flow efficiency = (one person week/4 person-weeks)x100 = 25%
5. Learn flow efficiency gaps
In our above example, 75% of the time, or three person-weeks, is not active work time. This is time spent waiting/idle: waiting for feedback, waiting for other team members to complete their tasks, or waiting for approval to move to the next stage.
Improving flow efficiency starts by reducing wait time. Before we show you how to put flow efficiency in the context of other related metrics,
Other KPIs Related to Flow Efficiency
While the flow efficiency metric is important for project managers, it doesn’t mean much on its own. For instance, at 25% flow efficiency, are team members productive?
At face value, this might look like your team is wasting 75% of their time. But that’s not true. Your teams might be working on four features (i.e., flows) in parallel, being productive 100% of the time.
To avoid such confusion, it is essential to understand flow efficiency in relation to other metrics.
Throughput
Throughput measures the amount of work completed in a given period. It is a direct indicator of a team’s productivity. For a software engineering team, throughput would be the number of features launched in a given time period.
So, your team might launch ten features in four weeks, and your throughput is ten, even though your flow efficiency is still 25%.
Lead time
Lead time is the total time taken from requesting a task to its delivery. It encompasses both active work time and idle time. In product development, this is from when a customer or business team member makes a request to when it’s pushed to production.
In addition to the active work time/cycle time, lead time also includes the time it takes to write the user stories, prioritize them, assign resources, etc. So, if your team is busy for the next six months with already planned releases, your lead time may be seven months, even if the flow efficiency is 25%.
Resource utilization
Resource utilization tracks how effectively a team or organization uses its available resources, including personnel, tools, and time.
If your flow efficiency is 25% and your resource utilization is also 100%, it’s clear that you can’t take on more work. If the resource utilization is also 25%, it means you have the capacity to do a lot more.
Work in Progress (WIP) limits
WIP limits restrict the number of tasks or projects that can be in progress at any given time. It is used to ensure that efforts are concentrated on completing tasks before new ones are started, thereby reducing cycle times and increasing throughput.
WIP limits help in increasing flow efficiency by prioritizing tasks that have already begun.
Together, these metrics can be beneficial in improving your flow efficiency continuously. Here’s how you can use them in your optimization processes.
Tips to Improve Flow Efficiency
The first step to improving flow efficiency is calculating it accurately and identifying gaps. Based on that information, try the following tips.
Set work-in-progress (WIP) limits
It should be obvious not to start new work when the current ones are still incomplete. Having too many tasks open can delay them all. Good backlog prioritization can help maximize the value of items under development.
Use ClickUp to set WIP limits on boards, ensuring that workloads are manageable and that each task receives the attention it deserves.

However, this can become counter-productive in complex organizations for multi-step tasks. For instance, if you make a developer wait until the feature is deployed, you will have at least eight hours of idle time, impacting your flow efficiency.
Use WIP limits in collaboration with team productivity, workload, and throughput to optimize results.
Automate workflows
Automate simple and repetitive tasks to streamline process flow. Engineering teams use test automation all the time to achieve this.
With ClickUp project management software, project managers can also automate admin tasks such as assigning users, creating reports, and sending follow-ups/notifications.
Automation improves average flow efficiency by:
Expediting admin tasks: If the flow efficiency gap is due to the project manager’s resource constraints in reviewing all the completed tasks, automation can eliminate it effectively
Preventing delays: Setting up automated reminders to notify you of delays/deviations can help you get on top of the situation beforehand
Eliminating dependencies and bottlenecks: Let’s say the designer has completed their step, and it needs to be assigned a developer. When this is manual, it depends on the project manager’s availability.
When you automate this process, tasks can automatically move from the ‘design’ list to the ‘development’ list, from which developers can assign tasks to themselves and begin work. This not only improves efficiency but also creates ownership and accountability among team members.

Manage resources better
Resource allocation plays a key role in flow efficiency in a complex, multi-step process. For instance, it takes four hours to design a feature and 24 hours to develop it. This means that in the time a developer takes to code, the designer can create six features.
So, even in the crudest interpretation, this project needs only 1/6th of a designer for every developer. Or six developers for every designer. This might require some resource leveling.
Understand the nitty-gritty details and plan resources accordingly. Actively eliminate bottlenecks and plan for a seamless flow of work. ClickUp resource management features are designed to enable exactly this.
For a headstart on effective resource planning, adapt and customize a resource planning template.
Encourage team collaboration
Most flow inefficiencies happen during hand-offs. A designer and developer might need a few hours to transfer knowledge before the latter can begin active work on that feature. Such process improvement needs better team collaboration.
ClickUp’s collaboration features, such as nested comments, shared documents, real-time editing, chat view, etc., enable team members to communicate and collaborate effortlessly.
Have a question? Leave a comment. Don’t know the acceptance criteria? Look up the task description. Need more on the use case? Read the user story on ClickUp Docs. Still unsure? See who’s online and ping them for help!
ClickUp creates a robust virtual workspace that reduces communication gaps and makes workflow more efficient.
Always keep your eyes on the prize
Relevant, accurate, and meaningful insights are the foundation of efficiency optimization. Set up real-time reposts on ClickUp Dashboards customized to the metrics you care about, including flow efficiency.

Improve Flow Efficiency with ClickUp
The fundamental question that drives any operational excellence initiative is, “Is this the best we can do?” Most often, the answer is no.
For continuous improvement, organizations today need a strategic approach to eliminating gaps, minimizing inefficiencies, and optimizing workflows. This approach includes insights, action, and automation. ClickUp enables all this and more.
With dashboards and reporting tools designed to power good project management, ClickUp builds on data.
By integrating notes, tasks, projects, resources, and collaborative tools in one platform, ClickUp makes it easy to take action.
Pre-designed templates, 100+ automations, and ClickUp Brain take away the busywork, empowering you to focus on what matters.
Build better products, from the beginning, till the end and beyond. Try ClickUp for free today.
FAQs about Flow Efficiency
1. Why do we measure flow efficiency?
We measure flow efficiency to minimize unproductive/idle time in the workflow. Good flow efficiency ensures that the product can be shipped as soon as the active work is done.
2. Why is flow efficiency important?
Flow efficiency is the ratio between active work and total time to deliver. It is important as it helps organizations reduce the time it takes to serve a customer’s request. For instance, if you need 2 days of active work time to create a product, but have a cycle time of 20 days to deliver, your flow efficiency is 10%.
This shows that by reducing cycle time, you can increase throughput and maximize revenue significantly.


Everything you need to stay organized and get work done.

Recent Articles
Claude Skills for Project Management: A Practical Guide 
Claude Skills for Project Management: A Practical Guide
How to Write a Scope of Work (+ Examples & Templates)
How to Write a Scope of Work (+ Examples & Templates)

