


Still downloading templates?
There’s an easier way. Try a free AI Agent in ClickUp that actually does the work for you—set up in minutes, save hours every week.
Sorry, there were no results found for “”
Sorry, there were no results found for “”
Sorry, there were no results found for “”

Learning to create a Venn diagram directly in Google Docs can be incredibly useful when writing a research paper, documenting your findings, collaborating with a team, or working within the Google ecosystem.
Think of it this way: you’re writing a blog post in the Doc—it’s a comparative analysis of three different SaaS products. How do you illustrate which features are unique to each product and which are shared?
Should you opt for software comparison templates? Sure, but you can also make a Venn diagram on Google Docs—without any fuss and give your blog post a much-needed aesthetic boost.
But how do you do it? 🤔
In this article, we’ll explain the process step by step and introduce a bonus tool that makes visualizing the relationships between different data sets, ideas, and concepts even more effortless.
Currently, there are no built-in Venn diagram templates available on the platform. That means you must roll up your sleeves and design the diagram creatively. Simply follow these steps:
1. Go to the Google Docs homepage and open a blank or an existing document.
2. On the menu bar, Click the ‘Insert’ tab. Go to ‘Drawing’ and select ‘New’.

3. Click on the ‘Shape’ icon from the ‘Drawing’ panel.

Forget fiddling with shapes in Google Docs. ClickUp’s Venn Diagram Template lets you map overlaps, differences, and shared goals in a visual format that’s easy to build, edit, and share.
4. Hover over ‘Shapes’ to open a dropdown comprising different shape options. Select ‘Oval’ as shown below.

5. Click and drag on the ‘Drawing’ panel to draw the first circle in whatever size you prefer. Hold the ‘Shift’ key while drawing to ensure the circle is perfectly round.

6. Add a new circle or copy and paste the existing circle to create the second and third circles on the Google drawing window.
7. Position the three circles so that each overlaps partially with the other two, forming a Venn diagram shape.

Remember: You need at least two circles to create a Venn. You can add more circles depending on what you want to showcase. However, for this example, we’ll create a basic diagram with three circles.
8. Select any circle to view all color and formatting options in the ‘Drawing’ panel. Click on the ‘Fill color’ icon.


9. Choose your preferred color from the dropdown. To adjust its transparency level, click the (+) sign under ‘CUSTOM’ as shown below.

10. Customize the circle using the transparency adjustment scrollbar. Click on the “OK” button to apply the changes.

11. Use different colors for each circle to differentiate between sets. Alternatively, you can choose the ‘Transparent’ option if you don’t want to add any color.

12. The next step is to label each circle and the overlapping bits for context. For that, select the ‘Text box’ icon.

13. Click and drag within the circles (or around them) to draw text boxes and type your desired copy. You can also change the font type and size in this step.

14. Once done editing, click the ‘Save and Close’ button at the top-right-hand side of the ‘Drawing’ panel.

And your own Venn Diagram is ready for use.
Repeat all the steps to create a new Venn diagram in Google Docs.
Please note: Unlike other Venn diagram alternatives, which allow you to link data directly to the design, Venn diagrams in Google Docs demand manual adjustments and annotations for data representation.
Bonus: How to Make a Family Tree on Google Docs!
Although Google Docs is free and easy to use, at the end of the day, it’s not a complete Venn diagram software. Here’s why:
First, you need to manually create shapes (circles) and arrange them in a Venn layout. This activity can be labor-intensive and time-consuming since the templates on Google Docs do not support the overall design process.
Unlike specialized diagram examples and software, Google Docs doesn’t automatically calculate or display the intersections or differences between sets. You must determine and place the elements without snap-to-grid or alignment guides.
Plus, you must return to the ‘Diagram’ panel on Google Docs to update the existing Venn diagram every time your datasets change.
The available space within a Google Doc can be restrictive for complex or multi-set Venn diagrams. It might be tedious to fit everything neatly into a single document.
Google Docs excels in real-time text collaboration. But if you think you and your team members can adjust the Venn diagram on the platform simultaneously, just like with other comparison chart templates, then that’s not possible.
Since you’re doing everything manually and from scratch, there’s always a high potential for errors, such as misalignments, incorrect intersections, and inconsistent shape sizing. This can be especially frustrating if you’ve never created a Venn diagram on the platform.
You can only save your Google Doc as a PDF, text, or Word document. This isn’t ideal if you have to present your Google Docs Venn diagrams to a large audience or include them in a more visually appealing format, such as a PowerPoint presentation or an image file.
Since we’ve discussed areas where Google Docs falls short, the next task is finding effective alternatives that meet your visual representation and data comparison needs. And one tool that can help experiment with more complex visualization techniques, is ClickUp.
That’s right!
ClickUp is an all-in-one project management software that offers customizable features to track project progress, streamline operations across departments such as sales, marketing, CRM, and HR, and enhance real-time team collaboration.
Let’s see how it helps build Venn diagrams.
To begin with, the user-centric and adaptable ClickUp Venn Diagram Template is a wonderful option for demonstrating a logical relationship between two or more sets of items—minus the learning curve.
This scalable whiteboard template allows you to identify parallels and variances between data sets, assess diverse elements, and analyze patterns and trends. It further assists in organizing information into logical, useful buckets.
It is easy to populate the template as long as you know what you want to show in your Venn diagram and why you want to show it.
1. To begin, create a Doc in ClickUp and define the intent behind your diagram. This will help you clarify your vision and share it with the rest of your team.

2. Next, collect all the data you need for diagram creation. You can assign individual data collection tasks to your team members with ClickUp Tasks.
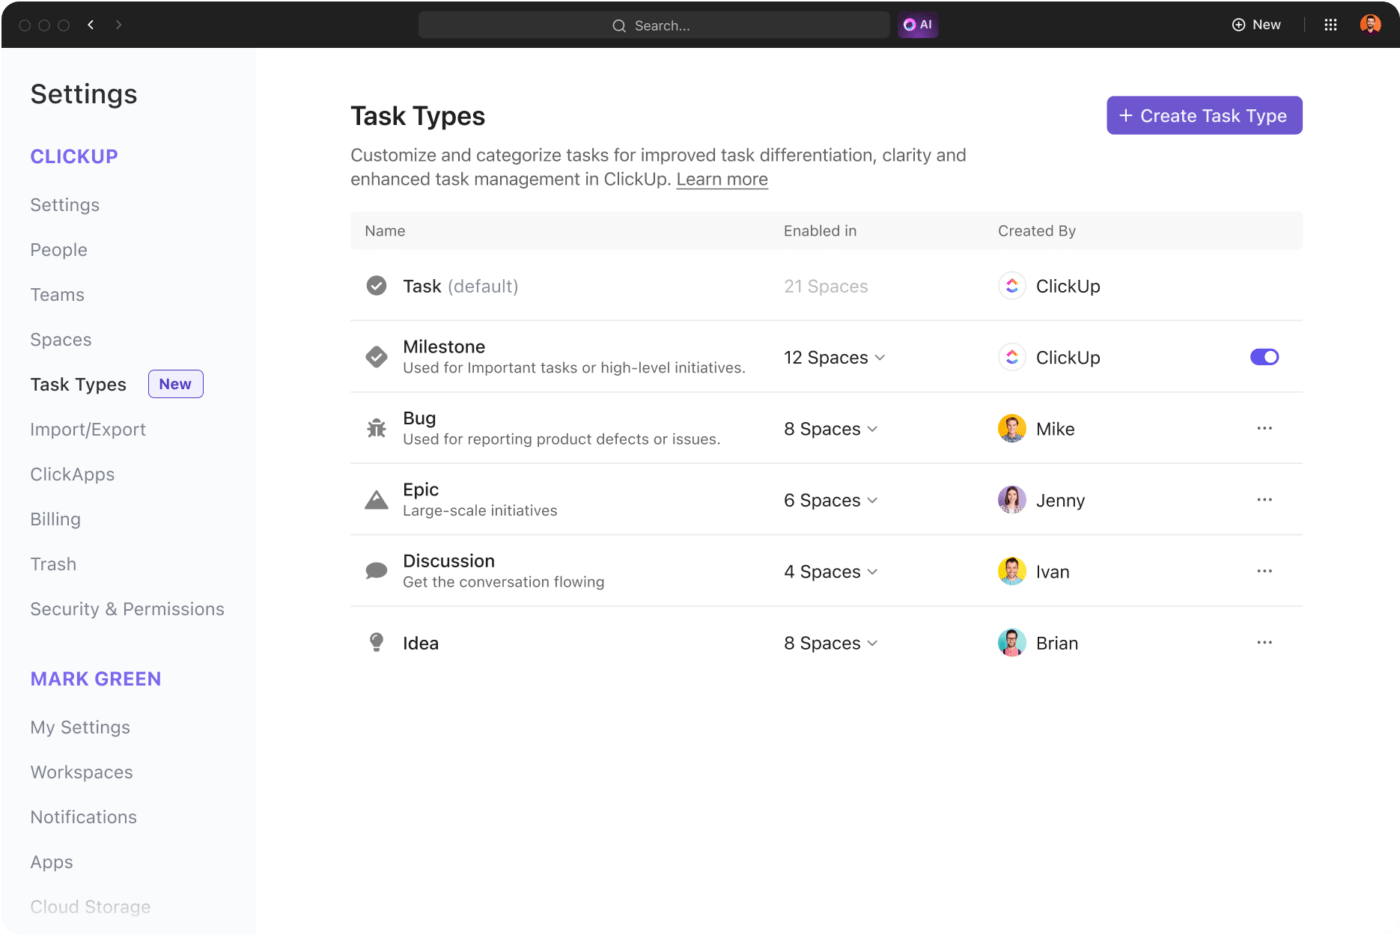
3. Write descriptions for your to-dos and interlink dependent items, such as relevant URLs, files, and relationships with Task Types. You can also set priority levels, such as “Scoping,” “In Progress,” “Pending Review,” and “Done,” so your team always knows what to pick first.
4. Once this homework is done, create a diagram in ClickUp using the Board view. Map out your datasets—draw two circles that intersect in the middle and label each circle with one of the sets of data you collected.
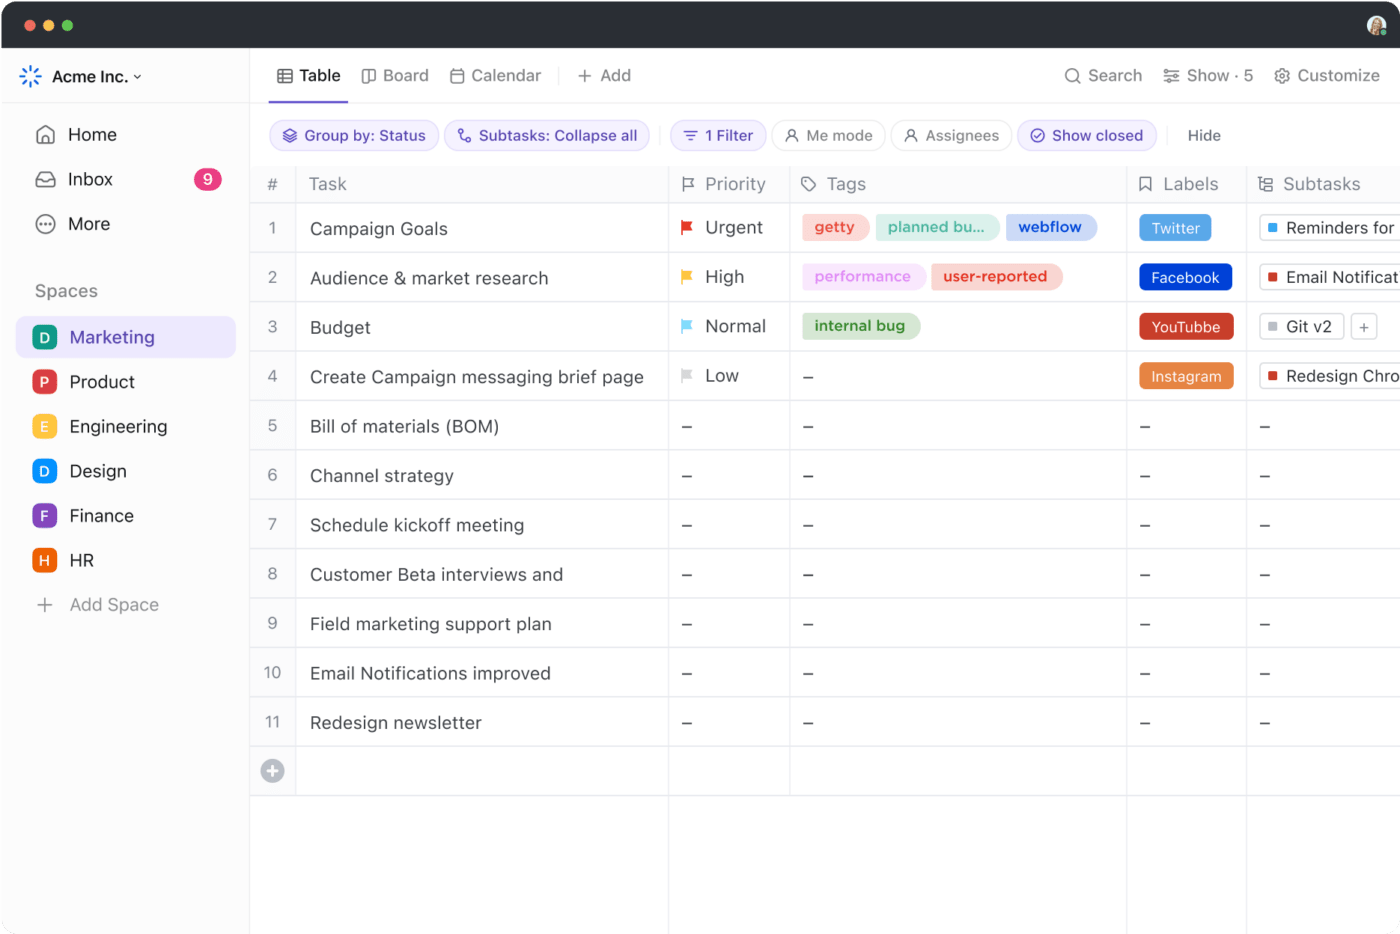
5. To ensure data control, share the Board with only a handful of team members. Then, add the data points to the diagram using the ClickUp Table View. The overlapping area must indicate the points common to both sets.
And just like that—your newly created Venn diagram on ClickUp is ready for review and analysis.
Wait, there’s more! ClickUp offers visualization options beyond Venn diagrams.
Imagine having a flexible canvas where you could easily drag and drop sticky notes, connectors, text boxes, and all the shapes—whatever you need to organize your thoughts or map out processes just the way you like.
Sounds too good to be true, right? ClickUp Whiteboards makes that happen.
It also allows you to draw freehand and embed images, web links, and trackable tasks on the same canvas.
Moreover, you and your team can collaborate and edit the Whiteboard in real time. It’s like having flowchart software that evolves with your input, visualizing any concept and letting your creativity flow unrestrained.

If you’re the type who likes to think in layers or view things in a nonlinear fashion, then the ClickUp Mind Maps feature won’t disappoint. Here, you can add nodes and subnodes easily, representing different ideas or tasks that can be linked to specific team members and deadlines.
To keep everything tidy, you can personalize each node with colors, text, and attachments. Alternatively, you can use Blank Mode to create tasks freely and Tasks Mode to manage tasks.
In addition, you can quickly reorganize the Mind Map with Re-Layout, preserving the map’s hierarchy and improving readability. Connect the dots faster with cascading views, advanced sorting options, and custom colors.
So, ditch the standard flowchart templates and try a more visually impactful planning method—use this intuitive mind mapping software by ClickUp today.
Making a Venn diagram on Google Docs might not be something you do every day, but it’s a handy skill. It helps you visualize how different ideas or pieces of information overlap, making everything more transparent.
If you’re looking for even better diagram tools, you can always rely on ClickUp’s offerings. Its Venn Diagram Template, for instance, is highly customizable and collaborative. Whether personal or professional, it fulfills all your requirements, helping you create and customize professional Venn diagrams just how you want them.
Plus, with ClickUp’s Whiteboard and Mind Map features, you can brainstorm, organize, and present your data in an efficient way. Trust us, creating a Venn diagram on ClickUp is incredibly satisfying creatively.
Try it for yourself. Sign up on ClickUp for free.

© 2026 ClickUp

There’s an easier way. Try a free AI Agent in ClickUp that actually does the work for you—set up in minutes, save hours every week.