

When Henry Gantt introduced the Gantt chart over a century ago, he probably didn’t expect it to become as popular a tool as it has become.
Even today, these versatile tools are used for project management in various industries, including construction, information technology, manufacturing, healthcare, and education.
They give users a visual representation of project timelines, tasks, and dependencies—facilitating planning, scheduling, and tracking.
Do you want to enhance your project planning by using one yourself? Here’s a step-by-step guide to creating a Google Sheets Gantt chart.
If you’re more of a visual learner, check out this vlog to discover the power of Gantt charts to effortlessly manage tasks and dependencies.
⏰ 60-Second Summary
- The platform enhances collaboration and flexibility, making it suitable for teams of all sizes
- Gantt charts visualize project timelines and tasks, useful across various industries
- Follow a simple 5-step process in the guide below for creating Gantt charts in Google Sheets
- Google Sheets offers Gantt chart templates that save time and simplify setup
- The limitations of Gantt chart in Google Sheets include manual updates, limited customization
- ClickUp offers advanced Gantt chart capabilities, automating task scheduling and tracking
- ClickUp’s Gantt Chart View allows for easier management of complex projects with dependencies
How to Create a Gantt Chart in Google Sheets | ClickUp
How to Make a Gantt Chart in Google Sheets
Creating a Gantt chart using Google Sheets can be a handy way to manage project timelines and tasks without using complex project management software.
Let’s get going!
Step 1: Prepare your data

Let’s say you’re planning for a product launch. First, open a new Google Sheets file and start by entering the essential project data in columns.
To create a basic Gantt chart, you’ll need to set up the following columns:
- Task name: List all the tasks with descriptive names so they’re easy to identify
- Start date: Input the scheduled start date for each task. This information helps establish the order of tasks and identify any dependencies
- End date: Add the end date by which each task should be completed. This helps set clear deadlines and visualize task overlap within your project’s timeline
- Duration: Leave this column empty for now; we’ll calculate the duration based on your start and end dates in the next step
Step 2: Calculate duration

Next, you’ll want to calculate how long each task will take.
- Click on the first cell under the Duration column (let’s say it’s D3)
- Enter the formula to calculate the duration: =Days(End Date Cell, Start Date Cell)
- For instance, if your end date is in column C and your start date is in column B, the formula for row 3 would look like this: =Days(C3, B3)
- Press Enter. The cell with the formula will now display the total number of days required to complete the task
- Click the small blue square at the corner of the cell with the calculated value and drag it down to copy the same formula for all your tasks
Now, your table should look like this with the duration for all your tasks calculated:

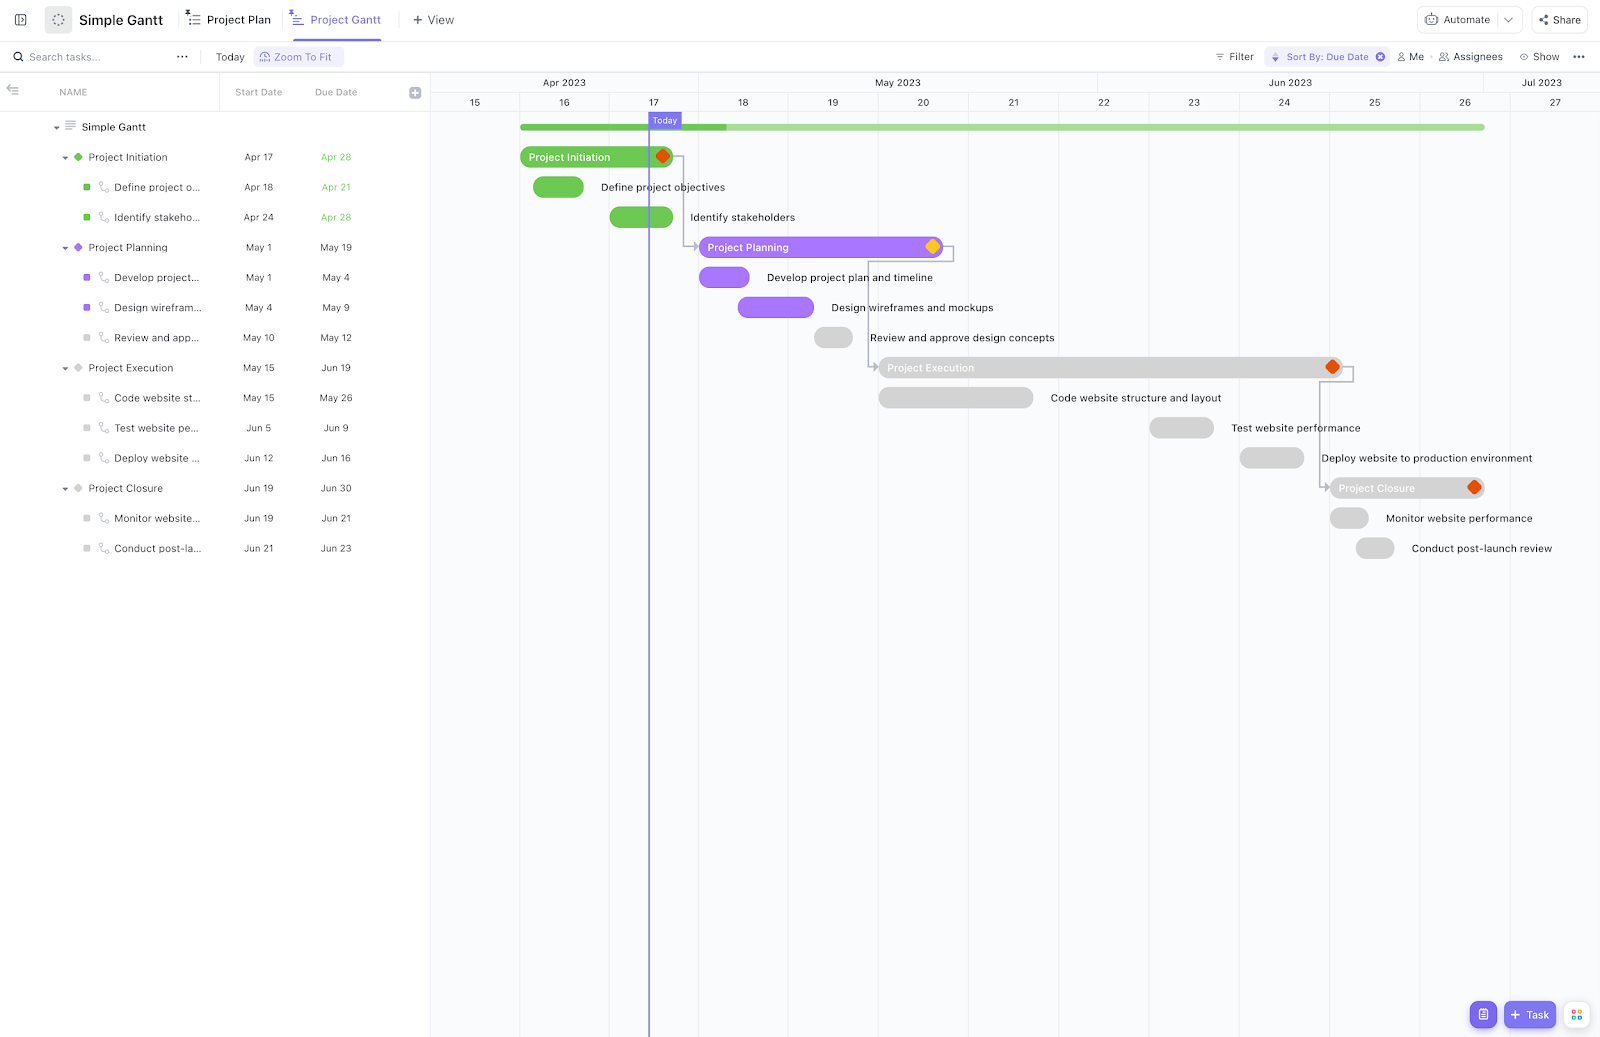
⭐ Featured Template
Making a Gantt chart in Google Sheets can slow you down. ClickUp’s Simple Gantt Template puts your project timeline on easy mode with drag-and-drop fun, so you stay on track without the hassle.
Step 3: Choose a stacked bar chart

Now that you have the start date and duration information, it’s time to create a chart.
- Highlight the Task, Start Date, and Duration columns
- Click the Insert menu and select the Chart option. The Chart Editor pane will display
- Choose the Stacked Bar Chart option for the chart type. You can find this option in the Setup tab in the Chart Editor pane
- Select the Task option in the Y-axis field and add the End Date and Duration columns in the Series field

- Correct the date format for the data shown at the bottom of the chart
- Get the numeric format of the earliest date in the Start Date column and the latest date in the End Date column by clicking Format > Number > Number for those values.
💡Pro Tip: To avoid altering the values in the table, copy and paste the earliest start date and last end date into separate cells for the conversion. Doing this keeps the original values intact, and you can delete the temporary cells later

- Now, double-click on the chart to open the chart editor. Go to the Customize tab and expand the Horizontal Axis option. Paste the converted values here inside the Min. and Max. fields, respectively

- Next, scroll down to the Number Format dropdown and click the From Source Data option. This action will expand the dropdown. In the resulting menu, select the Date and Time option

- Choose your preferred date and time format for your chart in the pop-up that displays. Click the Apply button. Your stacked bar chart is now ready

Step 4: Insert and format the chart

Now, you’ll need to format the stacked bar chart to look like a Gantt chart.
- Expand the Series option in the Customize tab of the Chart Editor. Change Fill opacity for the Start Date series to 0%
- Set the Duration series to a solid, easily visible color. Voila! Your Gantt chart is ready!
💡 Pro Tip: Adjust the horizontal axis to ensure the timeline fits your project. To do this, you may want to set the minimum date to a few days before the first task begins.
Step 5: Refine and update your chart

You can now fine-tune the Gantt chart by:
- Removing gridlines, adding data labels, and formatting to improve readability
- Updating the chart whenever tasks, durations, or start dates change to keep your project schedule accurate
By following these steps, you’ll have a fully functional Gantt chart in Google Sheets, visually representing your project’s progress without needing specialized software.
With Google Sheets, you also have the flexibility to create a simple or dynamic Gantt chart, depending on the complexity of your project. Check out these Gantt chart examples to enhance your project planning.
Now that you know how to make a Gantt chart in Google Sheets, let’s look at some Gantt chart templates for Google Sheets.
If you prefer a quicker, more structured approach, Google Sheets also offers a built-in Timeline view that’s perfect for project planning—no chart formatting required. Here’s how to set it up:
Here’s how to use Timeline View:
- Format your data in columns:
- Start date
- End date
- Task name (or label)
- (Optional: Category or assignee)
- Highlight your dataset.
- Go to the menu: Insert → Timeline
- In the setup panel, select:
- The start date column
- The end date column
- The label column
- Customize your timeline using filters, colors, and grouping options.
It’s an easy, dynamic alternative to a stacked bar Gantt chart—perfect for project tracking.
Google Sheets Gantt Chart Templates: Key Benefits & Features
Google Sheets Gantt chart templates are handy tools that simplify the process of creating project timelines.
Using a pre-made Gantt chart template ensures you focus on your project details rather than the design and formatting of the chart.
Instead of starting from scratch, you can use these templates to save time and effort while ensuring your Gantt chart looks professional. Here’s a deeper look at how they can help:
⏰ They save you time
Templates come pre-formatted, meaning you don’t have to spend time setting up columns, formatting cells, or designing the chart from the ground up. Just plug in your project details.
🫶🏽 They’re user-friendly
Even if you’re not a spreadsheet whiz, these templates are designed for easy use. Most templates come with clear instructions, allowing you to focus on your project instead of the technical details.
🌈 You can customize them as you wish
Templates offer a reliable starting point while allowing for flexibility. You can adjust colors, add or remove tasks, and modify dates to fit your specific needs.
Finding a free Gantt chart template can provide a budget-friendly solution for those looking to manage projects without the cost of premium software. These Gantt chart templates help teams stay organized with clear visual representations of their project tasks.
➡️ Also Read: Top 10 Alternatives and Competitors to Google Sheets
Limitations of Creating a Gantt Chart in Google Sheets
Creating a Gantt chart in Google Sheets can be a practical and cost-effective way to manage simple projects, providing a visual timeline to keep tasks on track.
However, while it’s a versatile tool, it isn’t specifically designed for project management. As a result, there are some limitations to using Google Sheets for Gantt charts.
📎 Manual updates required
Google Sheets doesn’t automatically update tasks or timelines. As a result, any changes to dates, task durations, or dependencies need to be manually adjusted. This can be time-consuming and error-prone, especially when dealing with multiple tasks or frequent changes in project timelines.
🚦 Limited visual customization
While Google Sheets allows some basic formatting like cell colors and borders, it lacks the advanced visual customization options found in dedicated project management tools. Customizing elements such as milestone markers, task bars, or labels to represent different stages of a project can be cumbersome and may not yield a professional-looking result.
🚫 No built-in Gantt chart features
Google Sheets doesn’t offer built-in Gantt chart templates or dedicated features, meaning users have to create the chart from scratch using formulas, conditional formatting, and manual data entry. This adds complexity to the process, especially for those who are not familiar with setting up Gantt charts in spreadsheets.
📈 Scalability issues
As the project grows and more tasks are added, managing the Gantt chart in Google Sheets can become challenging. The spreadsheet may become cluttered, and performance may degrade. As a result, it becomes harder to navigate through tasks and view the overall project timeline clearly.
💼 Lack of advanced project management functions
Google Sheets can perform basic project management tasks. However, it lacks advanced capabilities like task dependencies, automatic rescheduling, and resource allocation.
Without these features, tracking progress, managing workloads, and adapting to project changes can be more difficult than using specialized project management software.
These limitations make Google Sheets Gantt charts more suitable for simple, smaller-scale projects rather than complex project management needs.
➡️ Also Read: 10 Best Free Gantt Chart Maker Software
Create Gantt Charts with ClickUp
The limitations of using Google Sheets for Gantt charts can leave you wanting more functionality.
ClickUp, a versatile project management tool, provides advanced features to address the challenges you might face with Google Sheets. Its flexible and intuitive interface makes managing even the most complex projects a breeze.
ClickUp’s Gantt Chart View: A comprehensive solution
ClickUp’s Gantt Chart View comes with built-in project management capabilities.

With this feature, all you need to do is plug in the project data. Use it to automatically adjust task timelines, set dependencies, and track project progress without updating everything manually.
This eliminates the tedious and error-prone processes associated with managing Gantt charts in Spreadsheets. You’ll be able to see how tasks connect and instantly spot which tasks are dependent on others. This makes it easy to adapt to changes and keep the project on track.
Overcome Google Sheets limitations with ClickUp
When using Google Sheets for Gantt charts, you might find the lack of task dependencies, automated scheduling, and limited customization frustrating. ClickUp’s Gantt charts tackle these issues by allowing you to:
- Automatically reschedule tasks: If one task’s timeline shifts, ClickUp will automatically adjust related tasks. This saves you time and ensures nothing is missed out
- Set task dependencies: Establish relationships between tasks, making it clear which tasks must be completed before others can start
- Track progress visually: The Gantt Chart View includes built-in progress tracking with color-coded bars to visually represent each task’s completion status, helping you stay on top of project updates effortlessly
💡Pro Tip: Try the Critical Path feature in ClickUp to set up the sequence of tasks that directly impact the project’s completion time. This helps project managers prioritize key tasks, allocate resources effectively, and monitor potential delays to ensure the project stays on track.
Try ready-to-use Gantt chart templates in ClickUp
ClickUp provides pre-designed templates that make creating Gantt charts easy. For instance, the ClickUp Simple Gantt Template is perfect for quickly setting up your project timeline without the hassle of building a Gantt chart manually from scratch.

The template includes customization options that allow you to tailor the chart to your project’s unique needs. Here is how this template can help you:
- Use the intuitive user interface with features like drag-and-drop functionality to rearrange tasks easily
- Add task priorities and adjust timelines dynamically
- Set and visualize dependencies, ensuring changes to one task automatically update related tasks
- Boost productivity with its automation capabilities to get a clear, organized view of your project
Additionally, the ClickUp Gantt Timeline Template offers a more detailed approach, ideal for projects that require intricate planning and task management. These templates come with all the necessary features for tracking tasks, setting dependencies, and monitoring progress—all in one place.
Justin Kosmides, CEO of Vela Bikes, shares his thoughts on using ClickUp’s Gantt charts. He highlights the organizational clarity they provide:
Collaborate in real time
ClickUp’s collaborative features allow multiple users to work on Gantt charts simultaneously, ensuring your entire team is up-to-date. This makes it easier to share progress, make updates in real time, and keep everyone aligned on project goals. Google Sheets can be challenging to use when managing larger projects. ClickUp scales effortlessly, making it suitable for teams of all sizes.
Experience all-in-one project management
With ClickUp, you don’t just get a Gantt chart—you get an entire project management platform. Beyond Gantt charts, ClickUp offers other powerful views such as Calendar, List, and Board.
This gives you the flexibility of switching between views depending on your project’s needs. You can also manage resources, track workloads, and set goals, all from a single platform.
Take the Gantt Leap: Simplify Your Project Planning
While Google Sheets is a great tool for creating Gantt charts, it may not always provide the flexibility and features you need for more complex projects.
If you’re looking for a more robust solution, ClickUp offers automated Gantt charts and comprehensive project management capabilities. By switching to ClickUp, you can enhance your workflow, improve collaboration, and focus on what truly matters: delivering successful projects.
Explore ClickUp today to elevate your project management experience.

Everything you need to stay organized and get work done.
