Sorry, there were no results found for “”
Sorry, there were no results found for “”
Sorry, there were no results found for “”
Your manufacturing floor buzzes with activity. Orders pile up, machines whir, and your team works hard. But something’s off—you’ve missed a few critical deadlines, the costs are rising, and you can’t pinpoint why.
You need razor-sharp inventory planning and workback schedule systems to run complex production operations.
That’s where the right KPIs come in—they act as a health check for your production line. They show you exactly where bottlenecks form, which processes waste resources, and how to fix issues before they blow up.
Let’s walk you through the most critical production planning KPIs to track. We’ll look at actual examples, dig into the data, and show you how to measure what matters.
A Key Performance Indicator (KPI) in production planning is a measurable value showing how well your manufacturing processes hit their targets.
Production planning KPIs fall into four main buckets that help track different aspects of your manufacturing process:
🧠 Fun Fact: Henry Ford introduced the first moving assembly line in manufacturing in 1913. It revolutionized production by reducing car assembly time from over 12 hours to just 2.5!
Production KPIs do more than just measure success or failure—they guide decisions and improvements in several key ways:
Numbers tell the story in production; the right KPIs help you read it. In the manufacturing industry, tracking the right metrics distinguishes smooth operations from costly bottlenecks.
Production planning KPIs give you concrete data to back up gut feelings. For instance, manufacturing scheduling software can help you monitor cycle times and throughput to identify workflow bottlenecks. Once you know where things slow down, you can take targeted action to speed them up.
Quality metrics like defect rate and rework rate act as early warning systems. They help catch issues before they become major problems that hurt customer satisfaction.
Due to these reasons, companies that closely track production KPIs may see waste drop and profits climb.
A solid manufacturing process relies on strong metrics to stay efficient and competitive. KPIs help track on-time delivery to meet both customer expectations and commitments, monitor production costs to protect profit margins, measure equipment performance to prevent unexpected breakdowns, and check quality to minimize waste and rework.
🧠 Fun Fact: Tracking production KPIs has been shown to reduce material overconsumption significantly. In a study focusing on the pen manufacturing industry, the introduction of a Production Monitoring System (PMS) led to a 58% decrease in raw material usage, directly lowering production costs.
💡 Pro Tip: Want to drive efficiency in every process on your shop floor? Process mapping can help. Watch this video for our best tips on creating a process map that optimizes your operations.
Ready to make smarter decisions about your manufacturing operations? These 15 essential production planning metrics will help you spot bottlenecks, improve operational efficiency, and boost your bottom line.
Throughput shows how many units your production line can complete in a set time. Think of it as your manufacturing speed limit.
👉🏼 For example, if your factory aims to make 500 smartphones daily but only produces 450, you know there’s room for improvement.
💡 Pro Tip: Track throughput by individual production lines to identify hidden inefficiencies! Break down data for each line so you can pinpoint precisely where delays happen—whether it’s a specific machine, shift, or process.
This KPI tracks the time it takes to complete one product from start to finish.
👉🏼 For example, operators of a phone assembly plant with a 45-minute cycle time clearly understand how many units they can produce within a shift.
This helps optimize productivity and set realistic production goals.
This metric measures how efficiently you’re using your available resources. It compares your plant’s actual output to its maximum potential.
👉🏼 For instance, if your plant can produce 1,000 units per day but only manufactures 700, your capacity utilization is 70%.
This metric helps identify underused resources, highlight areas for improvement, and optimize production to get closer to full capacity.
Think of this as the speedometer for your stock—it shows how quickly your inventory is moving. The higher the number, the faster you’re selling and restocking.
👉🏼 For example, if a company sells and replaces its entire inventory five times a year, its inventory turn rate is five.
This KPI helps you understand how efficiently you’re managing stock—keeping things fresh without overstocking or running low!
This KPI is crucial because it directly impacts customer satisfaction.
👉🏼 For example, an auto parts manufacturer with a 98% on-time delivery rate ensures assembly lines at car factories run smoothly without delays.
👀 Did You Know? Companies with high on-time delivery rates are seen as more reliable and trustworthy by their customers. Keeping track of your on-time delivery rate ensures meeting deadlines and maintaining strong client relationships.
OEE combines three key factors: equipment availability, performance, and quality.
👉🏼 A packaging line running at 85% OEE shows strong performance but also has room for improvement.
Even a 5% increase in OEE can lead to considerable cost savings and improve overall production efficiency. Monitoring OEE helps you keep your production line running at its best, identify areas for optimizing performance, and reduce downtime.
This metric tracks the amount of material wasted during production.
👉🏼 For instance, a scrap rate of 3% means that 3 out of every 100 units produced are wasted.
Effective preventative maintenance can help reduce scrap rates and prevent costly mistakes on the production floor. Tracking your scrap rate can identify inefficiencies, reduce waste, and improve resource utilization.
Efficient stock management processes ensure you always have the right materials available at the right time.
👉🏼 For example, a furniture maker who tracks their wood supplies closely can avoid production delays. Proper stock management can significantly reduce storage costs and improve cash flow.
Keeping tabs on your inventory ensures that materials are never overstocked or understocked, optimizing your production planning metrics.
Lead time measures the time between ordering materials and completing the finished product.
👉🏼 A food processor vendor who cuts lead time from seven to four days can respond to market demands much quicker.
Reducing lead time speeds up your ability to deliver, helps improve production schedule attainment, and keeps your customers happy. It enables you to stay competitive in the market and meet consumer needs faster.
This KPI measures how often you can fulfill orders directly from existing stock.
👉🏼 A 95% fill rate means you’re meeting customer needs most of the time.
A higher fill rate boosts customer satisfaction, streamlines inventory management, and reduces the need for emergency restocking—ensuring products are readily available when needed.
This KPI measures inventory shortages and highlights how often orders cannot be fulfilled due to missing materials.
👉🏼 A 2% stockout rate means you cannot meet 2% of customer demands.
A low stockout rate indicates a well-managed inventory and fewer missed opportunities. Managing stockouts ensures you’re always prepared to meet demand and avoid production bottlenecks.
Order fulfillment time tracks how quickly you can process and deliver orders. Meeting a 48-hour fulfillment target can greatly improve your production schedule attainment.
Shortening your order fulfillment time boosts customer satisfaction and improves cash flow by speeding up the sales cycle.
WIP tracks items that are currently being manufactured but not yet finished. High WIP levels often signal bottlenecks in the production process.
Tracking WIP helps identify inefficiencies early and ensures smoother production flow. By keeping WIP in check, you can reduce production delays and improve actual production time.
This KPI shows l manufacturing costs for every unit produced.
👉🏼 If it costs $50 to make one widget, finding ways to reduce that cost to $45 can significantly impact your bottom line.
Even small reductions in production cost per unit can lead to significant profit increases over time. Tracking production costs per unit helps you find ways to improve resource utilization and cut unnecessary expenses.
The yield rate measures the percentage of products that meet quality standards from total production.
👉🏼 A 97% yield rate means that 97 of every 100 units produced meet the required standards. Improving your yield rate can drastically reduce waste and increase efficiency.
A high yield rate ensures consistent quality and helps lower scrap rates and production costs, leading to better overall performance.
Here’s how to boost your KPI performance and get actual results:
Pick software that brings all your production process data into one place. That way, you make quick, informed decisions based on real numbers, not guesswork. For instance, when a manufacturer sees machine downtime rising, they can immediately check maintenance schedules and adjust them to prevent future slowdowns.
📮ClickUp Insight: Low-performing teams are 4 times more likely to juggle 15+ tools, while high-performing teams maintain efficiency by limiting their toolkit to 9 or fewer platforms. But how about using one platform?
As the everything app for work, ClickUp brings your tasks, projects, docs, goals, KPIs, and chat under a single platform, complete with AI-powered workflows. Ready to work smarter? ClickUp works for every team, makes work visible, and allows you to focus on what matters while AI handles the rest.
Not all KPI examples carry equal weight. Zero in on metrics directly impacting your goals, like quality control and delivery times. Say you’re running a food processing plant—tracking order fulfillment rate might matter more than general or individual productivity stats.
Start with your current performance as a baseline. Then, set specific, achievable goals with deadlines. If your production capacity is 75%, you might aim for 85% within three months through better scheduling and reduced changeover times.
Use real-time monitoring to catch issues early. A car parts manufacturer might notice quality scores dropping and quickly trace it to a specific production line, fixing the problem before it affects more products.
Give your staff the skills they need to hit KPI targets. These could include cross-training operators on different machines or teaching supervisors advanced data analysis techniques.
Remember how we advised you to track your most critical production planning KPIs in one tool? Which tool is that?
It’s ClickUp.
Work today is broken. Our projects, knowledge, and communication are scattered across disconnected tools that slow us down.
ClickUp fixes this with the everything app for work that combines project, knowledge, and chat in one place—all powered by AI that helps you work faster and smarter.
As a comprehensive work management tool, it gives teams full visibility into production planning KPIs—from cycle time and throughput to inventory turnover and OEE. With real-time dashboards, workflow automation, and deep integrations, ClickUp centralizes task tracking, performance monitoring, and resource planning in one place.
Whether you’re streamlining manufacturing schedules, optimizing supply chain processes, or reducing production waste, ClickUp ensures your team stays on track and continuously improves.
Here’s how you can make tracking and implementing KPIs easier with ClickUp :
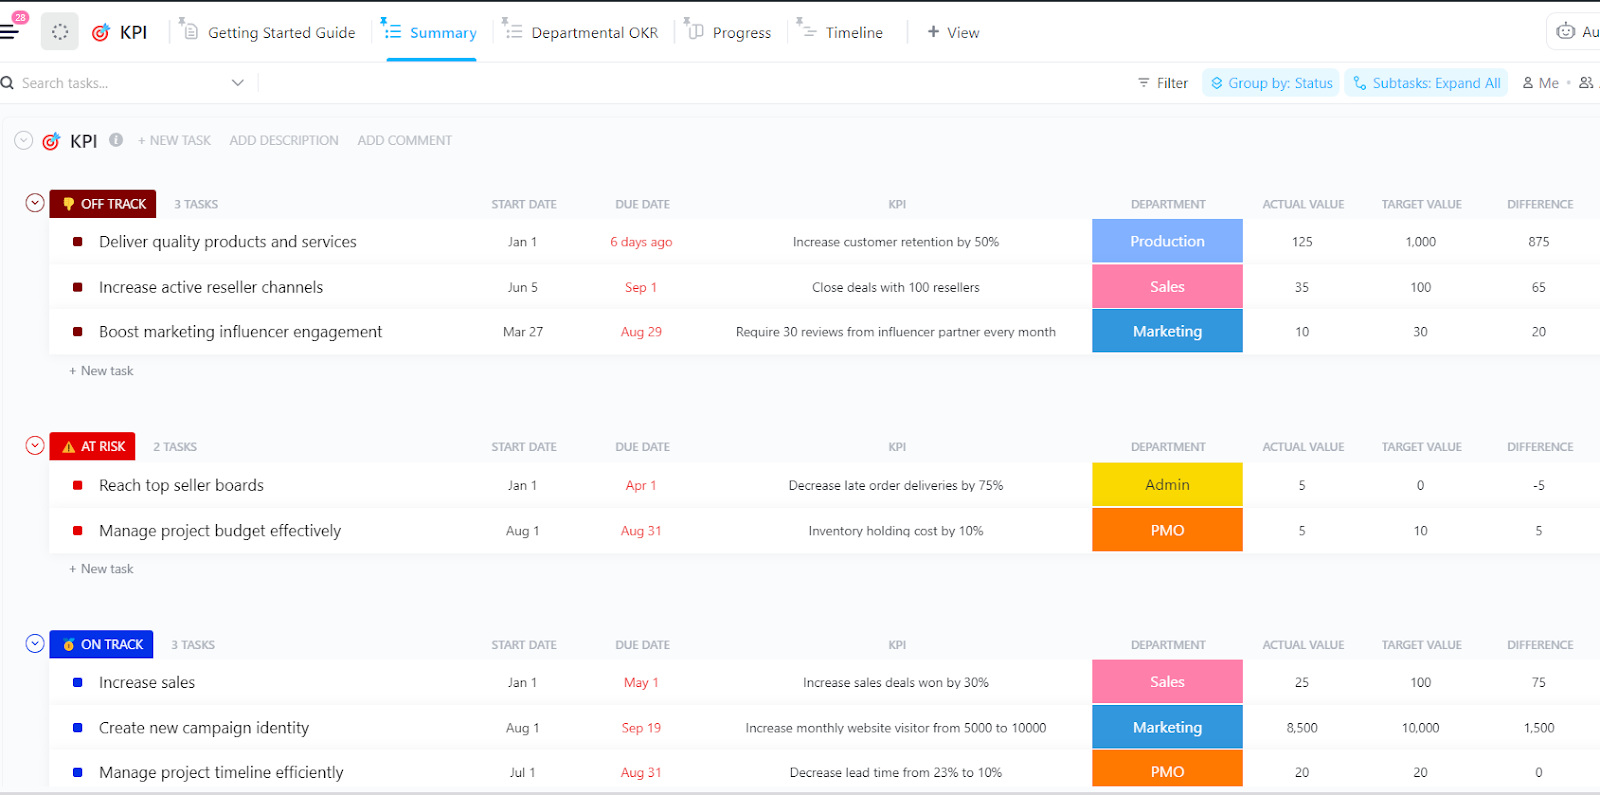
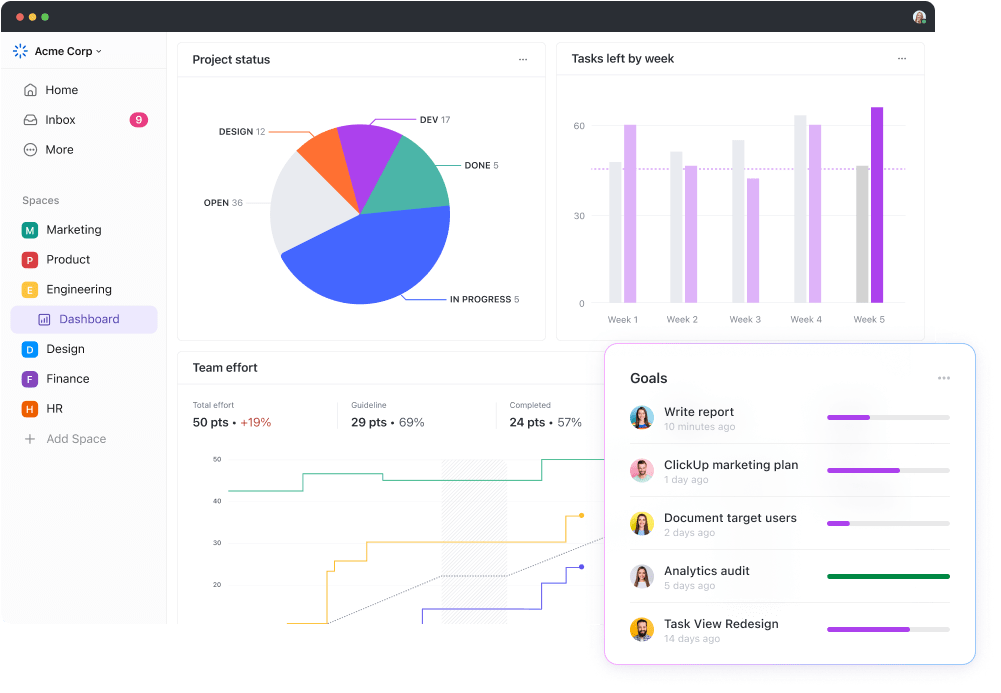
Want to keep your production planning KPIs organized and visible? ClickUp Dashboards make tracking and analyzing metrics quick and straightforward.
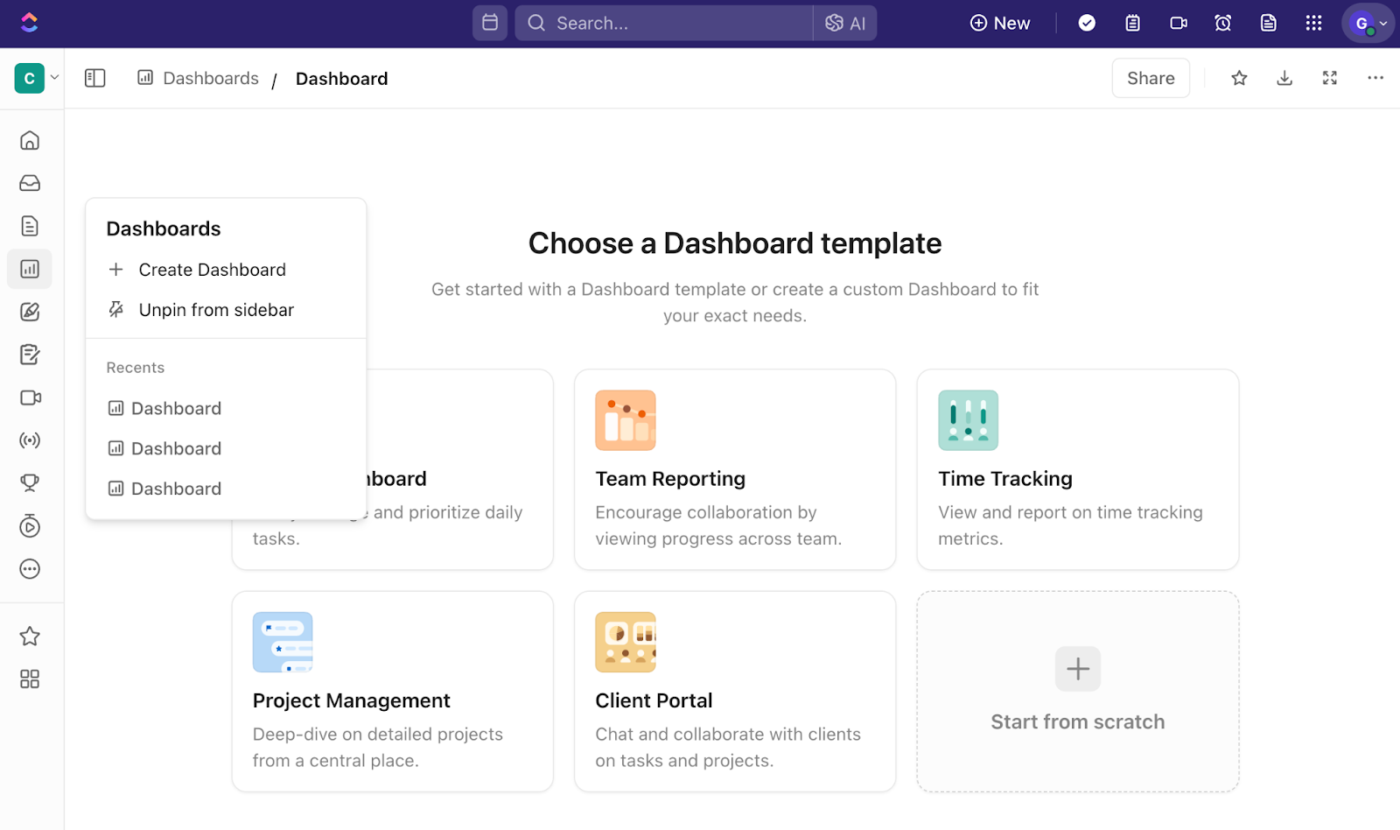
Getting started with ClickUp Dashboards takes just a few clicks. Once you’ve set up your ClickUp account and created a Space for your project, head to the Dashboard section in your left sidebar. Hit ‘+ Create Dashboard,’ and you’re ready to build a custom layout.
You’ll see the option to add cards showing the exact metrics you need. For production planning, you might track some of these KPI examples:
Each metric gets its own card with real-time data visualization. Bar charts work great when comparing actual vs. planned production, and line graphs help spot trends in cycle times.
💡 Pro Tip: Don’t want to spend too much time building a dashboard from scratch? Try using pre-built dashboard templates in ClickUp to set it up faster. And don’t worry—even templates are completely customizable, so you can keep or add the cards and metrics that matter and delete what’s not useful.
ClickUp Dashboards are a real game changer for us because we now have a true real-time view into what’s happening. We can easily see what work we’ve completed and we can easily see what work is in progress.
Where does the data for your dashboards come from?
From your ClickUp Custom Fields. They let you capture the specific data points for your production process in multiple formats, such as progress bars, check boxes, numbers, money metrics, ratings, labels, and more.
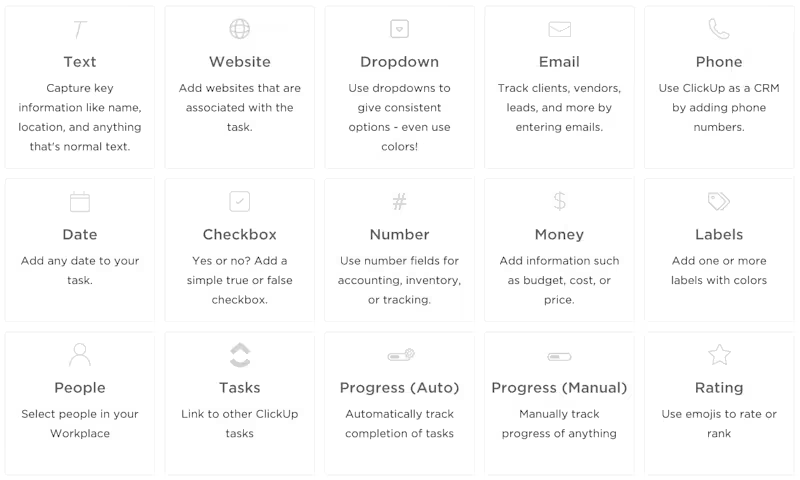
Set up fields to track:
This structured approach helps you spot issues quickly. Red flags pop up when actuals drift significantly from targets and when there are repetitive patterns in a below-par performance.
How do you fix them?
Create specific ClickUp Tasks to control, modify, and improve complex production workflows. Assign these tasks to the team members responsible, and set due dates to get your actual performance back on track in time.
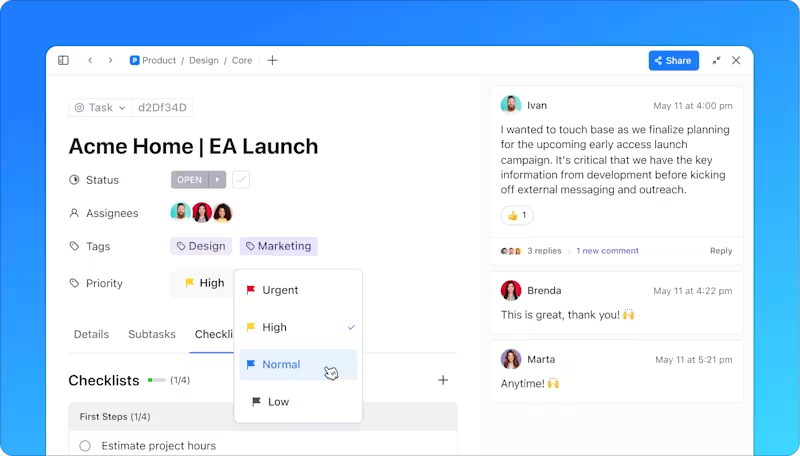
ClickUp Goals help manufacturing teams define clear targets and measure real-time progress.
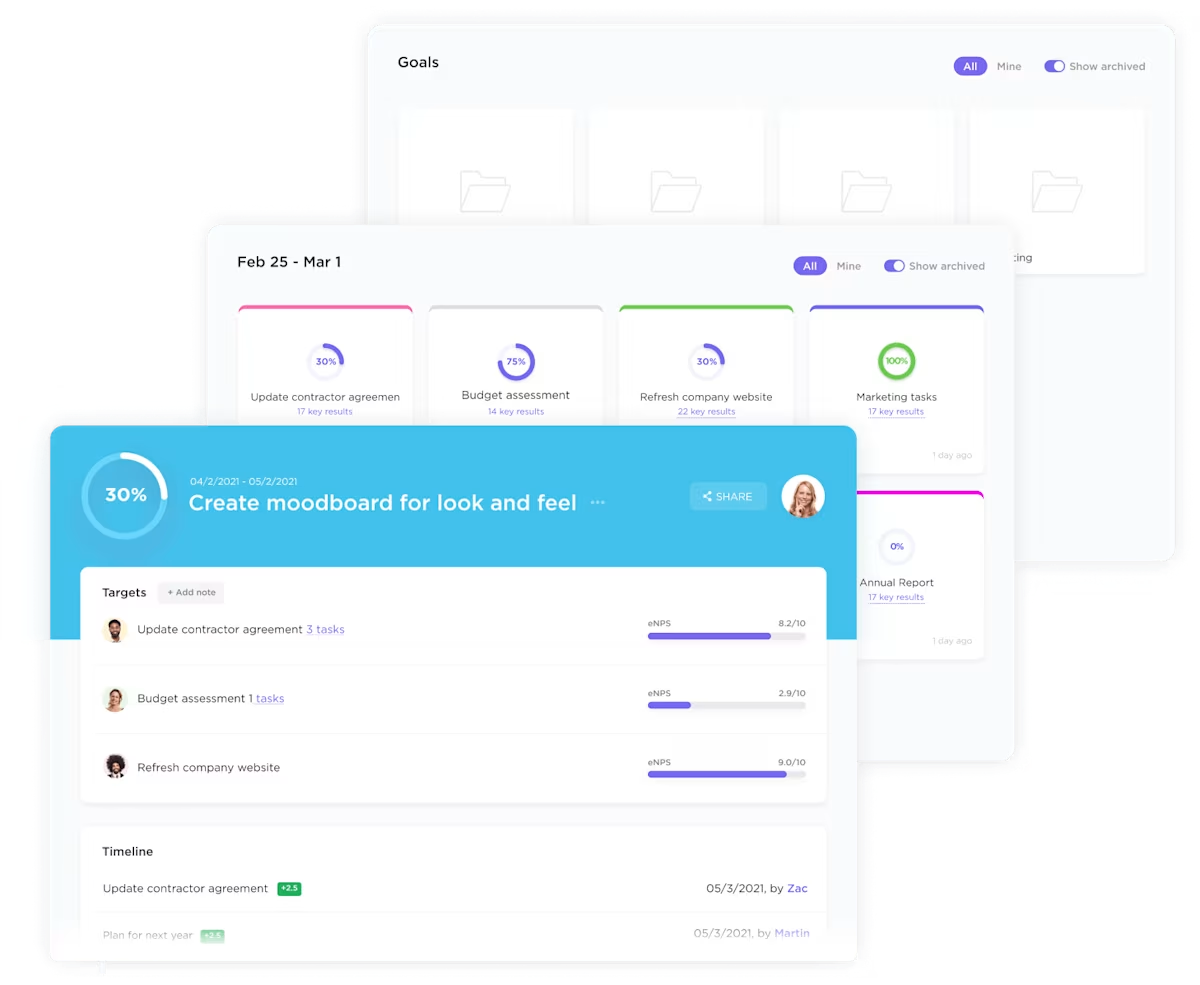
You can set up overarching goals like boosting production output by 20%. And then, break this down into smaller, trackable tasks:
This hierarchical structure helps everyone see how their daily work contributes to more significant, company-wide objectives. When a team member completes a task, the progress updates automatically, giving managers instant visibility into goal achievement.
ClickUp Automations take repetitive tasks off your plate. Say goodbye to manually updating spreadsheets or sending status reports to monitor your KPIs.
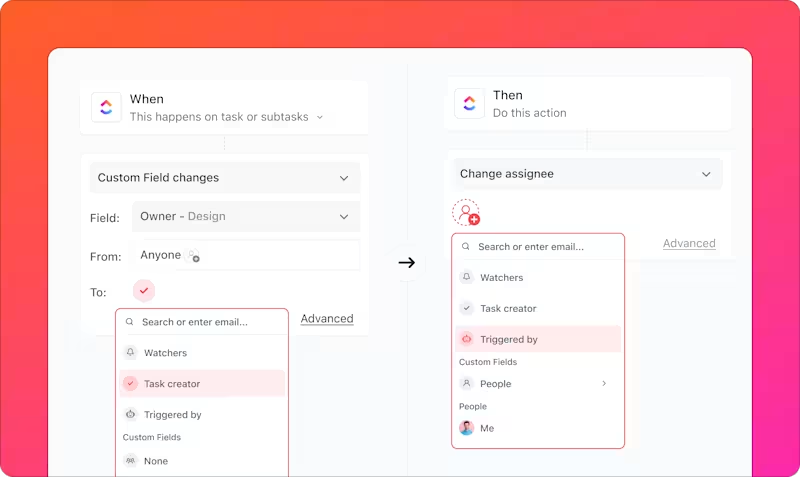
You can set up triggers to:
These will save hours of manual data entry and prevent costly oversights.
Ever wished you had a clearer picture of your production timeline? The Gantt Chart View in ClickUp can help.
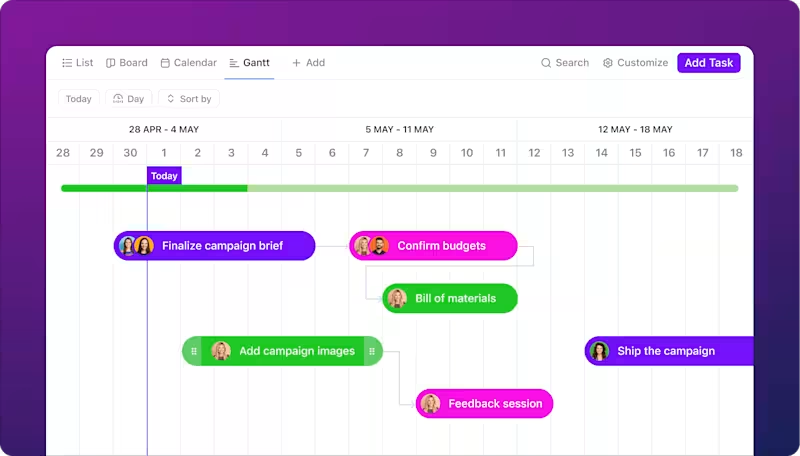
Manufacturing engineers use it to:
The visual format makes it easy to see how delays in one area might affect the whole schedule. You can even drag and drop tasks to quickly adjust timelines when needed.
📖 Also Read: Best Production Scheduling Software (Free & Paid)
Time data drives smart production decisions.
ClickUp Project Time Tracking works on any device, so your team can log hours directly on tasks.
Want to know how long each production stage takes?
ClickUp Time Estimates help you plan resource needs, while detailed time reports show where hours are going.
💡Pro Tip: External apps like Toggl, Harvest, Everhour, and more integrate with ClickUp to bring your time data directly where your production data is already being tracked—in ClickUp.
The ClickUp Manufacturing KPI Template helps production teams monitor and improve performance metrics in one central place. It allows you to track everything from production output and cycle time to quality metrics and on-time delivery rates.
This template comes with built-in features to make KPI tracking simple:
Custom Fields for data collection
Multiple Views
The template offers different ways to analyze your manufacturing data:
The template helps spot issues fast. If production numbers start dropping or quality rates slip, you’ll catch it immediately and can take action.
By combining planning, execution, and analysis in one place, ClickUp empowers teams to improve efficiency, reduce waste, and enhance production planning for smoother operations and higher profitability.
Production planning hits some tough spots that can really slow down your manufacturing process. Here’s how smart teams tackle five common roadblocks using targeted KPIs.
Your machines keep breaking down, workers stand idle, and deadlines slip away. Sound familiar? Track your Overall Equipment Effectiveness (OEE) to spot and fix these issues quickly.
For example, if your OEE shows that Machine A stops every two hours, you can schedule preventive maintenance during off-peak times. This simple fix could boost your production output by 15-20%.
Key KPIs to track:
When defects slip through the cracks, you face returns, rework costs, and unhappy customers. Focus on these quality control KPIs to catch problems early:
Late materials mean missed deadlines and frustrated customers. Keep tabs on:
Track these cost-related KPIs to spot money leaks:
Poor forecasting leads to either too much inventory (tying up cash) or too little (missing sales). Keep an eye on product management KPIs and metrics such as:
The world of manufacturing KPIs might seem complex, but it doesn’t have to be. With the right tools and approach, you can turn those numbers into tangible insights that boost your bottom line. From monitoring machine downtime to ensuring quality standards, the right tracking system puts you in control.
But here’s where it gets interesting—bringing all this together in one place. ClickUp’s task management for industrial manufacturers excels at this. You can use it to automate those repetitive tracking processes, allowing your team to focus on what matters.
Think about it: Your team spends less time chasing data and more time using it. You spot bottlenecks before they slow you down. What about quality issues? They’re caught and fixed faster than ever.
Ready to turn those KPIs into actual results? Try ClickUp for free today and see how much clearer manufacturing metrics can be.

Praburam Srinivasan
Max 22min read
Praburam Srinivasan
Max 24min read

Manasi Nair
Max 18min read

© 2026 ClickUp