

Have you ever been asked to predict outcomes? Perhaps something like sales figures, risk factors, reliability and failure rates, or project completion dates?
Chances are you were clueless. You’re not alone. Anyone can and will struggle—predicting the uncertainty is no joke. But, you see, there’s a way to model uncertainty with certainty.
It’s called the Monte Carlo simulation in Excel—a powerful method used for predicting the probability of different outcomes in uncertain situations.
Originally named after the Monte Carlo Casino in Monaco, this method is invaluable for understanding the range and likelihood of different outcomes, allowing for better risk identification and decision-making.
The powerful ability of Monte Carlo simulation to make sense of the unknown is used in finance, engineering, data analysis, and project management to model the impact of risk and uncertainty.
Using Microsoft Excel, you can easily simulate scenarios to make informed decisions. It’s based on statistical data using random variables to calculate possible outcomes’ mean and standard deviation.
You’ve come to the right place if you’re looking for a step-by-step guide on:
- How to run Monte Carlo simulation models
- How to analyze the results
- Ways to apply it in business and project management
In this article, we’ll take you through some of the best practices, tooltips, and tricks. Let’s jump right in.
How to Run Monte Carlo Simulation in Excel?
- How Monte Carlo Simulation in Excel Works
- Step-by-Step Monte Carlo Simulation Process in Excel with an Example
- Applications of Monte Carlo Simulation in Excel
- Advantages and Limitations of Monte Carlo Simulation in Excel
- Other Data Visualization Tools
- Monte Carlo Simulation and Future Predictions
- Run Perfect Monte Carlo Simulations with ClickUp
How Monte Carlo Simulation in Excel Works
But why Excel for Monte Carlo simulation?
Well, unlike others, Excel is a versatile tool that allows you to easily perform complex calculations.
Widely accessible, user-friendly, and built with many statistical functions, Excel is the ideal choice for Monte Carlo simulations. Its robust data visualization tools not only help you to present your findings clearly, but also instill confidence in your ability to communicate effectively.
The Monte Carlo simulation is based on statistics and statistical principles. These are the foundations of data analysis, results interpretation, and decision-making for this method.
To truly understand and use Monte Carlo simulation, you have to be aware of key statistical measures used to describe data, such as:
- Mean: The average value
- Median: The middle value in a sorted (ascending or descending) data set
- Standard Deviation: A measure of how spread out the data is from the mean (average) value
- Variance: The square of the standard deviation that measures the spread of data points
- Normal Distribution: A bell-shaped curve representing the probability of different probabilities occurring within a certain range
- Skewness: The measure of asymmetry in a statistical distribution
Core statistical concepts (principles) are also important to know. For instance, a higher standard deviation or variation value means a wider range of data. Conversely, lower values indicate that the data points are closely clustered around the mean.
Here’s another core statistical concept used in the Monte Carlo simulation.
In normal distribution or the bell curve, the highest point—on the symmetrical bell-shaped curve—represents the mean or the most likely outcome.
Similarly, measures like skewness and median accurately model and interpret simulated data, accounting for potential biases and uncertainties.
As you know by now, statistics is at the heart of the Monte Carlo simulation, providing insight into potential outcomes and associated probabilities. Such information is invaluable for decision-making as it deeply assesses risks, uncertainties, and potential scenarios.
Step-by-Step Monte Carlo Simulation Process in Excel with an Example
The Monte Carlo simulation method is an essential, tried-and-tested risk assessment framework.
Here’s a detailed guide to performing the simulation in Excel, using a dice-rolling example to illustrate the process.
Dice rolling event
Step 1: Define the problem: Let’s use an example of rolling two dice to understand the Monte Carlo simulation process. You want to determine the probability of getting different scores when two dice are rolled simultaneously. Each die has numbers from 1 to 6, so the sum of numbers (total score) on the faces can range from 2 (1+1) to 12 (6+6).
Range of outcomes
Step 2: Determine the range of possible outcomes: The possible sums (total scores) when rolling two dice are integers between 2 and 12. Each sum has a different likelihood because different combinations can produce it. For instance, there’s only one way to get a sum of 2 (1+1), but multiple ways to get a sum of 7 (e.g., 1+6, 2+5, 3+4, etc.).
Number of dice rolls
Step 3: Decide the number of simulations: You should perform many simulations to get a reliable result. Let’s decide to simulate 10,000 rolls of the two dice. The more simulations you do, the more accurate your estimated probabilities will be.
Simulation
Step 4: Set up the spreadsheet for simulation: You can use random number generation functions on an Excel sheet to simulate dice rolls. To generate random numbers or random values, follow these steps:
Generate random numbers
- In cell A2, enter =RANDBETWEEN(1, 6) to simulate the first die roll

- In cell B2, enter =RANDBETWEEN(1, 6) to simulate the second die roll

Calculate the sum
- In cell C2, enter =A2 + B2 to calculate the sum (total score) of the two dice

Extend the simulation
- Copy the formulas in A2, B2, and C2 down to row 10001 to simulate 10,000 dice rolls

Probability
Step 5: Analyze the simulation results to calculate the probability of each outcome (total score). You can do this by using the COUNTIF function.
- Create a frequency distribution list
- In column E, starting from cell E2, list all possible sums of the outcome of two die rolls from 2 to 12

- In column F, starting from cell F2, use the COUNTIF function to count how many times each sum occurs. For example, in cell F2, enter =COUNTIF(C$2:C$10001, E2) and copy this formula down to F13
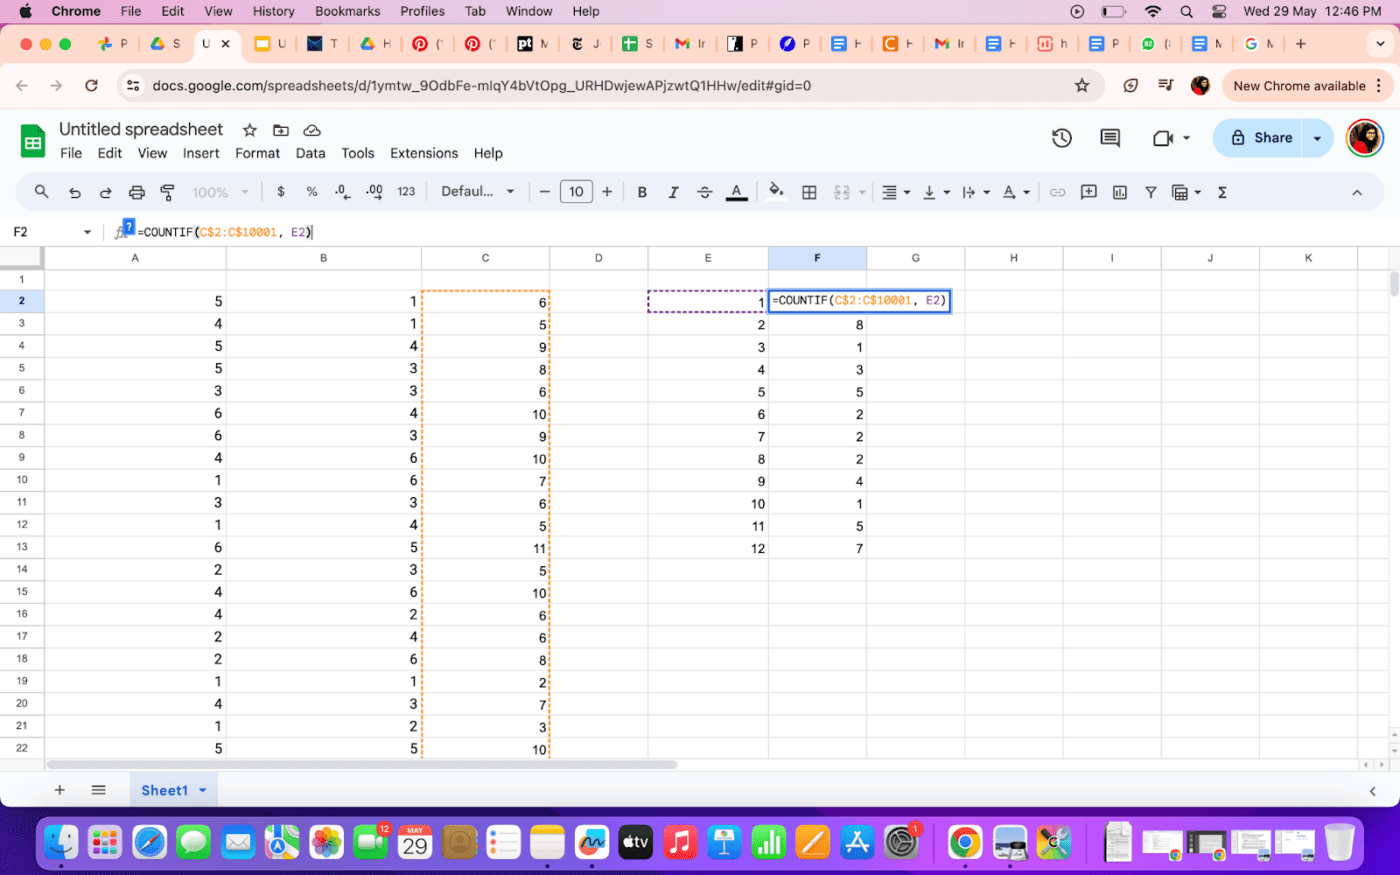
- Calculate probabilities
- In column G, convert the counts to probabilities by dividing each count by the total number of simulations (10,000). For example, in cell G2, enter =F2 / 10000 and copy this formula down to G12
- You can now name the column heads if you want to
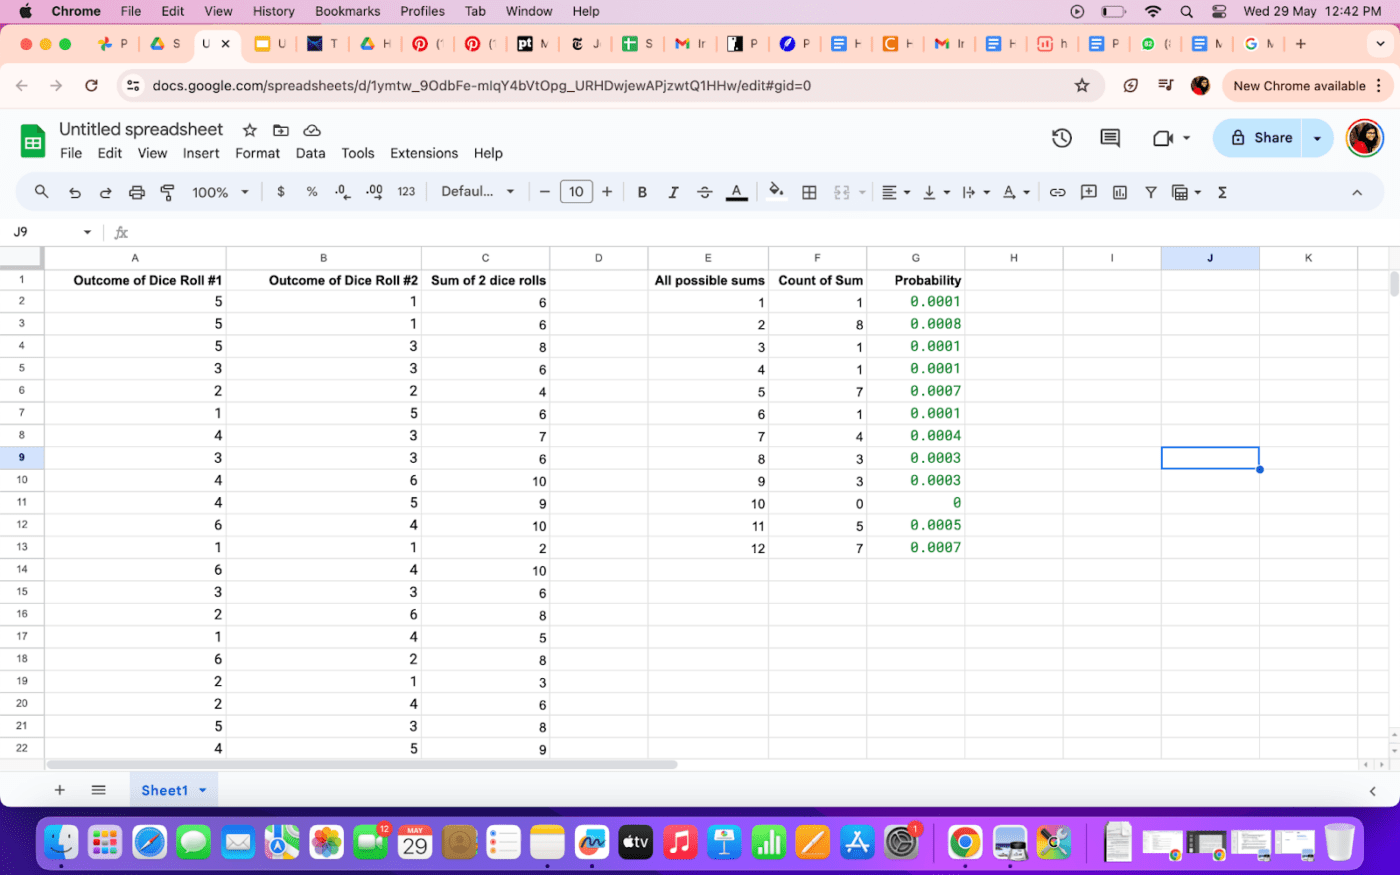
Conclusions
Step 6: Draw conclusions from the results: Analyze the results to understand the likelihood of different outcomes. The values in column G will give you the empirical probabilities of each possible sum based on your simulation.
By comparing these probabilities with the theoretical probabilities, you can validate the accuracy of your simulation. This helps you understand the distribution of outcomes and make informed predictions.
Applications of Monte Carlo Simulation in Excel
Monte Carlo simulation is a powerful tool for data analysis in various fields and industries.
Monte Carlo simulations can be applied in supply chain management to streamline inventory levels, plan capacity, analyze demand forecasting, and assess supply chain risks.
The popular Six Sigma DMAIC (Define, Measure, Analyze, Improve, Control) approach to security software testing also leverages the Monte Carlo simulation.
In a simple Excel workbook, you can leverage it for diverse applications like reliability engineering, data modeling, statistical dispersion, and more.
Let’s see how this versatile method is making waves in different areas.
First up is data analysis. The simulations help you understand the likelihood of different outcomes involving random variables. Whether you’re dealing with financial forecasting or quality control, this method provides insights far more reliable than mere guesswork.
Then, there’s reliability engineering. Companies use the Monte Carlo methodology to predict product lifespans and failure likelihoods. It’s all about understanding risks and ensuring products meet high-reliability standards before hitting the market.
Take, for example, a greeting card company trying to figure out how many cards to produce for the holiday season.
Using Monte Carlo simulations in Excel, they can simulate various demand scenarios, considering factors such as past sales data and market trends. This approach helps them optimize production quantity, minimizing waste and depleted stocks.
On the software front, giants like SAS and SPSS use Monte Carlo methods for advanced analytics. These tools integrate simulations to handle complex statistical analyses, from hypothesis testing to predictive analytics.
These platforms offer robust solutions for data scientists tackling intricate problems by incorporating Monte Carlo simulations.
Advantages and Limitations of Monte Carlo Simulation in Excel
Monte Carlo simulations in MS Excel offer a simple way to model complex statistical distributions, making it a go-to tool for many analysts.
One of the biggest advantages is accessibility. MS Excel is readily available. Also, it’s surprisingly beginner and user-friendly, so you don’t need to be a hardcore data scientist to run simulations.
And if that’s not enough, Excel’s built-in functions and formulas allow you to create sophisticated models that can handle a wide range of scenarios, providing valuable insights into probability distributions and outcomes.
Another significant benefit is scalability. Excel can manage large datasets and numerous simulations with relative ease. For most business applications, Excel’s data-handling capacity is more than enough. You can run countless simulations and still get relevant insights for meaningful decision-making.
Despite excellent advantages, Excel isn’t bulletproof.
One major drawback is the lack of parallel processing capabilities.
Excel can slow down when running extensive simulations because it processes tasks sequentially rather than simultaneously—a bottleneck for time-sensitive analyses.
Also, Excel’s flexibility diminishes as models become more complex. Excel might not offer the required support or efficiency for advanced techniques and highly intricate models.
Other software solutions such as synthetic data generation tools and cloud computing models often surpass Excel in these areas. They provide features like parallel processing and better support for complex models.
Cloud-based tools, in particular, offer scalability far exceeding what Excel can handle, allowing for faster and more efficient simulations.
These Excel alternatives also include advanced statistical techniques and machine learning algorithms, offering a broader range of analytical capabilities.
Other Data Visualization Tools
Leverage ClickUp to run advanced Monte Carlo simulations
ClickUp is a versatile project management tool for next-level Monte Carlo simulations. But its capabilities go beyond just basic project management.
Its ready-to-use, fully customizable templates for data analysis, project management, and risk analysis, coupled with AI-backed features, streamline your simulation processes and enhance collaboration.
Here’s a quick under-the-hood look at ClickUp for Monte Carlo simulations, whether for supply chain planning or bug fixing.
ClickUp provides pre-built templates specifically designed for project growth planning, project management, and risk analysis.

For instance, ClickUp’s Project Management Risk Analysis Template organizes potential risks and their impact, making it easier to incorporate Monte Carlo simulations into your workflow.
Here’s how you can leverage this free template to run an advanced Monte Carlo simulation:
- Simulate the impact of various risks on your project using the Monte Carlo simulation techniques
- Integrate data from ClickUp into your Monte Carlo simulation models to ensure comprehensive risk assessment
- Automate the calculation of risk probabilities and impacts using ClickUp’s automation features, making your Monte Carlo simulations more efficient
- Run different scenarios by adjusting risk probabilities and impacts in ClickUp to see how changes affect your project outcomes
- Generate visual reports and dashboards within ClickUp to present the results of your Monte Carlo simulations to stakeholders

The ClickUp Data Analysis Report Template can also be customized to fit Monte Carlo simulation needs, allowing you to systematically document and analyze data.
Here are the benefits of leveraging this template for running a Monte Carlo simulation
- Gather and organize all necessary data inputs for your Monte Carlo simulation in one place
- Clean and preprocess your data directly within the template
- Apply necessary transformations and prepare datasets for simulation
- Define and manage customizable variables needed for your simulation
- Collaborate with team members in real-time to refine data inputs and simulation parameters
- Conduct iterative simulations by updating data and variables as new information becomes available
- Quantify risk probabilities and impacts through simulation for better risk management strategies
And then there’s ClickUp advanced data analytics, visualization, and reporting. Want to fine-tune forecasting to accurately predict future outcomes? Combine Monte Carlo simulations with ClickUp predictive models in just a few steps—it’s that easy and seamless.
On that note, with ClickUp Automations solutions, you can easily automate troublesome and repetitive tasks associated with Monte Carlo simulations like:
- Setting up automated notifications for team members when a simulation reaches a certain stage
- Automating data entry tasks to improve speed, minimize data duplicates and errors

Click Up Views is another pro-simulation feature where you can create custom dashboards to visualize the results of your Monte Carlo simulations.
Integrated within ClickUp reporting, ClickUp lets you generate comprehensive reports according to your data interpretation taste; view your data as charts, graphs, or pie charts—the sky’s the limit.
The icing on the cake? The ClickUp Dashboard, which closely monitors key performance indicators (KPIs) and tracks simulation progress in real time.

Of course, since simulation and predictions are tasks at the end of the day, it would be remiss not to mention ClickUp Task Management, a nifty tool for assigning tasks, setting deadlines, and tracking progress.
It’s particularly useful when running complex models requiring input and collaboration from multiple team members.
Carefully designed for project management and team collaboration, it features space to add comments, do real-time editing, and integrate with other software so that your entire team is always on the same page.
Benefits of using ClickUp for Monte Carlo simulations
With ClickUp covering running Monte Carlo simulations, let’s jump straight into the benefits.
- Enhanced collaboration: ClickUp’s collaborative features ensure all team members can equally and effectively contribute to the project’s success
- Streamlined workflow: With ClickUp templates and automation, you’re essentially streamlining the workflow, saving precious time and eliminating errors
- Comprehensive reporting: Custom dashboards and detailed reporting capabilities enable focused data visualization, detailed analysis, and insightful interpretation of results
- Scalability: ClickUp can handle projects of any size and complexity, making it suitable for small teams as well as large organizations
Monte Carlo Simulation and Future Predictions
Monte Carlo simulations are invaluable for predicting and determining future outcomes, providing a robust framework for uncertainty analysis.
By running numerous scenarios, these simulations allow businesses and researchers to anticipate various potential outcomes and assess their likelihood.
The foundation of Monte Carlo simulations lies in the interplay of expected value, cumulative distribution function, and likelihood function. These elements work together to quantify the likelihood and impact of various events, providing a solid basis for predictive analysis.
The expected value gives a long-term average of outcomes, guiding decision-makers on what to expect over time.
Monte Carlo simulations have evolved significantly with the advent of pseudorandom number generators. These generators, by producing sequences of numbers that mimic the properties of random numbers, have revolutionized the accuracy and efficiency of simulations, making them a more powerful tool for risk assessment and decision-making.
These generators produce sequences of numbers that approximate the properties of random numbers, ensuring that simulations are both repeatable and sufficiently random for robust analysis.
Recent advancements have enhanced the versatility of Monte Carlo simulations, making them more reliable and accessible. This has sparked interest in their broad application across various fields.
Run Perfect Monte Carlo Simulations with ClickUp
Monte Carlo simulations in Excel empower you to confidently make data-driven decisions, whether in manufacturing, software, or any other industry that thrives on precision analytics.
When used in Excel, the methodology helps to accurately predict outcomes and manage risks. However, the limitations of Excel might present some challenges, especially when running extensive simulations on vast datasets.
Holdbacks in Excel are non-existent on advanced tools like ClickUp, making it an ideal, smart, scalable, and intelligent fit for Monte Carlo simulations.
Try it for yourself. Sign up for your free ClickUp account today.


Everything you need to stay organized and get work done.


