


Still downloading templates?
There’s an easier way. Try a free AI Agent in ClickUp that actually does the work for you—set up in minutes, save hours every week.
Sorry, there were no results found for “”
Sorry, there were no results found for “”
Sorry, there were no results found for “”
Picture this: you need to present a comprehensive geographical overview of your sales and marketing data to the board.
But representing this data via static spreadsheets becomes challenging, especially when you want to highlight regional trends and patterns. 📊
The solution? Add a map in Excel.
How to add a map in Excel, you ask? We’ll walk you through the process step by step. We’ll also show you how to visualize data from various regions so anybody can grasp the insights at a glance.
Finally, we’ll introduce you to great Microsoft Excel alternatives that make maps more interactive and insightful. Congratulations! Your days of surfing through densely packed spreadsheets to identify geographical trends and patterns are over 🎉.
Map charts are an Excel feature that helps you showcase geographical data effectively. They’re a visualization tool, just like flowcharts or graphs in Excel. A map shows specific information about geographical locations, making it easy to identify patterns and gather data insights at a glance.
Excel’s map is a handy feature for visualizing data by cities, countries, states, counties, or zip codes. You can also add color coding, size variations, and other visual indicators to differentiate data values in various regions.
You can use maps in Excel to analyze sales performance across different states. Visualizing sales data on a map lets you quickly see which regions are performing well and which areas may need additional attention or resources.
To create a map in Excel, enter your location-based data (place names plus values) and optionally enrich it using Data → Geography so Excel recognizes regions and can auto-fill details like population. Next, select the full data range, go to Insert → Maps, and choose the best map type (filled or symbol) for your dataset. Finally, customize the map’s appearance using fill, borders, labels, projection, and map area settings for better clarity. You can also use ClickUp’s Spreadsheet Template with Map View to organize location data and visualize it geographically.
To add an Excel map chart, you need to go to the ‘ribbon’ in Excel’s toolbar, where you’ll find all the features you need.
It provides quick access to various group-related functions while making finding tools like ‘maps’ easier under the ‘insert’ tab.

If you’re about to open Excel for a new sheet, try ClickUp’s Spreadsheet Template instead. It gives you a flexible, ready-to-go space to manage data, tasks, or lists—without juggling files or formulas.
To add a map in Excel, launch Excel and enter your database, or use spreadsheet templates to plug and play the information.
You can include location names and the corresponding values you wish to visualize.
If you want to slice your data by countries or states, you can use the “Data” feature in Excel to enrich your visualization.

The ‘geography data’ icon means all your entries are now converted to ‘geography data type.’ Now, you can click on the small icon next to your column, and it will automatically show information about your entries.
For example, if you have a list of districts from the US, you’ll see options like Population, Area, Birth rate, Calling code, Currency code, etc. You can choose ‘population’ to enrich your list, and Excel will automatically create a column with that information for you.

To compare values, highlight the data range that includes your geographical information and the associated values in the category map.

To create a map chart, go to the ‘Insert’ tab on the Ribbon.

Select the type of Excel map chart that best fits your data, such as a filled or symbol map.

After building an Excel map chart, you can enhance its clarity and visual appeal by adjusting the colors, labels, and other map formatting options.
If you double-click the map chart, you get two options: ‘Fill’ and ‘Border’. To change the chart design, you can fill in the colors inside and outside the map and change the border’s color scheme.

If you double-click on the map, you’ll find more chart designs, such as the map projection, map area, and map label options.
Here, you can change whether you want to show a specific part of the globe or the whole world. You can also add labels of countries to your map. If you click ‘show all’ as the map projection option, you’ll see the names of the chosen countries on the map so anybody can identify the regions.

Read more: How to add a flowchart in Excel?
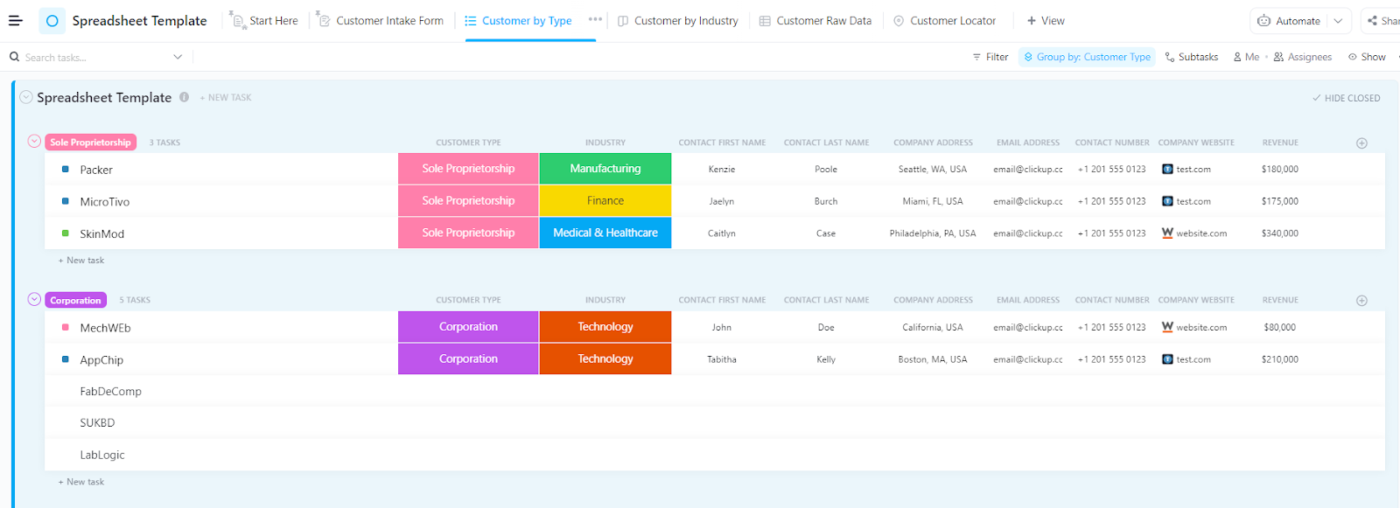
Use ClickUp’s Spreadsheet Template to track your data based on specific information, including location, age group, and contact details in each row. Use individual views to filter data based on industry, type, and more to sort them further.
This is handy for use cases like storing customer data, where you can organize critical information filtered based on your specific needs. Once the data is in place, use the ClickUp Map View in the template to visualize your data using geographic terms.

Pro tip💡: ClickUp’s spreadsheet software has the ‘Use the ClickUp Form View,’ an intake form, to enter new data into your spreadsheets at the for entering new data customer information into your spreadsheets at the very beginning.
There are many useful features to guide you when creating a map in Microsoft Excel, including:
| Feature | Description | Example |
|---|---|---|
| Categories | Categorizing refers to grouping regions into different categories | Group states into categories like high sales, medium sales, and low sales |
| Display Values | Display values show numerical data, such as postal codes, directly on the map | Show the sales figures for each state right on the map |
| Color Scales | Use color scales to represent different data ranges | Use a gradient from green to red to show low- to high-sales areas |
| Map Projection Styles | Choose different map projections to display the map accurately based on your data | Use a Mercator projection for global sales data |
| Data Labels | Add or customize data labels to display additional information directly on the map | Label each state with its population or sales figures to provide more context |
After creating the map, use the following three steps to embed them anywhere in the Excel Sheet.
Combine Excel Map Charts with Pivot Tables and Slicers to turn geographic data into interactive insights. Pivot Tables summarize large datasets by region, time period, or category, and the connected map updates automatically as you change fields or filters. Add slicers as visual controls to quickly filter the Pivot Table (and map) by segments like age group or region. This makes it easier to spot top-performing areas, uncover hidden trends, and plan targeted actions based on what the map reveals.
Consider combining maps with Pivot Tables and Slicers to get deeper insights from your geographical data:
Pivot Table in Microsoft Excel helps you summarize and analyze large data sets. Connecting your map chart to a pivot table lets you quickly summarize sales performance by region, filter for specific periods, and aggregate sales data to see which areas perform best.
This dynamic analysis helps you pinpoint high-performing regions and areas needing attention. It also lets you identify patterns and trends in the data you may have missed.

Read more: AI Excel tools to analyze data, predict trends, and automate your spreadsheet workflow
Slicers are visual filters that make filtering data in pivot tables and charts easy. When combined with map charts, slicers allow you to filter and explore your data interactively.
Suppose you have customer data with information on age groups and regions. You can easily filter the map using slicers to show only the data for people aged 18-25.
You can then view where this age group is located and use this information to create targeted marketing strategies for those regions.
Excel’s 3D Maps (Power Map) let you plot geographic and time-based data on a 3D globe, including animated tours that show changes over time. Geographical heat maps use color gradients to reveal data density and highlight hotspots or underperforming regions at a glance. Data labels and annotations add exact figures and context—like campaign notes—directly on the map for faster, clearer insights.
With Excel’s 3D Maps or Power Map, you can plot geographic and temporal data on a 3D globe or custom map. 3D maps create exciting animated tours to showcase data changes over time or highlight specific data points.
For example, this map format is a great choice for presenting the global trend of YoY imports and exports over the last 10 years by city.
Once you add geographical heat maps in Excel, it color-codes regions based on data values, visually representing data density and distribution. For instance, you can use a gradient color scale to highlight the variation in sales volume.
This visual representation makes it easy to identify hotspots, such as states with exceptional performance and areas that may need more attention.

Adding data labels and annotations to your maps makes your data more informative by providing additional context.
Imagine you’re a sales manager analyzing sales data across different states. By adding data labels and annotations to your map, you can display the exact sales figures directly on each state within the map.
You can also add campaign information on the states with high sales figures so viewers can understand the figures resulting from a specific marketing campaign. This helps you communicate your findings at a glance.
Although you can add a map in an Excel sheet, it has certain limitations.

ClickUp is a strong Excel alternative for interactive map-based and spreadsheet-style data management, helping overcome Excel’s advanced visualization limits. Import your Excel database or start with templates, then use ClickUp Map View to plot locations, customize pins, and link map points directly to tasks. With Table View and editable spreadsheet templates, you also get flexible data handling, customization, automation, and workflow tracking in one place.
While Excel is a powerful map-creation tool, it doesn’t offer advanced data visualization. To overcome Excel limitations, we tried several Excel alternatives in the market. ClickUp tops the charts.
As an all-in-one project management platform with robust spreadsheet features, ClickUp can address these gaps. It provides an integrated and efficient solution for managing your data.
To start with ClickUp, import your database from Excel to ClickUp using this easy-to-use guide on how to create a database in ClickUp.
Alternatively, pick a database template to get started.
Once you’ve organized your data into the ClickUp Task hierarchy, you can easily display it in the Map view.
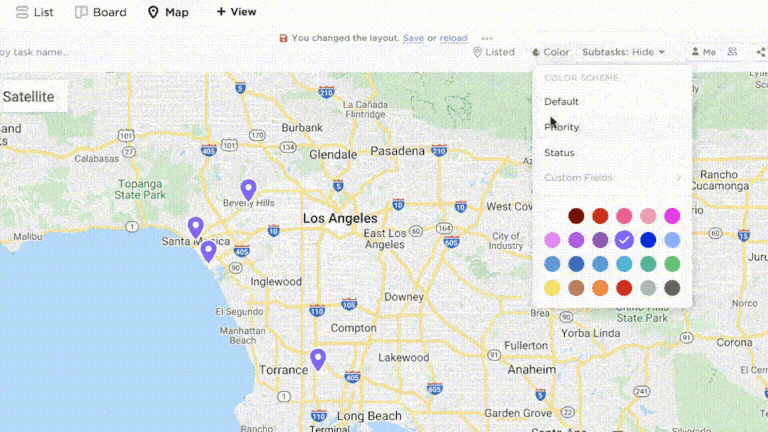
The ClickUp Map View transforms location-specific data into interactive, visually appealing maps.

Open your ClickUp Workspace, add a Map View to the relevant project or list, and start plotting locations by entering addresses or coordinates. Customize each map point with names, descriptions, and custom fields, using marker styles or colors to distinguish data. Link locations to tasks so you can assign owners, set due dates, and track statuses directly from the map. Finally, adjust map settings for layout and style, save the view, and share it with your team using the right permissions.
You can use color coding or different marker styles to differentiate between data points.
Link each map point to tasks by selecting the ‘Link Task’ option within the location details. This integration ensures that geographical data is seamlessly connected with your project management workflows. You can assign these tasks to team members, set due dates, and add task statuses directly from the map.
Access the map settings to customize the map’s appearance. You can choose different map styles, adjust zoom levels, and set default views.
Once your map is set up, save the view. You can share the map with your team by setting the appropriate permissions and sharing options within ClickUp. Team members can view, edit, and interact with the map data.
Use Location Custom Fields in ClickUp tasks to capture addresses and sort work by customer or job-site geography. Manage location-based workflows visually using customizable map pins for status and priority, and share mapped task locations through a private link. For spreadsheet-style organization, the ClickUp Editable Spreadsheet Template (Table View) helps automate data import, apply custom formulas, track progress with visuals, and keep data accurate—while enabling easy task assignment, deadlines, and progress tracking.
Add Location Custom Fields to include geographical addresses in your task items. Based on location data for customers and job sites for employees, categorize and sort the information.
Customizable pins for status and priority allow you to manage your geographical work on a map. View task locations and share them with anyone using a private link.
Pro tip💡: Combining map view with location custom field further enriches your insights by giving a clear view of where your tasks, destinations, or any relevant information falls on existing maps.
If you’re a fan of the good old table view, consider using ClickUp’s Editable Spreadsheet Template to store, organize, and structure your data.
Here’s how it helps you get your spreadsheets in order:
Use this template to switch to ClickUp Table View for a more streamlined project management approach, where you can easily assign tasks, set deadlines, and track progress.

ClickUp’s Table View lets you manage rows and columns like a spreadsheet, but with stronger project management features that make switching from Excel easier. You can customize the layout by adding, removing, or reordering columns, changing field types, and using filters or sorting to fit different use cases. It also connects directly to tasks, so you can create and assign work, set deadlines, and track statuses, priorities, and progress in one synchronized workspace.
Easily add, edit, and manage data rows and columns as you would in spreadsheets, but with improved Excel project management capabilities. This helps you seamlessly transition from Excel to ClickUp.
Adjust the layout and data fields according to your specific needs. Add, remove, or reorder columns, change column types (like text, numbers, dates, etc.), and apply filters or sorting to manage your data effectively.
The Table View can be tailored to fit various use cases, from project tracking to data analysis.
Unlike Excel, ClickUp’s Table View integrates directly with its task management features. You can link data entries with tasks, deadlines, and assignees.
Create tasks directly from the Table View, assign them to team members, set due dates, and track progress. Also, add task statuses, priorities, and custom fields to manage workflows. This ensures that all aspects of your projects are synchronized and easily accessible.
Map views showcase geographical data types and the insights contained within them. While Excel maps are great for this, they have limitations.
You need a robust tool like ClickUp to create detailed, interactive maps without the manual hassle. For example, ClickUp’s Map View allows you to add a location to any task and sort, filter, and customize your maps with the latest information.
Additionally, ClickUp’s pre-built templates for Excel project management ensure automated data transfer across documents for data accuracy and consistency.
If you’re looking for an Excel alternative to advanced data visualization capabilities, we recommend signing up for free with ClickUp.

© 2026 ClickUp

There’s an easier way. Try a free AI Agent in ClickUp that actually does the work for you—set up in minutes, save hours every week.