No matter your product or service, you need a mechanism to identify failure risks and plan prevention strategies. The Failure Mode and Effects Analysis (FMEA), developed by the United States Military in the late 1940s, is one of the oldest tools for risk detection and reduction.
FMEA exercises can be carried out for any initiative, be it a project, product, system, or service delivery. The analysis facilitates a systematic breakdown of critical problems, devising practical steps to address them and compiling lessons learned to limit future risks.
Since FMEA is a proactive and future-oriented endeavor, most managers rely on templates to add structure to the whole operation. These templates can be equipped with pre-designed layouts, Kanban boards, and process steps to help you account for waste, defects, or harmful outcomes thoroughly.
In this article, we’ll introduce you to 10 user-friendly FMEA templates for efficiently identifying failures and preventing unnecessary losses. ✨
- What Is Failure Mode and Effect Analysis?
- 10 Free FMEA Templates for Proactive Managers
- 1. ClickUp Process FMEA Lean Six Sigma Template
- 2. ClickUp 5 Whys Template
- 3. ClickUp Cause and Effect Whiteboard Template
- 4. ClickUp Critical Pathway Analysis Template
- 5. ClickUp Assumption Grid Decision Matrix Template
- 6. PowerPoint FMEA Template by SlideTeam
- 7. PowerPoint Matrix Chart for FMEA Interpretation by SlideTeam
- 8. FMEA Excel Template by Visual-Paradigm
- 9. Excel Failure Mode & Effect Analysis Template by GoLeanSixSigma
- 10. Excel Failure Mode and Effect Analysis Template by CIToolKit
What Is Failure Mode and Effect Analysis?
Failure Mode and Effects Analysis is a structured risk management technique employed to pinpoint and evaluate the potential impacts of errors or faults within a process. This method identifies potential failure modes, traces their origins and repercussions, and helps formulate strategies to minimize, mitigate, or correct these failures. ☑️
The FMEA approach mainly focuses on three key factors:
- Occurrence: The causes and frequency of failures in the relevant design, assembly, manufacturing, or delivery process
- Severity: The impact of the resulting consequences
- Prevention: Steps to prevent or mitigate the problem
Once these assessments are made, you can address preventable failures through proactive measures. You may also want contingency plans in place to manage unforeseeable risks.
There are primarily two types of FMEA:
- Design FMEA (DFMEA): Used in either the initial or final stages of product design to identify potential design-related failures that may pose safety, health, or environmental risks
- Process FMEA (PFMEA): Uncover risks linked to process changes that could have adverse effects on process dependability, product quality, public safety, customer contentment, and finances
What are the steps in the FMEA exercise?
There are many ways to go about the FMEA process. Here are the standard steps for detailed employment:
| Step 1 | Process step/Input identification | Create a process map listing all steps and critical inputs of the analyzed process |
| Step 2 | Potential failure mode | Identify potential failure risks for each process or input point |
| Step 3 | Potential failure effects | Anticipate the impact of the failures outlined in Step 2 |
| Step 4 | Severity and frequency ranking | Assign rankings to each effect, ranging from 1 (low impact or unlikely) to 10 (high impact or very likely) |
| Step 5 | Potential causes | Conduct a root cause analysis to determine the reason behind each failure |
| Step 6 | Detection ranking | Gauge the likelihood of detecting a failure mode if it occurs, ranging from 1 (almost certain) to 10 (very unlikely) |
| Step 7 | Risk priority number (RPN) | Evaluate detection, severity, and frequency of risks to assign an RPN for each failure mode |
| Step 8 | Action plan | Develop an action plan to reduce failure mode RPNs, specifying responsible parties, tasks, and timelines |
| Step 9 | Follow up | Review what’s implemented and reevaluate RPNs if necessary |
10 Free FMEA Templates for Proactive Managers
As you’ve seen, conducting an FMEA is both time-consuming and intense, so it’s beneficial to have specially designed templates to assist you.
We’ve curated a list of the top 10 PowerPoint, Excel, and ClickUp templates to help you spot potential pitfalls and chart your course to success effortlessly. Let’s take a look at their handy features below. 👀
1. ClickUp Process FMEA Lean Six Sigma Template
Process improvement experts love using the Lean Six Sigma framework to enhance organizational workflows. It’s an even more effective tool when combined with the FMEA process!
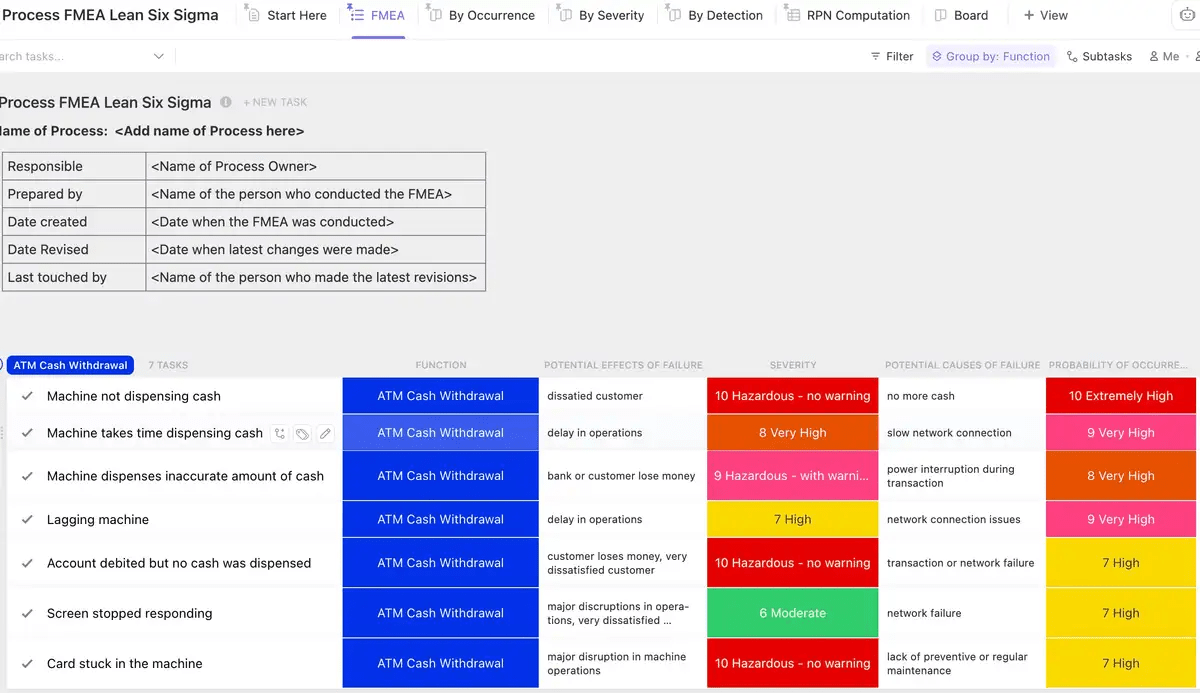
The ClickUp Process FMEA Lean Six Sigma Template is your secret weapon for precisely spotting process risks, shedding light on improvement areas, and developing the perfect corrective action plan. 💡
The template sets you up with a visually packed structure to assess processes. Open the FMEA List view to oversee recorded process failures, each with contextual details (like function, severity, probability of occurrence, and potential causes) stored in Custom Fields.
In the By Occurrence Board view, arrange process failures as Kanban cards based on their likelihood of occurrence. You can switch the view to focus on detection or severity risks.
Finally, in the RPN Computation Table view, you’ll find a table listing all failures along with their assigned scores for Severity, Probability of Occurrence, Probability of Detection, and the resulting Risk Priority Number (RPN). Use it to calculate the RPN and identify which process should be prioritized in the action plan.
You can create actionable tasks directly in the template and use automated Reminders to follow up on them.
2. ClickUp 5 Whys Template
Crack complex process flow cases like a true detective using the ClickUp 5 Whys Template. 🕵️
This Whiteboard template helps uncover the root cause of issues while maintaining a visually appealing and creative FMEA format.
ClickUp Whiteboards are canvases that let you visualize workflows by adding shapes, mind maps, images, sticky notes, and graphs. Leverage the tool to create intricate step-by-step process maps.
The template has a pre-designed map that asks “Why?” five times to help you get to the root cause of a problem. Start by inserting the problem in the designated field and brainstorm on the Whys. The map resembles a flight of stairs—the farther you go, the closer you get to nailing down recurring patterns or root causes.
To illustrate, the first three whys could look something like this:
Problem: Slow customer service response times.
1st Why: Why are response times slow?
- Answer: Support executives are overwhelmed with a large number of questions.
- 2nd Why: Why are there so many questions?
- Answer: Marketing campaigns increased customer interest.
- 3rd Why: Why did the marketing campaigns increase customer interest?
- Answer: They targeted a broader audience than usual.
- 3rd Why: Why did the marketing campaigns increase customer interest?
- Answer: Marketing campaigns increased customer interest.
- 2nd Why: Why are there so many questions?
The template is color-coded, enabling you to visually segregate problems, reasons, and whys. Plus, it encourages teams to cook up clever solutions through real-time editing and proofing.
You also get a color-coded legend to streamline navigation through the map. Move it across the whiteboard, change the shapes and colors of the included items, or replace the placeholder text with your own.
3. ClickUp Cause and Effect Whiteboard Template
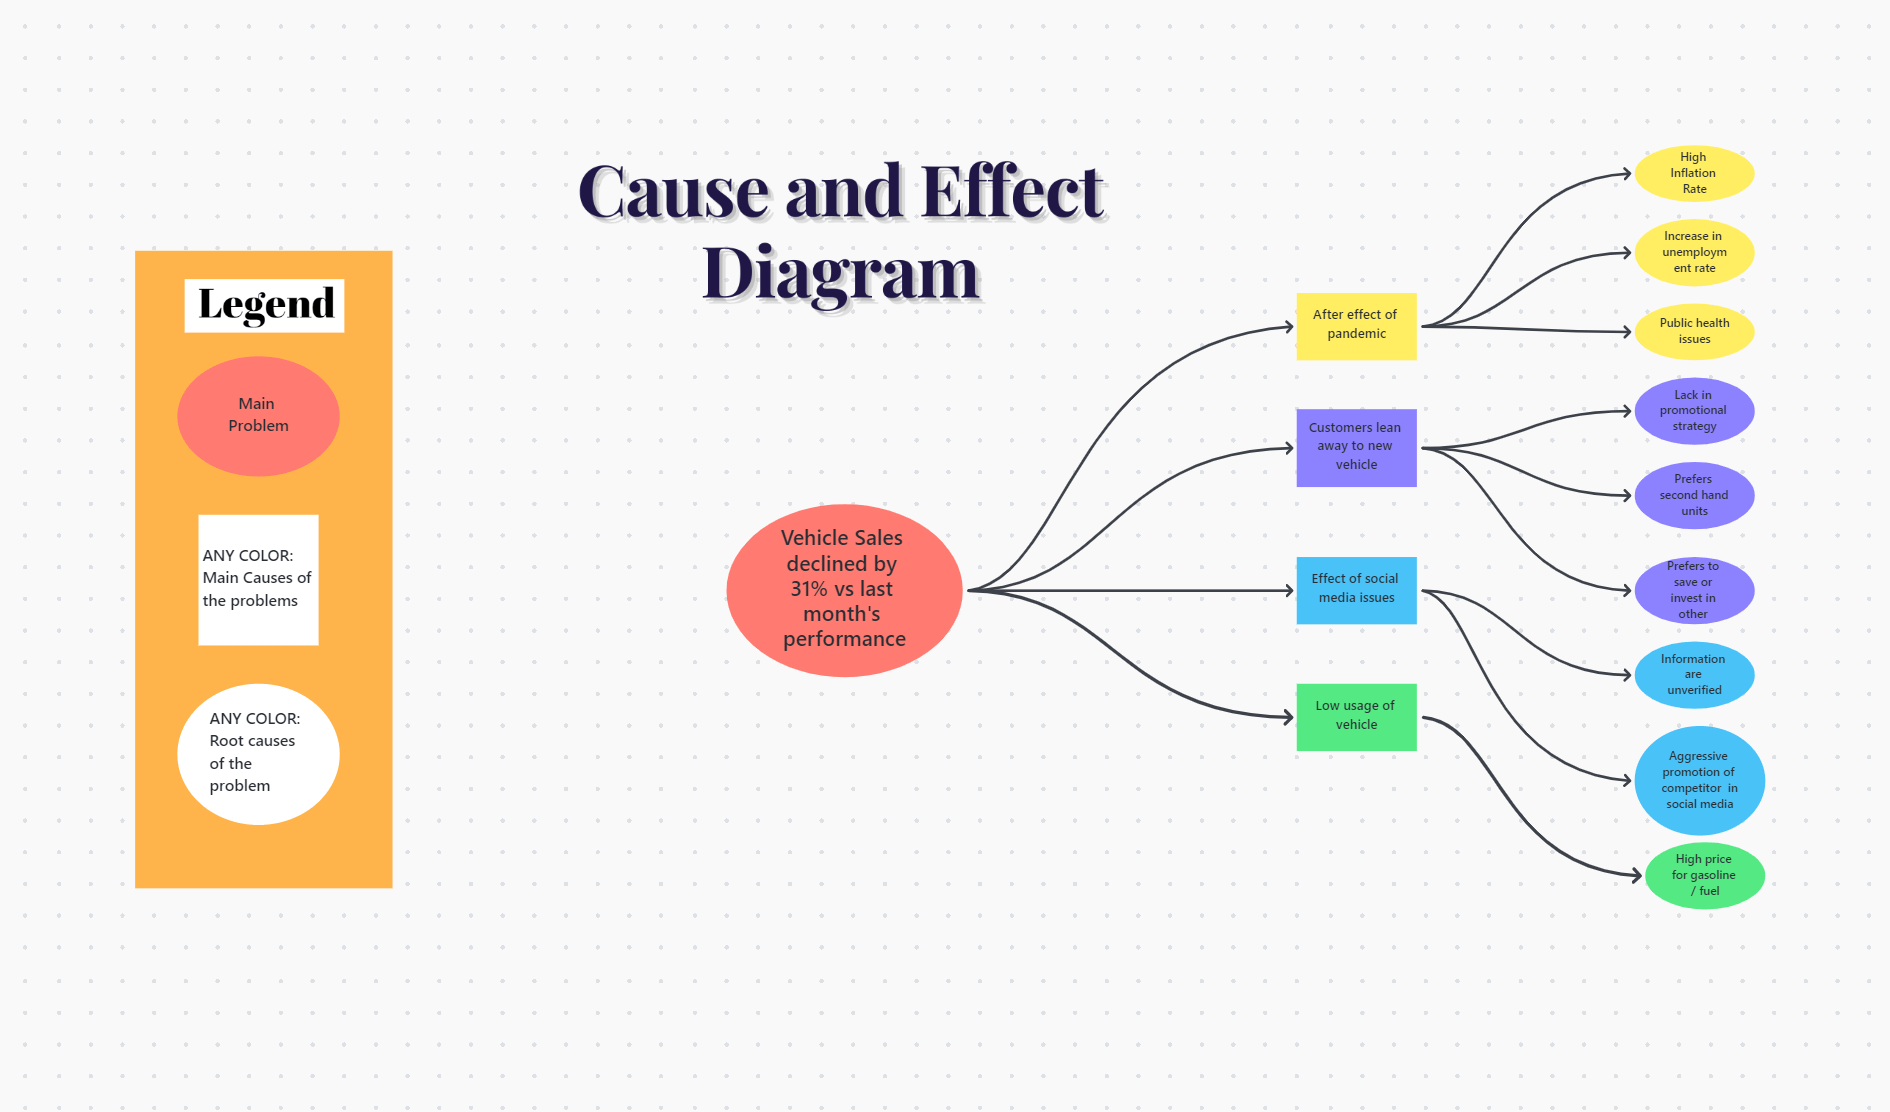
Pinpoint problem origins, areas for improvement, and potential risks with the ClickUp Cause and Effect Whiteboard Template, a powerful tool for visualizing and prioritizing tasks.
It comes with a pre-made cause-and-effect diagram on a whiteboard. It’s fully adaptable to your needs—all you have to do is break down complex problems into micro-processes to identify risk factors. Here’s how to use the diagram through a practical example:
- Main problem: Identify the main issue, e.g., T-shirt sales declined by 20% in the past two months
- Main causes: Use connectors to branch out and link the main problem with causes, such as poor demand or weak advertising
- Root causes: Connect the main causes with the deeply rooted reasons behind your problem. For our sample case, the causes can be aggressive competitor advertisements or outdated t-shirt designs
Create as many branches and connectors as you need to get to the bottom of the issue. Take advantage of color coding to clearly differentiate between each problem’s causes and highlight the connection for your team. If you want, you can create a task to analyze each cause-and-effect relationship and brainstorm potential solutions on the same whiteboard. 🧠
4. ClickUp Critical Pathway Analysis Template
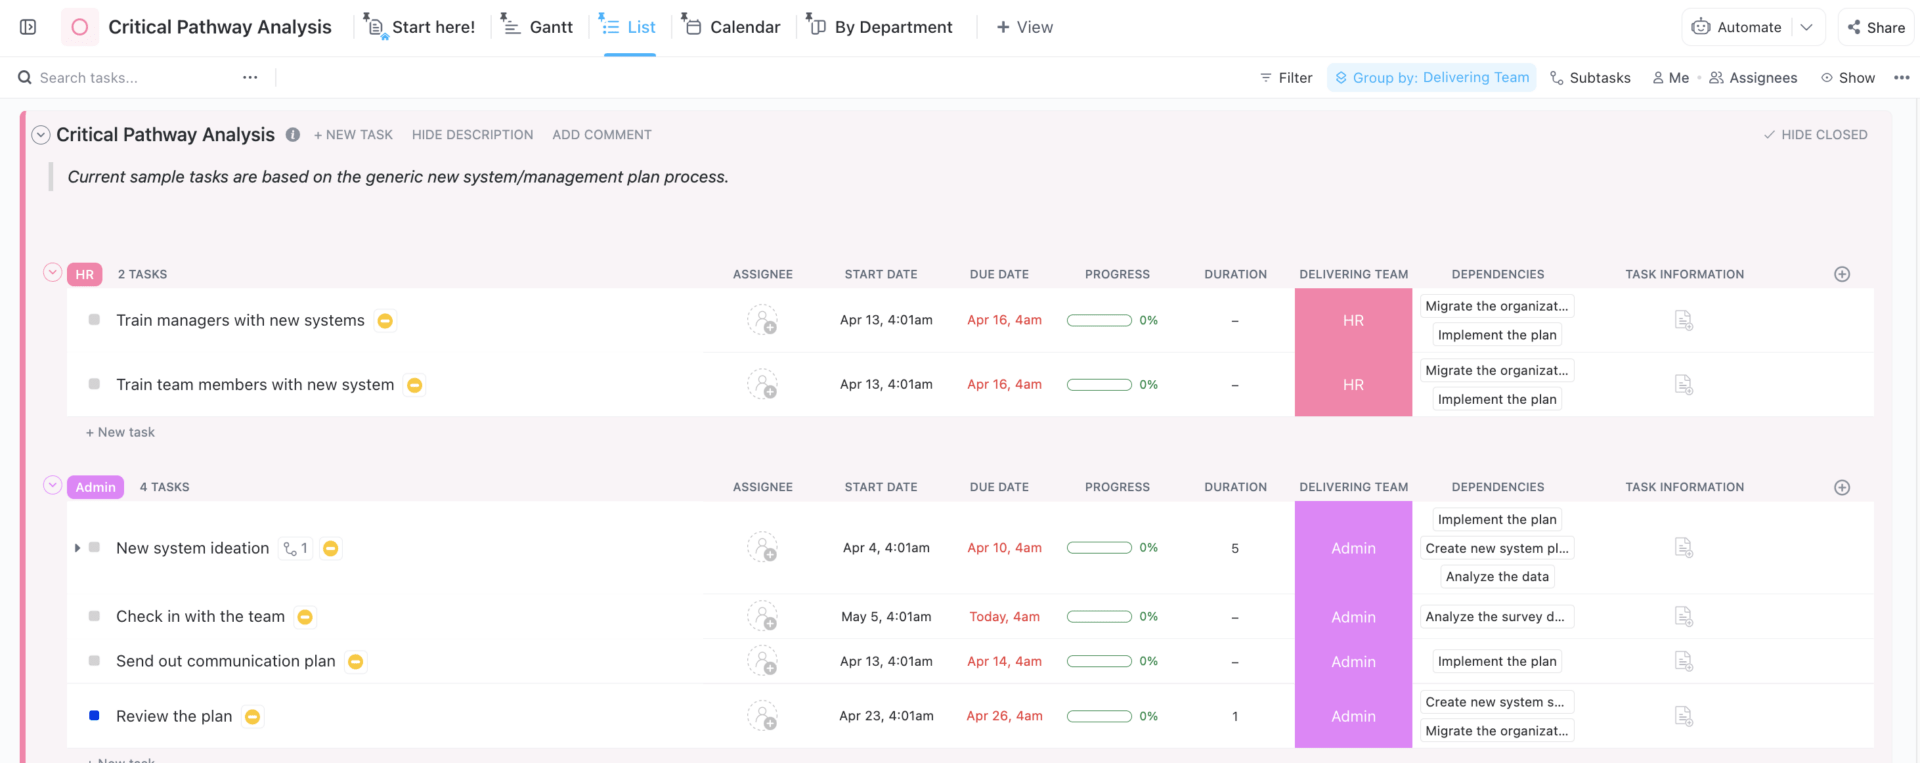
The ClickUp Critical Path Analysis Template is ideal for mapping out tasks that are non-negotiable for timely project completion and those that can take a breather if you need to shuffle resources to stay on schedule. 📅
Use the template’s Calendar view to check upcoming tasks and modify due dates by dragging the task’s end bar. Check task attributes through Custom Fields like Duration, Delivering Team, and Progress.
In the Gantt chart view, you can visualize project dependencies, durations, and breaks through color coding. The available options include:
- Tasks marked with a block featuring blue diagonal lines indicate that the task is complete
- Gray lines with arrowheads connecting tasks signify dependencies between them
- A red oval shape symbolizes a task with a blocking dependency
When you enable the Reschedule Dependencies feature, shifting a task with dependencies will automatically adjust the schedules of subsequent linked tasks.
Monitor entire projects in the By Department Board view that groups tasks according to their respective departments or delivering teams. Or, you can open the List view for a straightforward list of tasks organized by their statuses.
📮 ClickUp Insight: Nearly 42% of knowledge workers prefer email for team communication. But it comes at a cost. Since most emails only reach select teammates, knowledge stays fragmented, hampering collaboration and quick decisions. To improve visibility and accelerate collaboration, leverage an everything app for work like ClickUp, which turns your emails into actionable tasks within seconds!
5. ClickUp Assumption Grid Decision Matrix Template
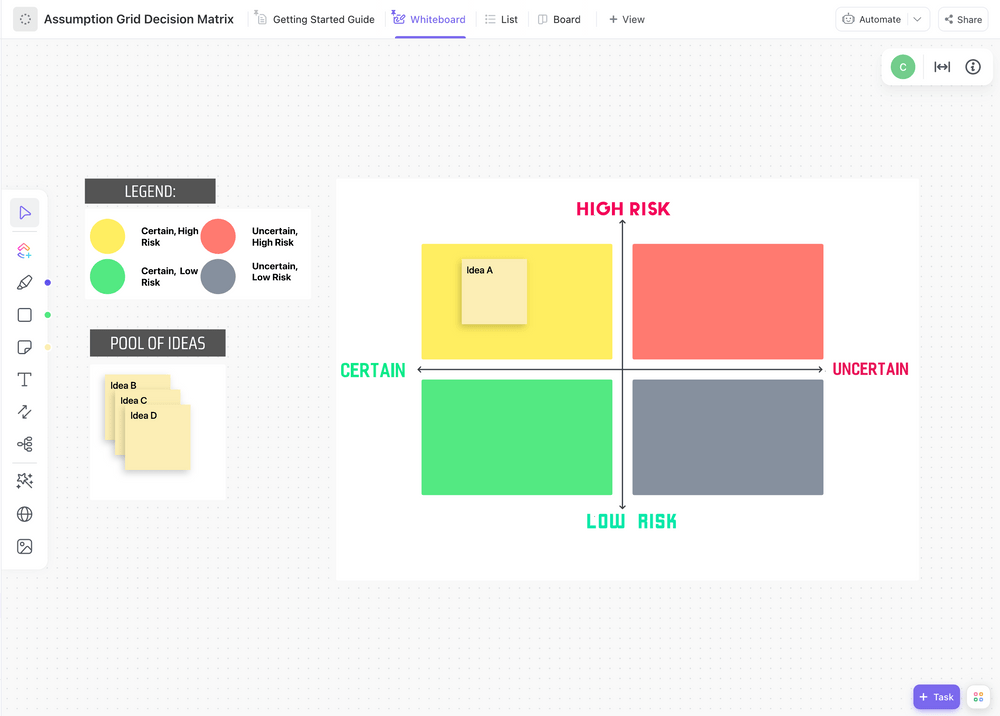
Decisions can be a real brain teaser, but with the ClickUp Assumption Grid Decision Matrix Template, you’ll become a pro at tackling them! This template lets you explore various possibilities of the problem at hand by streamlining assumptions and assessing associated uncertainties with teams before making reasonable choices.
Categorize ideas according to risk levels on a clear and visually appealing whiteboard. Refer to the built-in guide to navigate the risk axis with pre-built boxes (quadrants), each color-coded to depict multiple perspectives:
- Yellow: Certain, High Risk 💛
- Red: Uncertain, High Risk ❤️
- Green: Certain, Low Risk 💚
- Grey: Uncertain, Low Risk 🖤
Use the Pool of Ideas to collaborate with your team and arrange contributions as cards. Once you’ve assessed risks and certainties, move them to the appropriate box with a drag-and-drop action.
Explore the List view to see your tasks grouped by status (To Do, In Progress, or Done). Many project managers find the Board view more convenient for decision-making, as it displays your discussion components as draggable cards in a single window.
6. PowerPoint FMEA Template by SlideTeam
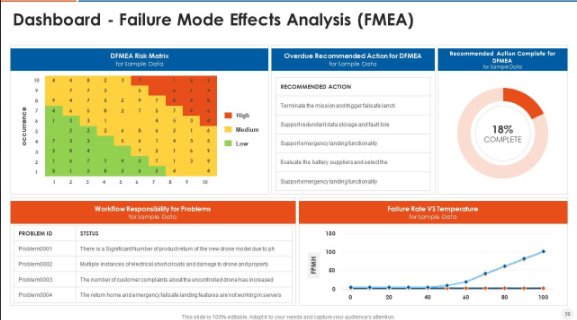
Looking to communicate a Failure Mode and Effects Analysis plan to your team? Grab their attention with the FMEA PowerPoint Template by SlideTeam.
Use the illustrative tool to go through all FMEA steps one by one, ending with a persuasive action plan. We recommend providing a description and an example for each step using tables for clear visualization.
This template comes with pre-designed slides for DFMEA and PFMEA, featuring tables and pie charts, as well as an FMEA risk calculation table, to present risk levels in an organized and easy-to-understand manner.
This template is an instant stunner with rich icons and graphics. Its fifty-four slides are customizable in terms of content, color pattern, text size, and font. Add elements like shapes, charts, and images, insert Post-it notes to highlight important points, or add bar and line charts to show progress. 📊
7. PowerPoint Matrix Chart for FMEA Interpretation by SlideTeam
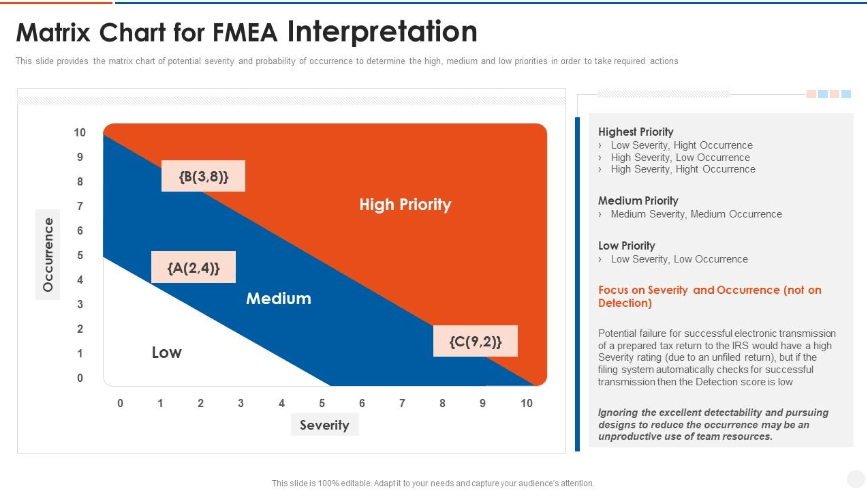
Educate your audience on how to prevent potential failures using the PowerPoint Matrix Chart for FMEA Interpretations by SlideTeam. This single-slide template helps you assess the severity and probability of failure occurrences and categorize priorities as high, medium, or low to create an effective plan of action. 📈
Use the matrix chart to present the risk severity on a scale from 1 (low impact) to 10 (high impact) and the level of occurrence, ranging from 1 (unlikely to occur) to 10 (very likely to occur). Your team will know which processes to prioritize by following a guide on the right side of the template for potential failures.
Customize the slide to match specific business or audience demands. Change the color scheme of the matrix chart, add or edit text items, or include icons and shapes to illustrate critical FMEA sections.
8. FMEA Excel Template by Visual-Paradigm
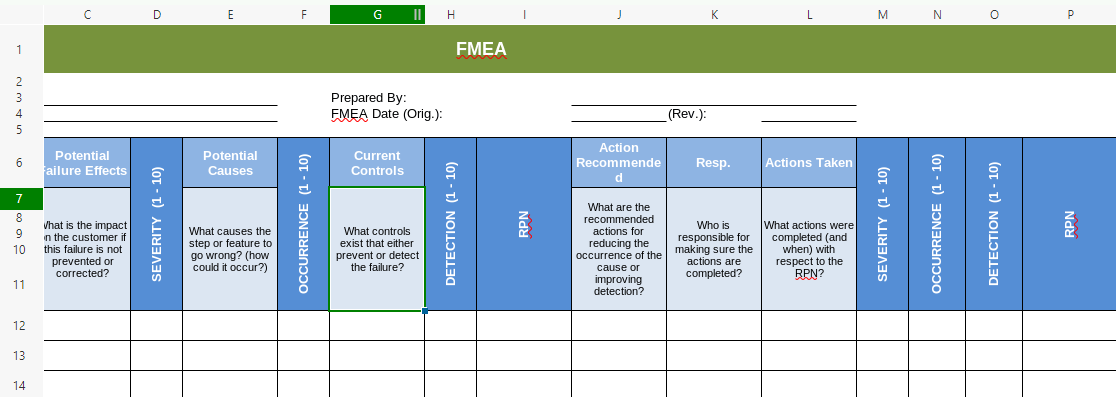
Spreadsheet lovers can now document the FMEA process on a single sheet using the Excel FMEA Template by Visual-Paradigm. It features comprehensive sections for every FMEA step, along with questions to serve as guidelines throughout the process.
The template comprises two main sections: the header and the columns. The header contains admin details, like the process name, who’s responsible, and the date, for FMEA analysis and document tracking. The columns in the template’s body follow a hierarchy to keep the records consistent across all FMEA forms.
Use the sheet’s body to look into the investigated process, potential failure modes, effects, and causes. Rank severity, occurrence, and detection on a scale of 1 to 10 and calculate RPNs. 🧮
This template can be expandable with extra sections as needed. For instance, you can include more rows to accommodate additional process steps or product components. You can also remove rows, change the table layout, or choose a different font.
9. Excel Failure Mode & Effect Analysis Template by GoLeanSixSigma
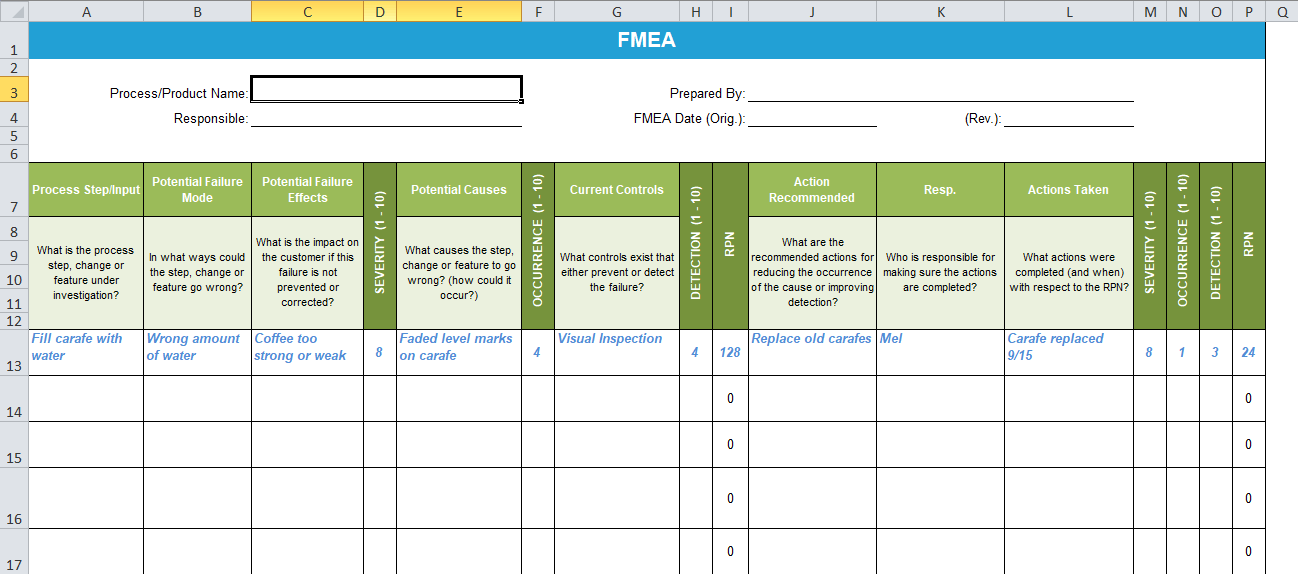
If you’re new to conducting FMEA, the Excel Failure Mode & Effect Analysis Template by GoLeanSixSigma is a great place to start. It comes with separate sheets that contain practical examples of FMEA implementation for different scenarios.
This template is fully editable and contains pre-made questions to help you fill the table more efficiently. Whether you’re working in finance, healthcare, or hospitality, it offers insights into what you should note down in each FMEA stage. There are also separate sheets that explain severity, occurrence, and detection scale.
The template contains a header section outlining processes and the main table accommodating FMEA stages. While it has no real-time collaboration tools, you can always share it with your collaborators via email.
10. Excel Failure Mode and Effect Analysis Template by CIToolKit
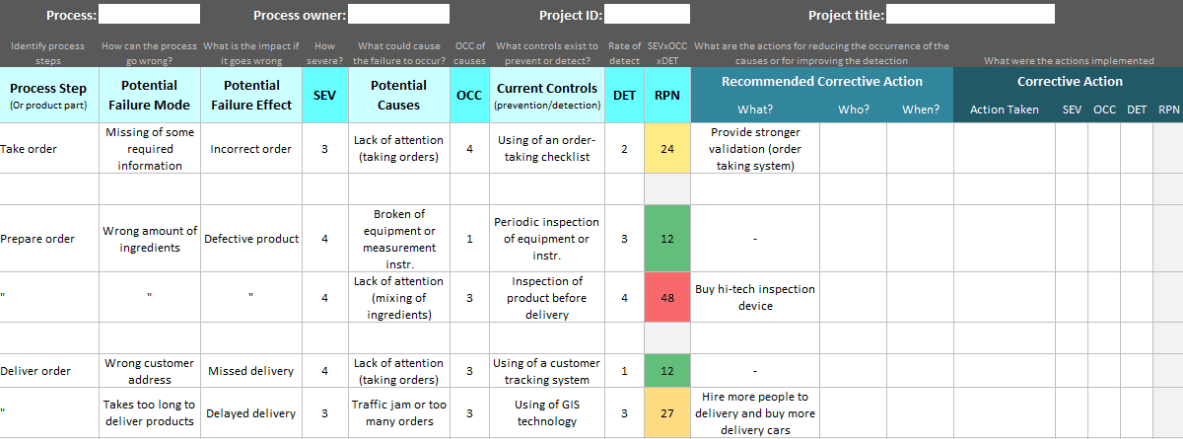
Identify process steps, dig through failure causes, and create follow-up plans using the Excel Failure Mode and Effect Analysis Template by CIToolKit. This easy-to-use template comes with a pre-formatted FMEA table, modifiable for different project requirements.
The template supports a five-step FMEA process. Let’s say you’re running a food delivery business. In that case, you can identify the following:
- Process step: How is the process conducted? (taking orders)
- Potential failure mode: How can the process go wrong? (required information is missing)
- Potential failure effect: What would the impact be if it goes wrong? (incorrect order)
- Potential causes: What can cause failure to occur? (poor attention span)
- Current controls: How to prevent this in the future? (use an order-taking checklist)
The template has rows for severity, occurrence, detection, and corrective actions. You can remove or add rows or change the table typography to match your branding. 🔠
Detect, Prevent, and Win with These Templates
Say goodbye to starting from scratch and embrace efficient risk analysis and action planning, thanks to the top-grade FMEA-focused templates we presented.
For extra convenience, dive into the ClickUp template library featuring 1,000+ pre-designed, user-friendly templates, covering everything from project documentation and management to implementing corrective action plans. 🏇


