

As a project manager, how do you know if you’re progressing as planned? One, by comparing progress to plan, and two, by comparing plan to benchmarks. The S-curve is a simple, effective, and visual way to achieve both.
Let’s get into the details!
How Can an S-Curve Benefit Your Project Management Team?
What is an S-Curve in Project Management?
An S-curve, as the name suggests, is an S-shaped mathematical graph that plots cumulative data points across the X and Y axis.
For example, if you plot the cumulative time for the project (daily/weekly/monthly) on the X axis and the cumulative tasks you’ve executed on the Y axis, you will get a graph shaped loosely like the letter S.

An S-curve has two inflection points. The growth of a project is typically slow in the early stages because the teams are getting used to the industry or are understanding the requirements.
These teething troubles are resolved at the first point of inflection, and the project accelerates, creating an upward slope. At the second point of inflection, the project matures, flattening progress.
The S-curve isn’t something that’s designed or forced; it is merely the natural progression of a project. The only thing you can perhaps influence is where the inflections occur.
Importance of S-Curves for Decision Making
An S-curve is one of the most straightforward tools available to the project manager, offering outsized benefits. The S-curve presents a holistic view of the project, becoming a powerful part of the decision-making process. Here’s how.
Track progress with S-curves
At the beginning of the project, all managers make projections of how long the project will take, how many people they need, what other resources they need, how much this will cost, etc.
The most common use of an S-curve is to map these projections with ongoing progress, serving as a great project status report. Project managers can visualize variations by overlaying the current performance graph on the curve of the projection.
If you take the example of the National Gas Pipeline S-curve above, the orange line is the projection, and the blue line is the progress. You’ll see that from 1870 till 1985, the performance exceeded projections.
For a project manager, this might be a good sign, taking into account associated costs and consequences.
Forecast project needs
An S-curve also serves as a great way to forecast when the project would need maximum resources or investment. For example, in a software product development project, the minimum viable product (MVP) stage will not need as many resources as when the client accepts the MVP and commissions the product.
By mapping the inflection point (acceptance of MVP), project managers can forecast when additional team members will be necessary. They can also predict the flex needed in the system throughout the project lifecycle, which helps create backup plans.
Scenario planning
By varying the inputs of the S-curve, you can plan for potential scenarios. For example, you can see if costs decrease when you extend the project timeframe. Or you can increase the project team size to move the first inflection point leftward.
This way, you can plan and visualize various possibilities and reasonably predict the outcomes.
Manage cash flow
Every manager seeks to complete the project within the budget allocated to them. Yet, nearly 60% of organizations overshoot budgets. This happens gradually and in small increments, going unnoticed.
An S-curve can prevent this. Project managers can make cash flow forecasts by overlaying planned expenses on an S-curve with the funds’ release timeline (which will be in your project budget template).
If they overshoot, they can renegotiate the budget or reduce the scope. If they are under budget, they can add resources or show savings.
Types of S-Curves
While S-curve is an umbrella term encompassing several graphs shaped like the letter, not all of them are created equal. Several kinds of S-curves serve different purposes, offered by various data visualization tools. Here are the most common few.
Baseline S-curve
This is the plan/projection made by the project manager right at the beginning. Typically, this project schedule outlines the effort, cost, and sequence of work to be delivered.
It sets the baseline for all work ahead, hence the name. While it’s generally not modified, sometimes unavoidable changes in scope or schedule can lead managers to alter the baseline S-curve as well.
Target S-curve
This is used to track the progress of the project as it happens. It maps the various project elements based on real data, often in real time. If the target S-curve intersects with the baseline S-curve, your project is in good shape — i.e., progressing as planned.
Any variations might need interventions, such as allocating more resources or adding investments.
Banana curve
A banana curve is the plotting of two S-curves on the same graph. For instance, while scheduling a project, you might consider early start/end dates and late start/end dates and map them all on a graph.
The intersecting S-curves will take the shape of a banana, showing you the critical path and how much float/free float you have.
S-curve use cases
While you can create S-curves for any two related parameters, here are the ones project managers find most useful.
- Cost vs. time S-curve: Maps time on the horizontal and cost of executing the project on the vertical axis. This S-curve helps track the costs over a project’s lifecycle
- Sales/revenue vs. time S-curve: Maps the projected data for sales over time. This S-curve helps identify the break-even point and potential ROI
- Man hours vs. time S-curve: Maps the time taken to complete the project across different phases. This S-curve helps with estimation and resource allocation
While S-curves are flexible and useful across scenarios, they come with their own limitations too.
Limitations of S-Curves
The shape of the S-curve itself isn’t the most insightful, except that they are a statement of fact about how a situation naturally evolves. Cumulatively, most data points are likely to take an S-shape when plotted.
By extension, an S-curve doesn’t suggest what action needs to be taken beyond what additional funds or resources can do. This limits creative problem-solving.
An S-curve does not account for unforeseen circumstances or external factors, such as a pandemic or a competitor launching a similar product. It is a graph of events when everything remains constant.
It also does not reflect the dynamic evolution of the market. The S-curve might be limited to making decisions to compete in the ever-evolving market.
These limitations are similar to any tool or framework designed for a specific purpose. Depending on what you use it for, S-curves can be extremely handy. Here’s how.
How to Create an S-Curve
To create an S-curve, all you need is data. Once you have data, you can create an S-curve on any spreadsheet or mind-mapping software.
1. Gather your data
For basic project management S-curves, you need data about time taken, costs involved, resources needed, revenue opportunities, etc. Gather all of them on a standard scale.
If you choose a time vs. x S-curve, you might also want to include milestones. For instance, if it is a software product development project, the milestones would be prototype, user testing, MVP launch, beta launch, etc. Mapping them helps correlate the natural inflection points to your project milestones. If you’re already using a visual project management software like ClickUp, you will likely have collected this data over time.
2. Select the data you need
While managing your projects on ClickUp, you’re likely to have a wide variety of information:
- Tasks
- Milestones
- Timelines
- Priorities
- Due dates and actual delivery dates
- Time estimates and actual time tracked
- Workloads for each team member
Select the data you need depending on the analysis you want to make. This could be real time cumulative data. The ClickUp Whiteboard is a great way to visualize workflows, combine all these elements, and see them in one place.

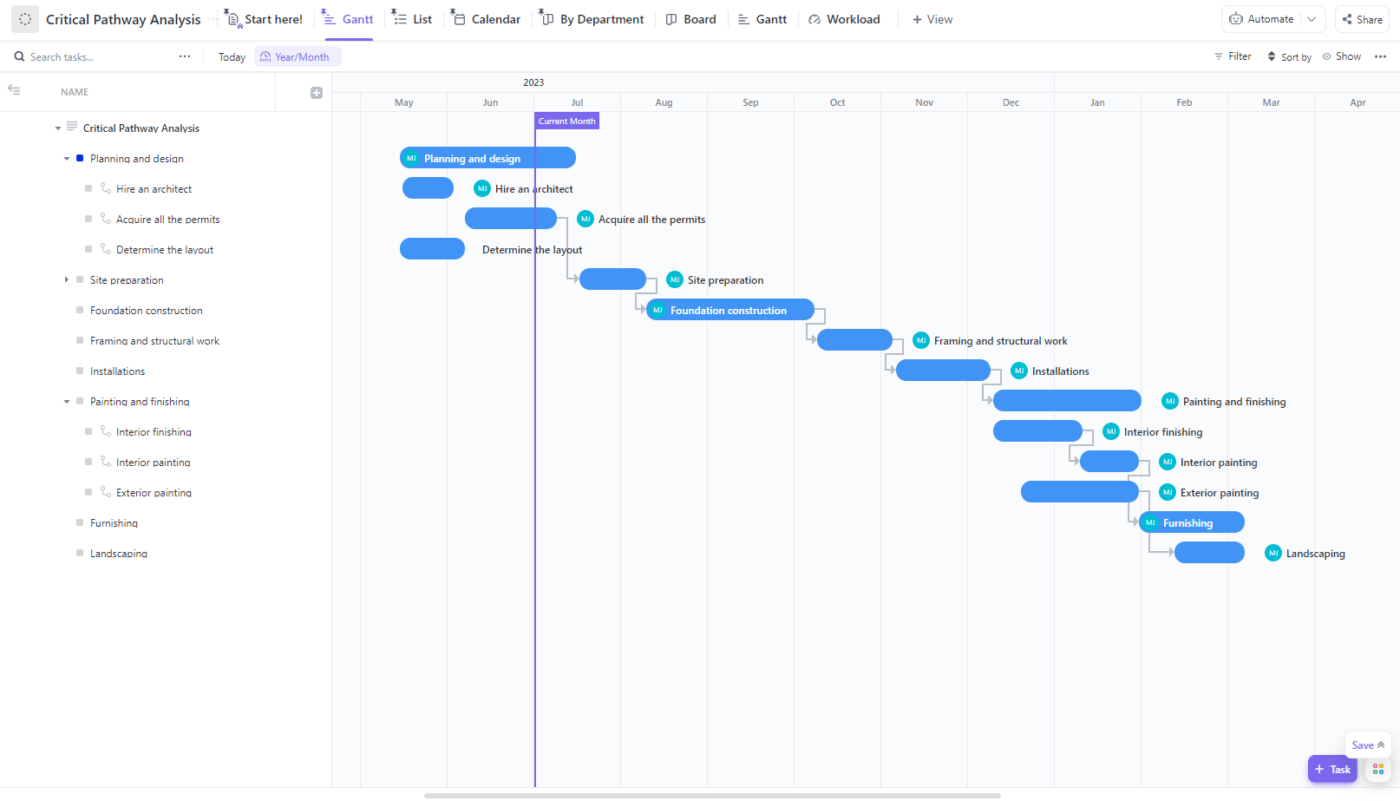
3. Plot your S-curve
Once you’ve selected the two data points you want to draw an S-curve with, you’re ready to plot them! For example, if you want to create a burn up chart, ClickUp’s Dashboard allows you to create them automatically.

The cumulative flow diagram can also help you monitor your project’s actual progress versus expected progress on an S-curve. As your project progresses, you can create widgets for any data points you need. You can even customize the data source for granular reporting to measure progress.
4. Take action with your S-curve
Once your graph is ready, use ClickUp’s Whiteboard as a workspace to make sense of the information. Add shapes, charts, diagrams, and other visual elements to your S-curve to present a complete context.
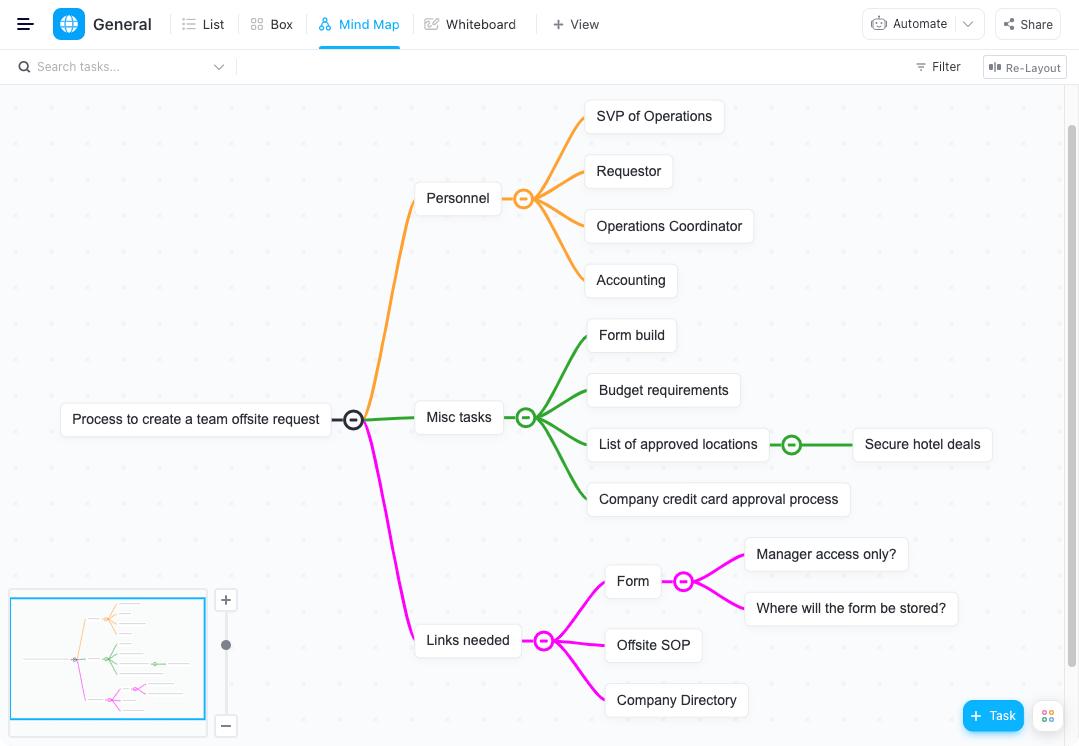
Open up ClickUp Mind Maps to understand the connections between the items, tasks, and projects. You can also use our data flow diagram templates to visualize how your decisions on any parameter can influence others.
Optimize workflows and make better decisions based on the data-driven graphs and charts at hand.
Ride Up the S-Curve with ClickUp
The success of a project manager is defined by delivery ‘on time and in budget.’ The biggest challenge project managers face in achieving this is a lack of visibility. Often, they’re too focused on the trees that they miss the forest, even if inadvertently.
ClickUp’s project management tool is designed to prevent that. With ClickUp, you can get into granular detail about any aspect of a project, such as task, sub-task, checklists and so on.
You can also just as easily zoom out and see the bigger picture on your dashboard every single day, updated in real time.
S-curve is simply one of the dozens of charts and graphs you can access on ClickUp. Kanban boards, timelines, table views, goals, time tracking, and dozens of external integrations give you everything you need to progress as planned.


Everything you need to stay organized and get work done.

Recent Articles
Claude Skills for Project Management: A Practical Guide 
Claude Skills for Project Management: A Practical Guide
How to Write a Scope of Work (+ Examples & Templates)
How to Write a Scope of Work (+ Examples & Templates)
What Are Project Goals? Definition, Examples & How To Write Them 
What Are Project Goals? Definition, Examples & How To Write Them
